


Introduction and aim. The prevalence of obesity, type 2 diabetes mellitus and non-alcoholic fatty liver disease are increasing. Type 2 diabetes mellitus may aggravate non-alcoholic fatty liver disease, increasing the risk of developing cirrhosis and hepatocellular carcinoma. This study aims to determine the effect of type 2 diabetes mellitus and insulin therapy on non-alcoholic fatty liver disease in the patients with morbid obesity. Material and methods. Clinical, anthropometric and laboratory data were analyzed together with intraoperative liver biopsies from morbidly obese patients undergoing bariatric surgery. Results. 219 patients with morbid obesity were evaluated. Systemic arterial hypertension (55.9% vs. 33.8%, p = 0.004) and dyslipidemia (67.1% vs. 39.0%, p < 0.001) were more prevalent in patients with diabetes when compared to patients without diabetes. In multivariate analysis, type 2 diabetes mellitus was an independent risk factor for severe steatosis (RR = 2.04, p = 0.023) and severe fibrosis (RR = 4.57, p = 0.013). Insulin therapy was significantly associated with non-alcoholic steatohepatitis (RR = 1.89, p = 0.001) and fibrosis (RR = 1.75, p = 0.050) when all patients were analysed, but when only patients with diabetes were analysed, insulin therapy was not associated with non-alcoholic steatohepatitis or fibrosis. Conclusion. Type 2 diabetes mellitus plays an important role in the progression of non-alcoholic fatty liver disease as an independent risk factor for severe fibrosis.
Current data show a worldwide epidemic of obesity and type 2 diabetes mellitus (T2DM), with a corresponding exponential impact on the prevalence of non-alcoholic fatty liver disease (NAFLD).1–4 T2DM is associated with poor progression of the disease and the development of non-alcoholic steatohepatitis (NASH) and fibrosis (Fb). The presence of Fb in NAFLD is predictive of long-term complications and associated with a high risk of mortality.5–9
Several factors influence the progression of NAFLD, including genetic factors, environmental factors (nutrition and physical activity), adipocytic hormonal modulation, insulin resistance, dysbiosis and increased intestinal permeability, mitochondrial dysfunction, and oxidative stress with lipid peroxidation. The presence of T2DM accentuates these factors.10–20 Moreover, it was recently shown that patients with diabetes receiving insulin therapy have high levels of C-reactive protein and malondialdehyde, which are markers of oxidative stress and inflammation, respectively,21 and are correlated with a high risk of mortality.5–9
The mainstay of treatment for NAFLD is lifestyle modification. Weight loss improves hepatic steatosis, and bariatric surgery is an effective treatment for patients with morbid obesity (MO), having significant effects on pathophysiological mechanisms and NAFLD remission rates.3,22–27
The aim of this study was to determine the influence of T2DM and insulin therapy use on the severity of NAFLD in patients with MO.
Material and MethodsIn this retrospective, observational cohort study, we evaluated patients with MO undergoing bariatric surgery at the Obesity Treatment Center in the Irmandade da Santa Casa de Misericórdia de Porto Alegre. Data were collected between September 2014 and November 2015. Patient inclusion criteria were aged 18 years or over, having undergone the first surgery for treatment of MO and having an intraoperative liver biopsy. The exclusion criteria are: patients with positive serological markers for hepatitis B or C virus, those who had preoperative placement of an intragastric balloon, and those regularly consuming alcohol (> 20 g for women and > 30 g for men).22
The following anthropometric parameters were evaluated by a nutritionist: weight at the first and last preoperative consultation, weight change (kg), height, and waist circumference. Body mass index (BMI) was calculated using the weight and height data.28 The duration of obesity was determined in years and recorded according to information provided by the patient.
We collected the following laboratory data on glycemic and lipid profile: fasting blood sugar, two-hour 75-gram oral glucose tolerance, HbA1C, total cholesterol, low-density lipoprotein cholesterol (LDL-C), high-density li-poprotein cholesterol (H-CDL), non-HDL cholesterol (calculated), and triglycerides.29 We considered the hepatic function tests available for the patients, which incuded tests for aspartate aminotransferase (AST), alanine ami-notransferase (ALT), alkaline phosphatase, gamma-glutamyl transpeptidase and albumin. Transferrin and ferritin were also evaluated and AST and ALT were categorized as altered when above 42 U/L (reference value).
T2DM diagnosis was based on the American Diabetes Association criteria: HbA1C ≥ 6.5%, or fasting blood sugar ≥ 126 mg/dL, or postprandial blood sugar ≥ 200 mg/dL after two hours, during a 75-gram oral glucose tolerance test, or random blood sugar ≥ 200 mg/dL, in the presence of classic symptoms of hyperglycemia.30 Patients using an oral hypoglycemic agent and receiving insulin therapy were also considered to have T2DM.
Patients were considered to have dyslipidemia according to their lipid profile, based on the criteria established by the V Brazilian Guidelines on Dyslipidemia and Prevention of Atherosclerosis: total cholesterol ≥ 240 mg/dL – high; C-LDL 160-189 mg/dL – high, > 190 mg/dL – very high; HDL-C < 40 mg/dL – low; triglycerides 160-189 mg/dL – high, ≥ 190 mg/dL – very high, non-HDL-C 160189 mg/dL – high, and ≥ 190 mg/dL – very high.29 High blood pressure (HBP) was determined when indicated in a patient’s list of problems, in clinical progression and/or by demonstrable ongoing use of antihypertensive drugs. The HBP cut-off was systolic blood pressure ≥ 140 mmHg and/or diastolic blood pressure ≥ 90 mmHg, measured during consultation.31
Anatomopathological evaluation of liver biopsies, routinely collected during the course of bariatric surgery, was performed by a single pathologist who was blind to the clinical data. The following histochemical stains were used for morphological analysis of specimens: hematoxylin/eosin, Masson trichrome (to determine Fb), and Perls (to determine siderosis). Steatosis was confirmed when it affected more than 5.0% of the sample, and the degree of steatosis was categorized as mild between 5.0 and 33.0%, moderate between 33.0 and 66.0%, and severe ≥ 66.0%. NASH diagnosis was determined in the presence of steatosis associated with hepatocellular ballooning and inflammatory infiltrate. NASH activity was classified as mild, moderate, and severe, as described by the Pathology Committee of the NASH Clinical Research Network. The presence of Fb was established and categorized according to four stages. Stage 1 was subdivided into 1A (mild cellular/ sinusoidal Fb), 1B (dense and diffuse cellular/sinusoidal Fb), and 1C (portal Fb). Stage 2 was considered as pericellular/perisinusoidal Fb associated with the portal fibrosis. In Stage 3, there were previous changes associated with septal Fb and Stage 4 indicated cirrosis.32 For statistical analysis, the degree of Fb was classified as mild (stages 1A, 1B, 1C, and 2) and severe (stages 3 and 4).
This study was approved by the Research Ethics Committee of Irmandade da Santa Casa de Misericordia de Porto Alegre under the number 717.827.
The sample calculation was performed using Programs for Epidemiologists, version 4.0, which estimated a minimum of 210 patients, of whom 70 have diabetes and 140 do not. Statistical analysis was performed using the Statistical Package for the Social Sciences, version 21.0. Continuous variables were described by average and standard deviation, or median and interquartile range, and their distribution was evaluated using the Kolmogorov-Smirnov test. Categorical variables were described in absolute and relative frequencies. The t-test was used to compare continuous variables. In cases of asymmetry, we used the Mann-Whitney test. The Kruskal-Wallis and Dunn tests were used to compare variables with asymmetrical distribution in more than two groups. To compare categorical variables, the Pearson χ2 test was used for polytomous variables, together with analysis of the adjusted residuals. The χ2 test with Yates’ correction was used for dichotomous variables. Poisson regression analysis was used to control confounding factors and analyze variables independently associated with NASH and Fb. The Relative Risk (RR) measure of association was used with a confidence interval of 95.0%. A p value < 0.20 in the bivariate analysis was required to enter a variable in this multivariate model. The level of statistical significance was set to 5.0% (p ≤ 0.05).
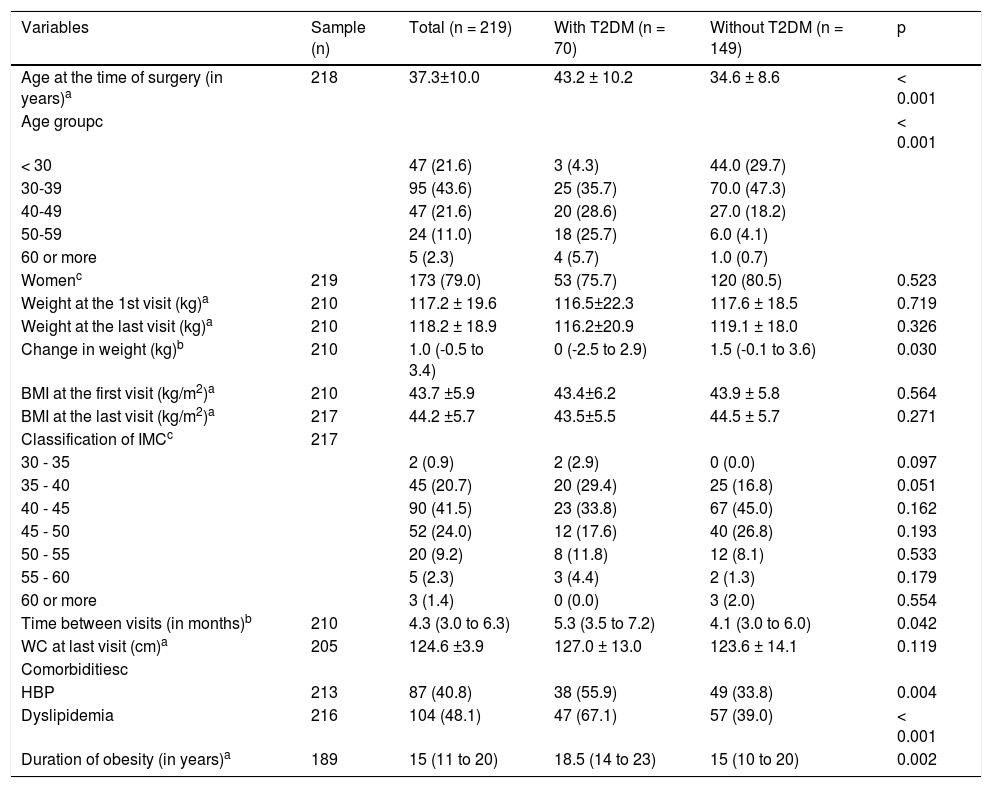
ResultsTwo patients were excluded due to viral hepatitis and 219 patients were therefore evaluated, 70 of whom were patients with diabetes. The average age was 37.3 ± 10.0 years, distributed in the age groups shown in table 1. Patients with diabetes were significantly older than without diabetes. Sampling consisted of 173 female patients (79.0%) and there was no significant difference between the groups in terms of gender. With regard to associated comorbidities, HBP and dyslipidemia were more prevalent in patients with diabetes, as the duration of obesity (Table 1).
Demographic and anthropometric characteristics and characteristics of sample comorbidities.
| Variables | Sample (n) | Total (n = 219) | With T2DM (n = 70) | Without T2DM (n = 149) | p |
|---|---|---|---|---|---|
| Age at the time of surgery (in years)a | 218 | 37.3±10.0 | 43.2 ± 10.2 | 34.6 ± 8.6 | < 0.001 |
| Age groupc | < 0.001 | ||||
| < 30 | 47 (21.6) | 3 (4.3) | 44.0 (29.7) | ||
| 30-39 | 95 (43.6) | 25 (35.7) | 70.0 (47.3) | ||
| 40-49 | 47 (21.6) | 20 (28.6) | 27.0 (18.2) | ||
| 50-59 | 24 (11.0) | 18 (25.7) | 6.0 (4.1) | ||
| 60 or more | 5 (2.3) | 4 (5.7) | 1.0 (0.7) | ||
| Womenc | 219 | 173 (79.0) | 53 (75.7) | 120 (80.5) | 0.523 |
| Weight at the 1st visit (kg)a | 210 | 117.2 ± 19.6 | 116.5±22.3 | 117.6 ± 18.5 | 0.719 |
| Weight at the last visit (kg)a | 210 | 118.2 ± 18.9 | 116.2±20.9 | 119.1 ± 18.0 | 0.326 |
| Change in weight (kg)b | 210 | 1.0 (-0.5 to 3.4) | 0 (-2.5 to 2.9) | 1.5 (-0.1 to 3.6) | 0.030 |
| BMI at the first visit (kg/m2)a | 210 | 43.7 ±5.9 | 43.4±6.2 | 43.9 ± 5.8 | 0.564 |
| BMI at the last visit (kg/m2)a | 217 | 44.2 ±5.7 | 43.5±5.5 | 44.5 ± 5.7 | 0.271 |
| Classification of IMCc | 217 | ||||
| 30 - 35 | 2 (0.9) | 2 (2.9) | 0 (0.0) | 0.097 | |
| 35 - 40 | 45 (20.7) | 20 (29.4) | 25 (16.8) | 0.051 | |
| 40 - 45 | 90 (41.5) | 23 (33.8) | 67 (45.0) | 0.162 | |
| 45 - 50 | 52 (24.0) | 12 (17.6) | 40 (26.8) | 0.193 | |
| 50 - 55 | 20 (9.2) | 8 (11.8) | 12 (8.1) | 0.533 | |
| 55 - 60 | 5 (2.3) | 3 (4.4) | 2 (1.3) | 0.179 | |
| 60 or more | 3 (1.4) | 0 (0.0) | 3 (2.0) | 0.554 | |
| Time between visits (in months)b | 210 | 4.3 (3.0 to 6.3) | 5.3 (3.5 to 7.2) | 4.1 (3.0 to 6.0) | 0.042 |
| WC at last visit (cm)a | 205 | 124.6 ±3.9 | 127.0 ± 13.0 | 123.6 ± 14.1 | 0.119 |
| Comorbiditiesc | |||||
| HBP | 213 | 87 (40.8) | 38 (55.9) | 49 (33.8) | 0.004 |
| Dyslipidemia | 216 | 104 (48.1) | 47 (67.1) | 57 (39.0) | < 0.001 |
| Duration of obesity (in years)a | 189 | 15 (11 to 20) | 18.5 (14 to 23) | 15 (10 to 20) | 0.002 |
Variables described as
T2DM: type 2 diabetes mellitus. BMI: body mass index. WC: waist circumference. HBP: high blood pressure.
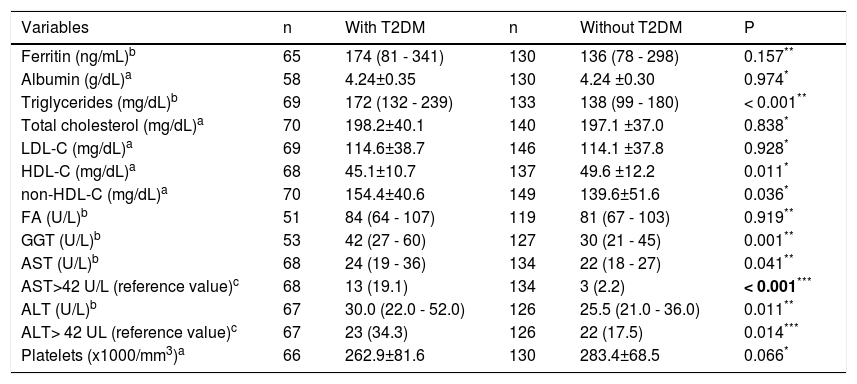
Average fasting blood sugar and HbA1c in patients with diabetes compared to patients without diabetes were 147.9 ± 53.9 mg/dL vs. 88.5 ± 10.0 mg/dL (p < 0.001) and 7.48 ± 2.03% vs. 5.43 ± 0.36% (p<0.001), respectively, and are clearly T2DM-related. With regard to lipid profile, higher levels of triglycerides and non-HDL-C were found more frequently in the patients with diabetes group. On the other hand, HDL-C was significantly higher in patients without diabetes. Patients with diabetes had a higher prevalence of aminotransferase abnormalities.The median values for AST, ALT, and gamma-glutamyl transpeptidase were also higher in patients with diabetes (Table 2).
Comparison between patients with and without diabetes —laboratory tests
| Variables | n | With T2DM | n | Without T2DM | P |
|---|---|---|---|---|---|
| Ferritin (ng/mL)b | 65 | 174 (81 - 341) | 130 | 136 (78 - 298) | 0.157** |
| Albumin (g/dL)a | 58 | 4.24±0.35 | 130 | 4.24 ±0.30 | 0.974* |
| Triglycerides (mg/dL)b | 69 | 172 (132 - 239) | 133 | 138 (99 - 180) | < 0.001** |
| Total cholesterol (mg/dL)a | 70 | 198.2±40.1 | 140 | 197.1 ±37.0 | 0.838* |
| LDL-C (mg/dL)a | 69 | 114.6±38.7 | 146 | 114.1 ±37.8 | 0.928* |
| HDL-C (mg/dL)a | 68 | 45.1±10.7 | 137 | 49.6 ±12.2 | 0.011* |
| non-HDL-C (mg/dL)a | 70 | 154.4±40.6 | 149 | 139.6±51.6 | 0.036* |
| FA (U/L)b | 51 | 84 (64 - 107) | 119 | 81 (67 - 103) | 0.919** |
| GGT (U/L)b | 53 | 42 (27 - 60) | 127 | 30 (21 - 45) | 0.001** |
| AST (U/L)b | 68 | 24 (19 - 36) | 134 | 22 (18 - 27) | 0.041** |
| AST>42 U/L (reference value)c | 68 | 13 (19.1) | 134 | 3 (2.2) | < 0.001*** |
| ALT (U/L)b | 67 | 30.0 (22.0 - 52.0) | 126 | 25.5 (21.0 - 36.0) | 0.011** |
| ALT> 42 UL (reference value)c | 67 | 23 (34.3) | 126 | 22 (17.5) | 0.014*** |
| Platelets (x1000/mm3)a | 66 | 262.9±81.6 | 130 | 283.4±68.5 | 0.066* |
Variables described as
absolute and relative frequency: n (%). T2DM: type 2 diabetes mellitus. LDL-C: low-density lipoprotein cholesterol. HDL-C: high-density lipoprotein cholesterol. non HDL-C: non HDL cholesterol (total cholesterol -HDL-C). ALP: alkaline phosphatase. GGT: gamma-glutamyl transpeptidase. AST: aspartate aminotransferase. ALT: alanine aminotransferase.
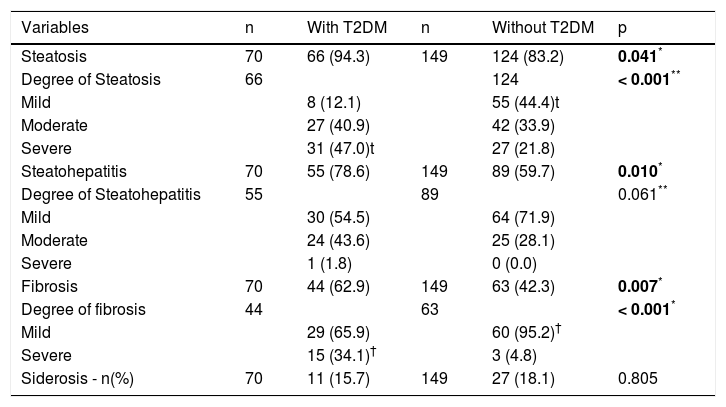
Anatomopathological findings showed that steatosis was more frequent in patients with diabetes, and there was a statistically significant difference between severe steatosis in patients with diabetes and mild steatosis in patients without diabetes (p < 0.001). The presence of NASH and severe fibrosis were similarly more frequent in individuals with diabetes (Table 3).
Comparison of anatomopathological findings between patients with and without diabetes.
| Variables | n | With T2DM | n | Without T2DM | p |
|---|---|---|---|---|---|
| Steatosis | 70 | 66 (94.3) | 149 | 124 (83.2) | 0.041* |
| Degree of Steatosis | 66 | 124 | < 0.001** | ||
| Mild | 8 (12.1) | 55 (44.4)t | |||
| Moderate | 27 (40.9) | 42 (33.9) | |||
| Severe | 31 (47.0)t | 27 (21.8) | |||
| Steatohepatitis | 70 | 55 (78.6) | 149 | 89 (59.7) | 0.010* |
| Degree of Steatohepatitis | 55 | 89 | 0.061** | ||
| Mild | 30 (54.5) | 64 (71.9) | |||
| Moderate | 24 (43.6) | 25 (28.1) | |||
| Severe | 1 (1.8) | 0 (0.0) | |||
| Fibrosis | 70 | 44 (62.9) | 149 | 63 (42.3) | 0.007* |
| Degree of fibrosis | 44 | 63 | < 0.001* | ||
| Mild | 29 (65.9) | 60 (95.2)† | |||
| Severe | 15 (34.1)† | 3 (4.8) | |||
| Siderosis - n(%) | 70 | 11 (15.7) | 149 | 27 (18.1) | 0.805 |
Variables described as absolute and relative frequency: n (%).
Upon analyzing insulin therapy among all patients, it was demonstrated that severe steatosis was more prevalent in the group of patients with diabetes receiving insulin (10 patients) therapy than in the group not receiving insulin therapy and that patients without diabetes group (50.0% vs. 45.4% vs. 21.8% respectively) (p < 0.001). The presence of NASH was identified in 100.0% of patients with T2DM receiving insulin therapy, in 77.1% of the patients with T2DM not receiving insulin therapy, and in 59.7% of those without T2DM (p = 0.006). Similarly, moderate or severe NASH was more frequent in patients receiving insulin therapy (p = 0.040). Fb was present in 90.0% of patients with T2DM receiving insulin therapy, in 60.4% of patients with T2DM not receiving insulin therapy, and in 42.3% of those without T2DM (p = 0.003). Similarly, severe Fb was more frequently seen in patients receiving insulin therapy (p < 0.001).
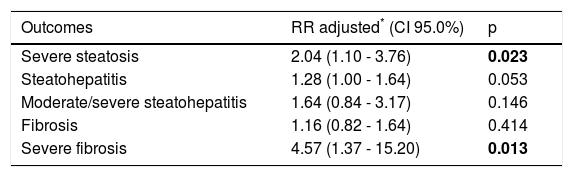
In multivariate analysis, comparing patients with diabetes and those without diabetes, the RR of severe steatosis was 2.04 (p = 0.023) and the RR of severe Fb was 4.57 (p = 0.013) (Table 4).
Multivariate Poisson regression analysis to evaluate T2DM as a factor independently associated with the study outcomes.
| Outcomes | RR adjusted* (CI 95.0%) | p |
|---|---|---|
| Severe steatosis | 2.04 (1.10 - 3.76) | 0.023 |
| Steatohepatitis | 1.28 (1.00 - 1.64) | 0.053 |
| Moderate/severe steatohepatitis | 1.64 (0.84 - 3.17) | 0.146 |
| Fibrosis | 1.16 (0.82 - 1.64) | 0.414 |
| Severe fibrosis | 4.57 (1.37 - 15.20) | 0.013 |
Insulin therapy was significantly associated with NASH with an adjusted RR of 1.89 (1.29-2.78, p = 0.001), moderate or severe NASH with an adjusted RR of 4.17 (1.02-17.00, p = 0.046); Fb with an adjusted RR of 1.75 (1.00-3.06, p = 0.050), and severe Fb with an adjusted RR of 12.30 (2.13-71.20, p = 0.005) when all patients were analysed, but when only patients with diabetic were analysed, insulin therapy was not associated with NASH or fibrosis.
DiscussionIncluding all patients, insulin therapy seems to be an independent risk factor for NASH and Fb, but when only patients with diabetes were analysed, this association didn’t have a statistical significance. It was postulated that patients receiving insulin therapy have higher levels of oxidative stress markers (malondialdehyde) and inflammation (C-reactive protein).21,22,33 In a recent study, individuals with T2DM were evaluated based on type of treatment. Group 1 received an oral hypoglycemic agent and Group 2 received an oral hypoglycemic agent plus insulin. Significantly higher levels of BMI, malondialdehyde, and C-reactive protein were found in the patients in Group 2.34
In this study, patients with diabetes and MO were older and had a longer average duration of obesity than patients without diabetes. Other studies corroborate these findings, since age and duration of obesity can be associated with greater insulin resistance in these patients.4,5,8,35 These factors (more advanced age, obesity, and metabolic syndrome) contribute to the progression and aggravation of NAFLD in T2DM patients.5,8,35,36 With regard to lipid profile, patients with diabetes showed more pronounced dyslipidemia compared to patients without diabetes. The literature suggests that the severity of dyslipidemia is associated with systemic insulin resistance.37 In addition to dyslipidemia, patients with diabetes also had a greater prevalence of HBP, another component of metabolic syndrome.
Abnormalities in aminotransferases and gamma-glutamyl transpeptidase are associated with the presence of NAFLD and, in some studies, with the severity of NAFLD.5,7 In a study of 250 patients with MO, Losekann, et al. showed that an increase in ALT was strongly associated with the presence of Fb. Moreover, even when aminotransferases were within normal ranges, the median of these values was higher in patients with a higher prevalence of NASH and in Fb.7
Liver biopsy is the gold standard for diagnosing and staging NASH and is the preferred method in cases of NAFLD with a risk of more advanced disease.22,27
This study has shown that T2DM patients with MO have a higher prevalence of steatosis and that severe steatosis was also seen more often in this patient subgroup. Similarly, NASH and Fb were seen significantly more often and more severe in patients with diabetes. These findings are also described in other studies that have identified an association between T2DM and more aggressive and progressive forms of NAFLD, emphasizing the greater risk of severe NAFLD in these patients.23,33,38–42 T2DM and NAFLD patients have more severe insulin resistance than patients without NAFLD.43 A study on NASH found that reduced glucose tolerance, including T2DM, was detected in 60.0% of NAFLD patients and that postprandial hyperinsulinemia, and not levels of glucose, was associated with advanced Fb.39
The limitations of this study are related to its retrospective design and to the small number of insulin-using patients with diabetes studied.
In conclusion, our findings confirm the association of T2DM and reinforce the role of diabetes in progressive forms of NAFLD.
Abbreviations- •
ALT: alanine aminotransferase.
- •
AST: aspartate aminotransferase.
- •
BMI: Body Mass Index.
- •
Fb: fibrosis.
- •
HbAlc: glycated hemoglobin.
- •
HBP: high blood pressure.
- •
HDL-C: High-Density Lipoprotein Cholesterol.
- •
LDL-C: Low-Density Lipoprotein Cholesterol.
- •
MO: morbid obesity.
- •
NAFLD: nonalcoholic fatty liver disease.
- •
NASH: nonalcoholic steatohepatitis.
- •
RR: relative risk.
- •
T2DM: type 2 diabetes mellitus.
The authors declare that there are no conflicts of interest.


