Autophagy has emerged as a critical regulatory pathway in non-alcoholic fatty liver disease (NAFLD). However, the variability of hepatic autophagy during NAFLD development remains controversial. This study aimed to elucidate the dynamics of hepatic autophagy and its underlying mechanism during NAFLD development both in vivo and in vitro.
Materials and methodsAutophagy markers were evaluated in the livers of mice fed a high fat diet or a methionine-choline-deficient diet and in HepG2 cells treated with palmitic acid (PA) by western blotting. Intrahepatic and intracellular triacylglycerol levels were assessed using biochemical quantification and lipid staining. Autophagic flux was monitored using an LC3 turnover assay and tandem mRFP-GFP-LC3 fluorescence analysis.
ResultsHepatic autophagy was enhanced in early stages but blocked at later stages of NAFLD development both in vivo and in vitro. Analysis of autophagic flux revealed that both autophagic synthesis and degradation were initially activated and progressively inhibited afterwards. The activation of mammalian target of rapamycin complex 1 (mTORC1), a central regulator of autophagy, was found to be negatively correlated with autophagic synthesis; moreover, pharmacological inhibition of mTORC1 by rapamycin alleviated hepatic steatosis through recovery of autophagic flux in hepatocytes with prolonged PA treatment.
ConclusionsHepatic autophagy fluctuates during the development of NAFLD in which mTORC1 signalling plays a critical regulatory role, suggesting a therapeutic potential of autophagy modulation by targeting the mTORC1 signalling pathway in NAFLD.
Non-alcoholic fatty liver disease (NAFLD) is a spectrum of liver diseases ranging from simple steatosis to steatohepatitis, which can progress to fibrosis, cirrhosis, and ultimately hepatocellular carcinoma. NAFLD has an estimated global prevalence of 25.24%, with 10–20% of cases progressing to steatohepatitis [1]; furthermore, over 30% of patients with steatohepatitis will develop severe fibrosis and/or cirrhosis which can eventually progress to hepatocellular carcinoma and lead to increased mortality despite recent advances in its diagnosis and prediction [2–7]. The pathogenesis of NAFLD is complicated and multi-faceted including diet, insulin resistance, genetic factors, lipid metabolic disorder, chronic inflammation, and so forth [8]. Due to the limited understanding of pathogenesis, no efficient pharmacotherapy has been approved for the clinical treatment of NAFLD. Therefore, there is an urgent need to better understand the pathological mechanisms of NAFLD and identify potential therapeutic targets.
Autophagy is a genetically programmed and phylogenetically conserved process of autodigestion to promote cellular survival and maintain cellular homeostasis [9]. In mammalian cells, autophagy begins with the formation of a double-membrane autophagosome which then moves along the cytoskeletal structures to fuse with lysosomes for degradation [10]. Among the numerous factors regulating autophagy, mammalian target of rapamycin complex 1 (mTORC1) is considered to be the central regulator that senses nutritional status and metabolic stress [11]. Previous studies have demonstrated that autophagy and mTORC1 signalling play an essential role in hepatic lipid metabolism, and pharmacological modulation of autophagy can exert a therapeutic effect in obesity, metabolic syndrome, and NAFLD [12–14]. However, the dynamic variability of hepatic autophagy and mTORC1 signalling in response to progressive steatosis during the development of NAFLD remain largely unknown. To address this issue, we examined the dynamics of hepatic autophagy and mTORC1 signalling and evaluated their relationship in in vivo and in vitro models of NAFLD.
2Materials and methods2.1Animals and dietsMale FVB/N mice were maintained at room temperature with a 12:12h light:dark cycle and free access to drinking water and chow. At 6–8 wks of age, mice were fed a normal chow diet (NCD), a high fat diet (HFD, D12327, Research Diets, NJ, USA), or a methionine-choline-deficient diet (MCDD, A02082002BR, Research Diets, NJ, USA). At designated time points, mice (n=6 per group) were sacrificed and livers were harvested for subsequent analysis. All animal experiments were approved by the Ethical Committee of Fudan University and conducted in accordance with the National Institutes of Health Guide for the Care and Use of Laboratory Animals.
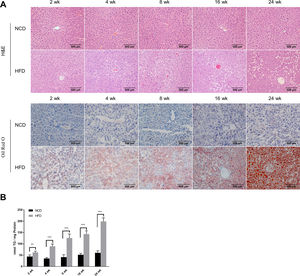
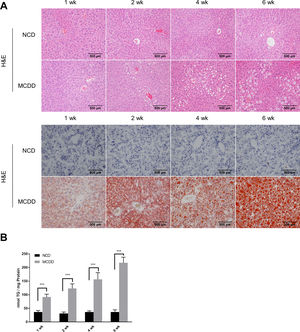
2.2Histological analysisAfter fasting for 12h, mice were sacrificed under anaesthesia by intraperitoneal injection of sodium pentobarbital (80mg/kg). Liver tissues were fixed with 10% neutral buffered formalin for 24h and subjected to routine histological processing. Haematoxylin and eosin (H&E) staining and Oil red O staining were performed to assess the severity of hepatic steatosis. Slides were visualized using a light microscope (Nikon, Tokyo, Japan). All microscopic examinations were performed by the same researcher who was blinded to treatment assignments.
2.3Cell culture and treatmentHepG2 cells were cultured in Dulbecco's modified Eagle's medium supplemented with 10% foetal bovine serum and 1% penicillin–streptomycin in a humidified 5% CO2 incubator at 37°C. An in vitro model of NAFLD was established according to the method described by Yan et al. [15]. Briefly, 1×10⁵ cells were seeded into 6-well plates, cultured for 24h, and then exposed to 0.25mM palmitic acid (PA, P9767, Sigma-Aldrich, MO, USA) for the indicated time periods. To assess the role of autophagy in the development of NAFLD, cells were cotreated with chloroquine (CQ, 20μM, C6628, Sigma-Aldrich, MO, USA) or rapamycin (Rap, 25ng/ml, A8167, APExBIO, TX, USA).
2.4Tandem mRFP-GFP fluorescence microscopyTandem fluorescent-tagged LC3 is a convenient assay for monitoring autophagic flux based on different pH stability of mRFP and GFP fluorescent proteins, however, the plasmid and transfection reagent might have some toxic effects in cultured cells which needs to be noted. In this study, the tandem mRFP-GFP-LC3 plasmid was provided by Addgene (21074, MA, USA) and transfected using Lipo3000 reagent (Invitrogen, CA, USA) according to the manufacturer's instructions. Briefly, HepG2 cells were cultured on glass coverslips and transiently transfected with 2μg of mRFP-GFP-LC3 plasmid. Subsequently, cells were exposed to 0.25mM PA for the indicated time periods. Images were acquired using an FV3000 confocal microscope (Olympus, Tokyo, Japan). Quantification of GFP-LC3 and mRFP-LC3 puncta were performed using ImageJ software version 1.46 (NIH, Bethesda, MD, USA).
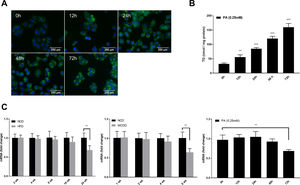
2.5Lipid staining and triacylglycerol quantificationCellular lipid staining was performed as previously described [16]. Briefly, HepG2 cells were fixed with 4% paraformaldehyde for 10min, then washed three times with phosphate buffer saline (PBS). After washing, cells were incubated with BODIPY 493/503 (D3922, Thermo Fisher Scientific, MA, USA) at room temperature for 1h, followed by three washes with PBS. Cells were then counterstained with 6-diamidino-2-phenylindole to visualize the nuclei. Fluorescence images were obtained using a fluorescence microscope (Nikon, Japan). The levels of triacylglycerol (TG) in hepatic tissues and HepG2 cells were determined using a TG assay kit (Applygen Technologies, Beijing, China) according to the manufacturer's instructions. TG content was normalized by total protein level.
2.6Quantitative real-time polymerase chain reaction (qRT-PCR)Total RNA was extracted using TRIzol reagent (15596018, Invitrogen, CA, USA) and reverse transcribed using a High-Capacity RNA-to-cDNA Kit (4388950, Applied Biosystems, CA, USA) according to the manufacturer's instructions. Gene expression was quantified using SYBR Green master mix (A25780, Thermo Fisher Scientific, MA, USA) and a LightCycler 480 II instrument (Roche, Burgess Hill, UK). Relative gene expression was normalized to GAPDH and expressed as 2−ΔΔCt. The primer sequences used in this study are listed below. Gapdh (M. musculus): forward: AAC TCC CAC TCT TCC ACC TTCG, reverse: TCC ACC ACC CTG TTG CTG TAG; Sqstm1 (M. musculus): forward: AGG ATG GGG ACT TGG TTGC, reverse: TCA CAG ATC ACA TTG GGG TGC; GAPDH (H. sapiens): forward: GAG TCA ACG GAT TTG GTC GT, reverse: CAT GGG TGG AAT CAT ATT GGA; and SQSTM1 (H. sapiens): forward: AAG CCG GGT GGG AAT GTTG, reverse: CCT GAA CAG TTA TCC GAC TCC AT.
2.7Western blot analysisHomogenized tissues and cells were lysed in RIPA lysis buffer with protease and phosphatase inhibitors on ice for 30min and centrifuged at 12,000g for 15min at 4°C. Protein concentrations were determined using the Pierce BCA protein assay kit (23225, Thermo Fisher Scientific, MA, USA). Total protein (30μg) was separated by sodium dodecyl sulphate-polyacrylamide gel electrophoresis (SDS-PAGE) and transferred to polyvinylidene fluoride membranes, which were blocked with 5% bovine serum albumin in tris-buffered saline solution with Tween-20 detergent (TBS-T; 25mM Tris–HCl pH 8.0, 150mM NaCl, 0.1% Tween-20) for 2h followed by incubation with primary antibodies overnight. Immunoreactive bands were visualized using enhanced chemiluminescence reagent (G2014, Servicebio, Wuhan, China) and an ImageQuant LAS 4000 system. GAPDH (30201ES20, Yeasen, Shanghai, China) was used as a loading control to normalize expression of the target proteins. Primary antibodies against P70S6K (9202) and p-P70S6K (Thr389, 9234) were supplied by Cell Signaling Technology (MA, USA). Primary antibodies against LC3 (M186-3) and P62 (PM045) were supplied by MBL International Corporation (Nagoya, Japan).
2.8Statistical analysisAll statistical analyses were performed using SPSS version 22.0 (IBM Corporation, NY, USA) and GraphPad Prism 7.0 (GraphPad Software, CA, USA). Data are presented as mean±standard deviation and were compared using a Student's t-test or one-way ANOVA with post hoc analysis. Correlation was analyzed using the Pearson correlation coefficient. Differences were considered statistically significant for P<0.05.
3Results3.1Characteristics of in vivo and in vitro NAFLD modelsTo simulate the development and progression of NAFLD, mice were treated with HFD or MCDD, and HepG2 cells were treated with 0.25mM PA for different time periods. In mice treated with HFD or MCDD, hepatic steatosis was gradually aggravated in a time-dependent manner, as confirmed by histological analysis and TG determination (Supplementary Figs. 1 and 2). In HepG2 cells, intracellular lipid accumulation increased progressively as PA treatment was extended and was confirmed by lipid staining with the fluorescent dye BODIPY 493/503 and TG determination (Supplementary Fig. 3A and B).
3.2Hepatic autophagy is impaired in both in vivo and in vitro models of NAFLDAlthough impaired autophagy is a common defect found in NAFLD, it is not clear how the pattern of autophagy changes. We thus investigated the dynamics of hepatic autophagy in both HFD-induced and MCDD-induced in vivo murine models and a PA-induced in vitro model of NAFLD. As shown in Fig. 1, the autophagy marker LC3-II was found to be increased during the course of HFD and MCDD treatment, peaking at 16 weeks for HFD and 2 weeks for MCDD. However, P62, a selective substrate of autophagy, was decreased in the early stages (HFD: 2wk, MCD: 1wk) and then gradually increased. Similarly, LC3-II was significantly increased throughout the duration of PA treatment in HepG2 cells and peaked at 48h. However, P62 was reduced at 12h, then increased with a peak at 48h (Fig. 1C). As the increase in P62 gene expression may be caused by impaired autophagic degradation or increased transcription of P62 gene [17]. We next determined the mRNA expression level of the P62 gene in the murine liver and HepG2 cells. The results of qRT-PCR further supported that autophagy is impaired at later stages of NAFLD both in vivo and in vitro (Supplementary Fig. 3C). Altogether, these results indicate that hepatic autophagy is enhanced in the early stages but blocked in the later stages of NAFLD.
. Representative images of western blots for LC3 and P62 in the livers of HFD-fed (A) and MCDD-fed (B) mice, and in PA-treated HepG2 cells (C). *P<0.05, **P<0.01, and ***P<0.001. NCD: normal chow diet; HFD: high fat diet; MCDD: methionine-choline-deficient diet; PA: palmitic acid.")
Impaired hepatic autophagy in both in vivo and in vitro models of non-alcoholic fatty liver disease (NAFLD). Representative images of western blots for LC3 and P62 in the livers of HFD-fed (A) and MCDD-fed (B) mice, and in PA-treated HepG2 cells (C). *P<0.05, **P<0.01, and ***P<0.001. NCD: normal chow diet; HFD: high fat diet; MCDD: methionine-choline-deficient diet; PA: palmitic acid.
Autophagic flux was monitored by analysing LC3 turnover using chloroquine (CQ), which inhibits lysosomal function and late autophagic degradation [18]. The levels of autophagosome synthesis and degradation were measured and expressed as the relative value with respect to the basal level. The detailed methods were as follows: synthesis=100%+[LC3-II (PA+CQ)−LC3-II (CQ)]/[LC3-II (CQ)−LC3-II (Untreated at 0h)] and degradation=[LC3-II (PA+CQ)−LC3-II (PA)]/[LC3-II (CQ)−LC3-II (Untreated)]. As shown in Fig. 2A, autophagic flux was activated at the early stage (12h) and inhibited later (24h, 48h, and 72h) in PA-treated HepG2 cells. The levels of autophagic synthesis and degradation were both increased at the early stage and then gradually decreased. Moreover, mRFP-GFP-LC3 puncta provided further support for these conclusions (Fig. 2B and C).
 for the indicated time periods. (A) LC3 protein levels were measured by western blot in HepG2 cells exposed to PA or/and chloroquine (CQ) for the indicated time periods, then the synthesis and degradation of autophagosomes were calculated. *P<0.05, **P<0.01, and ***P<0.001. (B) Fluorescence microscopic images of mRFP-GFP-LC3 in PA-treated HepG2 cells. (C) Quantitative analysis of the number of autophagosomes (yellow) and autolysosomes (red). Significant versus 0h: *P<0.05, **P<0.01, and ***P<0.001. Significant versus 12h: #P<0.05 and ##P<0.01.")
Measurement of autophagic flux in HepG2 cells exposed to palmitic acid (PA) for the indicated time periods. (A) LC3 protein levels were measured by western blot in HepG2 cells exposed to PA or/and chloroquine (CQ) for the indicated time periods, then the synthesis and degradation of autophagosomes were calculated. *P<0.05, **P<0.01, and ***P<0.001. (B) Fluorescence microscopic images of mRFP-GFP-LC3 in PA-treated HepG2 cells. (C) Quantitative analysis of the number of autophagosomes (yellow) and autolysosomes (red). Significant versus 0h: *P<0.05, **P<0.01, and ***P<0.001. Significant versus 12h: #P<0.05 and ##P<0.01.
mTORC1 is considered to be the master regulator of autophagy due to its energy sensing function; its activation is commonly measured by the phosphorylation of P70S6K, a downstream target [19,20]. As shown in Fig. 3, the level of phosphorylated P70S6K (p-P70S6K) was reduced in the early stages (HFD: 2wk and 4wk, MCD: 1wk) and then gradually increased with the extension of HFD or MCDD treatment. These findings were further supported by the immunoblotting results in PA-treated HepG2 cells (Fig. 3C). Moreover, the changing pattern of P70S6K phosphorylation showed a significant negative correlation with that of autophagic synthesis (Fig. 3D).
. (A and B) Levels of phosphorylated and total P70S6K in liver lysates form mice fed with high fat diet (HFD) or methionine-choline-deficient diet (MCDD). Significant versus normal chow diet (NCD): *P<0.05, **P<0.01, and ***P<0.001. (C) Levels of phosphorylated and total P70S6K in HepG2 cells treated with palmitic acid (PA). Significant versus 0h: *P<0.05 and **P<0.01. (D) P70S6K activation is negatively correlated with autophagic synthesis in HepG2 cells.")
Oscillated activation of P70S6K in both in vivo and in vitro models of non-alcoholic fatty liver disease (NAFLD). (A and B) Levels of phosphorylated and total P70S6K in liver lysates form mice fed with high fat diet (HFD) or methionine-choline-deficient diet (MCDD). Significant versus normal chow diet (NCD): *P<0.05, **P<0.01, and ***P<0.001. (C) Levels of phosphorylated and total P70S6K in HepG2 cells treated with palmitic acid (PA). Significant versus 0h: *P<0.05 and **P<0.01. (D) P70S6K activation is negatively correlated with autophagic synthesis in HepG2 cells.
Given the close relationship between mTORC1 signalling and autophagy during NAFLD development, we evaluated the effect of rapamycin (Rap), a widely used mTORC1 inhibitor, on lipid accumulation in PA-treated HepG2 cells. Co-treatment of HepG2 cells with Rap and PA resulted in a reduction of P62 protein levels and an increase in the ratio of LC3-II/LC3-I (Fig. 4A). Furthermore, the levels of intracellular TG were significantly decreased in PA-treated HepG2 cells upon Rap treatment, as confirmed by lipid staining and TG quantification (Fig. 4B and C).
-treated HepG2 cells. (A) Representative images of western blots using the indicated antibodies. (B) Representative images of Bodipy 493/503 staining showing the effect of rapamycin (Rap) on lipid accumulation in PA-treated HepG2 cells. (C) Measurement of triacylglycerol (TG) in HepG2 cells treated with PA alone or in combination with rapamycin (Rap). *P<0.05, **P<0.01, and ***P<0.001.")
Rapamycin recovers autophagic flux and decreased intracellular TG accumulation in palmitic acid (PA)-treated HepG2 cells. (A) Representative images of western blots using the indicated antibodies. (B) Representative images of Bodipy 493/503 staining showing the effect of rapamycin (Rap) on lipid accumulation in PA-treated HepG2 cells. (C) Measurement of triacylglycerol (TG) in HepG2 cells treated with PA alone or in combination with rapamycin (Rap). *P<0.05, **P<0.01, and ***P<0.001.
Autophagy is a protective response to stress caused by internal and external stimuli that plays an important role in maintaining cellular homeostasis and normal function [21,22]. In recent years, autophagy has emerged as an important regulatory pathway in hepatic lipid metabolism and has been widely acknowledged for its involvement in the development of NAFLD [23,24]. However, the variability of hepatic autophagy in response to progressive steatosis remains quite controversial. For example, conflicting results have been reported in patients with NAFLD by Gonzalez-Rodriguez et al. [25] and Lou et al. [26]. In a study involving HFD-induced mouse model of NAFLD, hepatic autophagy was reported to be enhanced at 4, 8, 12 and 16 weeks of treatment [27], while other studies have demonstrated hepatic autophagy to be decreased at 4 and 8 weeks [28,29]. In addition, Tanaka et al. [30] reported that hepatic autophagy was blocked at 1, 2, and 4 months of treatment. Thus it can be seen that no consensus has been achieved. Furthermore, most previous studies were performed in only one kind of murine model within a relatively short time span and were limited to a few detection time-points. In the current study, by using two well established murine models of NAFLD, we found that the protein level of LC3-II was significantly elevated throughout HFD or MCDD feeding and was accompanied by an early-phase decrease and a late-phase increase of P62 protein levels; in vitro experiments using HepG2 cells further supported these results. Moreover, the levels of autophagic synthesis and degradation were found to be increased during the early stages of NAFLD and then gradually decreased. Altogether, these results indicate that autophagic flux is activated initially as a response to steatosis to protect against lipotoxicity but is later blocked and inhibited as a result of homeostatic imbalance caused by continuous metabolic stress.
Mammalian target of rapamycin (mTOR) is a serine/threonine protein kinase that interacts with regulatory proteins to form mTORC1 and plays a central role at the interface of the various pathways regulating the balance between cell growth and autophagy in response to nutritional status, growth factors, and stress signals [31,32]. Previous studies have demonstrated aberrant activation of mTORC1 in patients with NAFLD, and pharmacological inhibition of mTORC1 using rapamycin was able to alleviate hepatic steatosis in zebrafish [33,34]. However, it is not clear how mTORC1 signalling responds to progressive lipid accumulation in hepatocytes. Xiao et al. [35] indicated that mTORC1 activity was decreased in Sprague-Dawley rats after 8 weeks of HFD feeding. However, other studies have reported mTORC1 activity to be increased at 8 and 10 weeks [29,36], decreased at 20 weeks [37], and increased at 30 weeks [25] in HFD-fed C57BL/6 mice. Thus, it appears that the activity of mTORC1 changes dynamically during the course of HFD feeding. Indeed, Zhang et al. [19] reported that the activity of mTORC1 oscillated during HFD feeding in C57BL/6 mice and was increased at 3 weeks, decreased at 10 weeks, increased again at 16 weeks, and normalized at 32 weeks. Despite a large body of evidence indicating the involvement of mTORC1 in the development of NAFLD, the dynamic changes of mTORC1 activity have been reported to be contradictory and there is not yet a consensus. In this study, we found that the activity of mTORC1, as represented by the phosphorylation of P70S6K, was decreased at the early stage and gradually increased thereafter in both in vitro and in vivo models of NAFLD. Moreover, the changing pattern of mTORC1 activation showed a significant negative correlation with that of autophagic synthesis. In addition, pharmacological inhibition of mTORC1 exhibited a therapeutic effect on hepatic steatosis by recovering autophagic flux.
In conclusion, our study presented a systematic examination of the dynamics of hepatic autophagy and mTORC1 signalling in response to progressive steatosis, and revealed a critical role for mTORC1 signalling in regulating autophagy in both in vitro and in vivo models of NAFLD. These results may contribute to a better understanding of the role of autophagy in NAFLD. Therapies aimed at restoring autophagic flux by targeting the mTORC1 signalling pathway represent a promising direction to prevent or attenuate NAFLD progression.AbbreviationsCQ chloroquine haematoxylin and eosin high fat diet microtubule-associated protein B-light chain 3 methionine-choline-deficient diet mammalian target of rapamycin complex 1 non-alcoholic fatty liver disease normal chow diet palmitic acid phosphate buffer saline phosphorylated P70S6K quantitative real-time polymerase chain reaction rapamycin triacylglycerol
This work was supported by National Key Science and Technology Project of China [grant number 2018YFC2000500-03], National Natural Science Foundation of China [grant numbers 81861168038 and 81420108005], Local Innovative and Research Teams Project of Guangdong Pearl River Talents Program [grant number 2017BT01S131] and Postdoctoral Science Foundation of China [grant number 2018M641919].
Conflict of interestThe authors declare that there is no conflict of interests in this study.
We thank the members of Jiucun Wang laboratory for their technical support and invaluable suggestions.