


Introduction and alm. Hepatitis C virus core-binding protein 6 (HCBP6) was previously found to be an hepatitis C virus corebinding protein, its biological function remains unclear. Our research aims to investigate the role of HCBP6 in the development of hepatic steatosis induced by high-fat diet and carbon tetrachloride (CCL4) in rats.
Material and methods. Eighteen Wistar rats were randomly allocated into 3 groups: control group, model group 1, and model group 2. The control group was treated with a standard diet for 5 weeks. Model groups were treated with high-fat diet and CCL4 injection twice a week for 3 weeks in Group 1 and 5 weeks in Group 2, respectively. After the intervention, hepatic steatosis was observed by histological staining with hematoxylin and eosin (H&E) and Oil Red O staining. Serum levels of alanine aminotransferase (ALT), aspartate aminotransferase (AST), total cholesterol (TC), and triglycerides (TGs) were measured. The TG content in liver homogenates was evaluated. Expressions of HCBP6 and SREBP-1c were determined by immunofluorescence, quantitative real-time PCR, and Western blot analysis.
Results. Hepatic steatosis was successfully induced in model groups. ALT, AST, TC, and TGs elevated in model groups compared with those in control group (P < 0.05). Hepatic steatosis induced by high-fat diet and CCL4 resulted in low expression of HCBP6 and high expression of SREBP-1c in the liver of rats (P < 0.05).
Conclusion. HCBP6 is involved in the development of high-fat diet- and CCL4-induced hepatic steatosis and related negatively with SREBP-1c.
Hepatic steatosis is characterized by lipid dysregulation and fat accumulation in the liver. It is a major complication of obesity, hyperlipidemia, insulin resistance (IR), and non-alcoholic fatty liver disease (NAFLD).1 If untreated, benign steatosis can gradually advance to steatohepatitis, fibrosis, cirrhosis, and even liver cancer.2,3 Many risk factors can promote hepatic steatosis through different mechanisms, such as metabolic diseases, alcohol, virus, drugs, and nutritional disorders, with IR being the most common feature leading to hepatic lipid accumulation.4 Multiple lines of evidence have demonstrated that various genes, including sterol regulatory element binding protein 1c (SREBP-lc), FoxOl, AKT2, and PPARγ, are involved in IR-induced hepatic steatosis.5
Hepatitis C virus core-binding protein 6 (HCBP6) was originally identified as a hepatitis C virus (HCV) corebinding protein.6 HCV core protein has been shown to play an important role in hepatic steatosis.7 Researches have proved that HCBP6 mRNA and protein levels exhibited time- and dose-dependent increases in a cellular model of lipid-overload hepatic steatosis in vitro and HCBP6 was found as a negative regulator and sensor of intracellular TG levels.8 Still, the biological function of HCBP6 in hepatic steatosis is not fully understood. Whether HCBP6 is involved in the development of hepatic steatosis in vivo is yet to be investigated.
SREBP-1c belongs to the basic helix-loop-helix-leucine zipper family of transcription factors and plays a key role in regulating fatty acid synthesis and TG accumulation in the liver.9 HCV core protein induces TG accumulation by stimulating SREBP-lc gene expression and HCBP6 binds the HCV core protein.10 Whether HCBP6 is involved in SREBP1c-FASN-mediated TG accumulation has yet to be determined. Here, we demonstrate that HCBP6 is involved in the development of hepatic steatosis induced by high-fat diet and carbon tetrachloride (CCL4) in rats and HCBP6 is negatively related to SREBP-1c. The results offer new insights into the pathophysiology of hepatic steatosis.
Material and MethodsAnimals and treatment schedulesWistar rats, weighing 190-210 g, were provided by laboratory center, Shantou University Medical College. A standard laboratory diet and water were available ad libitum. The animal room was maintained humidity with a 12h (7:00 a.m. -7:00 p.m.) light/dark cycle. After 1 week on the basal diet, 18 animals were randomly allocated into 3 groups: Group 1, Group 2, and control group. Each group contained 6 rats. Rats in model groups received a high-fat diet and subcutaneous injection of 30% CCL4 in liquid paraffin oil (0.2 mL/100 g body weight) twice a week for 3 weeks (Group 1) and 5 weeks (Group 2) respectively. Rats in the control group received subcutaneous injection of normal saline and normal food feed instead. After 3 weeks (Group 1) or 5 weeks (Group 2 and control group), rats were fasted overnight and sacrificed. The serum was separated for further investigation. Rat livers were weighed and frozen or fixed in 10% formalin. All experiment protocols were approved by ethics committee of Shantou Central Hospital. All animals received humane care according to the criteria outlined in the “Guide for the Care and Use of Laboratory Animals” prepared by the National Academy of Sciences and published by the National Institutes of Health (NIH publication 86-23 revised 1985).
Evaluation of liver pathologyA histological study was performed following a midline laparotomy to remove the left lateral lobe of rat liver. Livers were harvested at the end of the experiment. Weighed, immediately placed in 10% buffered formalin, and embedded in paraffin. Liver sections were stained with hematoxylin and eosin (H&E) using standard technique. To further confirm lipid droplet accumulation, frozen liver sections were stained with Oil Red O. Investigators were blinded to the group identity of each section, and biopsies were classified into four categories depending on fat accumulation using a previously established method as follows: Grade 0, no fat observed in the liver; Grade 1, < 33% of hepatocytes contained fat vacuoles; Grade 2, 33-66% of hepatocytes contained fat vacuoles; Grade 3, > 66% of hepatocytes contained fat vacuoles.11
Biochemical determinationsAfter being treated for 3 weeks (Group 1) or 5 weeks (Group 2 and control group), rats were fasted overnight and serum levels of alanine aminotransferase (ALT), aspartate aminotransferase (AST), total cholesterol (TC), and triglycerides (TGs) were measured with an automatic biochemical analyzer.
Evaluations of TC and TGs in liver tissuesExactly 3 ml of ethanol - acetone (1:1) was added to the liver tissues (200 mg), which were then homogenized in an ice bath and mixed thoroughly at 4°C overnight. After 24 h, the liver tissues were centrifuged at 3000 rpm and 4 °C for 20 min. Subsequently, the supernatant was transferred to a new tube, then TC and TGs were measured based on the instructions on TC and TG assay kit (Jiancheng Institute of Bio Engineering, Nanjing, China) using a colorimetric method.
Immunofluorescence and confocal imagingSpecimens of liver tissues were cut into 4-μιτι sections using a cryotome (Leica CM 3000; Leica, München, Germany) and fixed in acetone for 10 min. To quench the endogenous peroxidase activity, sections were treated with 0.3% H2O2 for 10 min. Then they were treated with normal non-immune goat serum for 15 min at room temperature to block nonspecific sites. The sections were incubated with goat anti-rat HCBP6 polyclonal antibody (1:100, Santa Cruz Biotechnology, USA) and rabbit antirat SREBP-1c polyclonal antibody (1:250, Santa Cruz Biotechnology, USA) at 4°C overnight, washed with tris-buffered saline (TBS 0.1 M, pH 7.4) and incubated with Alexa-Fluor-594-labelled donkey anti-goat IgG and FITC-labelled goat anti-rabbit IgG (ZSGB-BIO, Beijing, China) at 37°C for 1.5 h. After washed with TBS, The nuclei were stained by DAPI (Abcam, Cambridge, UK) for 10 min at room temperature. Confocal images were collected by the slit scanning laser confocal microscope (LSM710, Carl Zeiss, Germany) and image software (Zen 2011, Carl Zeiss MicroImaging GHBH, Germany). To compare the intensity of immunofluorescence, the average percentage of positive immunostaining cells to 10 random confocal images was measureed for the labeled index protein HCBP6 and SREBP-1c.
RNA analysisTotal RNA was extracted using TRIzol® Reagent (Invitrogen, Carlsbad, CA, USA) according to the manufacturer’s protocol. 1.0 μg of total RNA was used as a template for first strand cDNA synthesis using PrimerScript® RT Master Mix kit (TaKaRa, Tokyo, Japan). Real-time PCR was performed using SYBR® Premix Ex TaqTM kit (TaKaRa, Tokyo, Japan) on LightCycler 480 Realtime PCR System (Roche, USA). The sequences of primers used in this study were as follows (forward and reverse): HCBP6, 5'-CTT TTC GGG CAT GAG AGT CG-3' and 5'-GAA TCG TCA GCT GCT CCT TG -3'; SREBPlc, 5'-CAC TTC CAG CTA GAC CCC AA-3' and 5'-GGT GAG AGC CTT GAG ACA GT-3'; GAPDH, 5'-GTT ACC AGG GCT GCC TTC TC-3' and 5'- GAT GGT GAT GGG TTT CCC GT-3'.
Western blotting analysisThe samples for Western blots analysis were liver lysates, which were incubated in RIPA lysis buffer: 50 mM Tris, 150 mM NaCl, 1% Triton X-100, 1% sodium deoxycholate, 0.1% SDS, 2 mM EDTA, and protease inhibitors (pH 7.4). Protein content of the samples was measured by BCA Protein Assay Kit (Thermo, Rockford, IL, USA). Proteins (40 μg per sample) were separated by SDS-PAGE with 12% polyacrylamide gels and transferred onto PVDF membranes. The blots were blocked with a solution of 5% (wt / vol) skim milk in TBS containing 0.1% Tween-20 for 1 h at room temperature and incubated overnight at 4°C with primary goat anti-rat HCBP6 antibody (1:800, Santa Cruz, Santa Cruz, CA, USA), rabbit anti-rat SREBP-1c antibody (1:1000, Santa cruz, Santa Cruz, CA, USA), and rabbit anti-rat β-actin antibody (1:2000, Cell Signaling Technology, Danvers, MA, USA). After rinsed in TBS (pH 7.8) containing 0.1% Tween-20, the blots were incubated with horseradish peroxidase-conjugated antibody (1:2000, Cell Signaling Technology, Danvers, MA, USA) for 1 h. HCBP6, SREBP-1c, and β-actin proteins were detected by enhanced chemiluminescence system. The integrated intensity for the protein bands was determined by scanning densitometry and analyzed by Glyko BandScan 5.0. The data were analyzed using relative intensity to the constitutive marker, β-actin.
Statistical analysisDifferences among groups were examined by one-way ANOVA followed by Tukey-Kramer multiple comparison tests. Values are expressed as the mean ± standard deviation. A value of P < 0.05 was considered statistically significant.
ResultsCharacteristics of animalsA total of 18 rats were investigated in the study. The initial body weights of the male and female rats were similar (200 ± 10 g). At the end of the intervention, there was a significant difference in the percentage of liver-to-body weight between control group and model groups, Group 1 (4.56% ± 0.56%), Group 2 (4.63% ± 0.30%) vs. control group (3.12% ± 0.23%), P < 0.05 (Figure 1A).
. A. Percentage of liver-to-body weight was shown in this panel. The percentage of liver-to-body weight from control group was significantly lower than that from Group 1 and Group 2 (*P < 0.05 compared with Group 1;† P < 0.05 compared with Group 2; n = 6). B. Pathological observation of hepatic steatosis induced by high-fat diet and CCL4. Liver sections from control group, Group 1, and Group 2 were stained with H&E and Oil Red O. Original magnification: 200.")
Weight and pathological change of livers from rats induced by high-fat diet and carbon tetrachloride (CCL4). A. Percentage of liver-to-body weight was shown in this panel. The percentage of liver-to-body weight from control group was significantly lower than that from Group 1 and Group 2 (*P < 0.05 compared with Group 1;† P < 0.05 compared with Group 2; n = 6). B. Pathological observation of hepatic steatosis induced by high-fat diet and CCL4. Liver sections from control group, Group 1, and Group 2 were stained with H&E and Oil Red O. Original magnification: 200.
As H&E staining showed, histological analysis of the hepatic fragments in the control group exhibited well-preserved architecture with characteristic hepatocytes distributed homogenously throughout the hepatic parenchyma. Group 1 and Group 2 exhibited significant alterations, including tissue disorganization with macroand micro-vesicular steatosis in the cytoplasm of the hepatocytes, as well as the presence of multiple foci of inflammable infiltrates, being prominent in rats of Group 2 (Figure 1B). Quantifying the fatty infiltration by a previously published scoring system, the mean fatty infiltration in the treated Group 1 and Group 2 were both Grade 2 while the control group was quantified as Grade 0. Oil-Red-O stain displayed abundant accumulation of fat droplets in hepatocytes from rats of Group 1 and Group 2 (Figure 1B). These liver histology results suggested that hepatic steatosis was successfully induced in model groups.
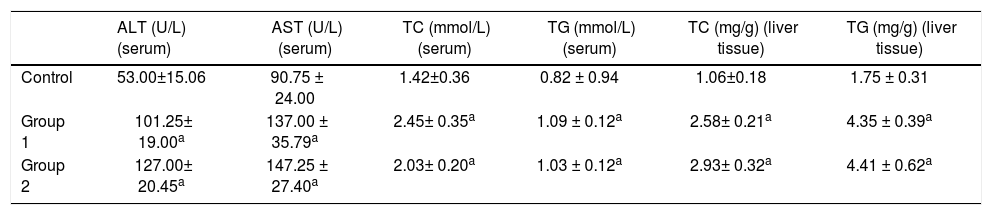
Biochemical determinations and liver TG contentThe serum levels of ALT, AST, TC, and TGs in the control group were 53.00 ± 15.06 U/L, 90.75 ± 24.00 U/L, 1.42 ± 0.36 mmol/L, and 0.82 ± 0.94 mmol/L. While the serum levels of ALT, AST, TC, and TGs were 101.25 ± 19.00 U/L, 137.00 ± 35.79 U/L, 2.45 ± 0.35 mmol/L, and 1.09 ± 0.12 mmol/L in Group 1 and 127.00 ± 20.45 U/L, 147.25 ± 27.40 U/L, 2.03 ± 0.20 mmol/L, and 1.03 ± 0.12 mmol/L in Group 2. The Group 1 and Group 2 rats showed significant serum elevations of ALT, AST, TC, and TGs compared to the control group. In liver tissues, the levels of TC and TGs were 1.06 ± 0.18 mg/g and 1.75 ± 0.31 mg/g in the control group, 2.58 ± 0.21 mg/g and 4.35 ± 0.39 in Group 1, and 2.93 ± 0.32 mg/g and 4.41 ± 0.62 mg/g in Group 2 respectively. Similarly, liver TC and TGs elevated remarkably in model groups compared with the control group (n = 6, P < 0.05); (Table 1).
ALT, AST, TC, and TG levels in serum and TC and TG levels in liver tissues.
| ALT (U/L) (serum) | AST (U/L) (serum) | TC (mmol/L) (serum) | TG (mmol/L) (serum) | TC (mg/g) (liver tissue) | TG (mg/g) (liver tissue) | |
|---|---|---|---|---|---|---|
| Control | 53.00±15.06 | 90.75 ± 24.00 | 1.42±0.36 | 0.82 ± 0.94 | 1.06±0.18 | 1.75 ± 0.31 |
| Group 1 | 101.25± 19.00a | 137.00 ± 35.79a | 2.45± 0.35a | 1.09 ± 0.12a | 2.58± 0.21a | 4.35 ± 0.39a |
| Group 2 | 127.00± 20.45a | 147.25 ± 27.40a | 2.03± 0.20a | 1.03 ± 0.12a | 2.93± 0.32a | 4.41 ± 0.62a |
ALT: alanine aminotransferase. AST: aspartate aminotransferase. TC: total cholesterol. TG: triglycerides;
Immunofluorescence staining was performed to detect the HCBP6 and SREBP-1c expression in the liver tissues of rats separated from Group 1, Group 2, and control group (Figure 2A). The percentages of HCBP6 positive cells for Group 1, Group 2, and control group were 5.22% ± 1.74%, 6.93% ± 1.04%, and 43.85% ± 5.89%, respectively. While the percentages of SREBP-1c positive cells for Group 1, Group 2, and control group were 72.15% ± 8.24%, 83.61% ± 8.52%, and 8.84% ± 0.91%, respectively. It was significantly lower for HCBP6 expression and higher for SREBP-1c expression in hepatocytes of Group 1 and Group 2 rats, compared with control rats (n = 6, P < 0.05) (Figure 2B). But there was no significant difference between Group 1 and Group 2 rats.
. Magnified images are shown in the bottom right of each section. B. Comparisons of percentages of HCBP6 + and SREBP-1c + hepatocytes (*P < 0.05 compared for HCBP6 with control;† P < 0.05 compared for SREBP-1c with control; n = 6). C. Comparisons of HCBP6 and SREBP-1c mRNA expressions in hepatocytes (*P < 0.05 compared for HCBP6 with control;† P < 0.05 compared for SREBP-1c with control; n = 6). D. Protein expressions of HCBP6 and SRBP-1c in hepatocytes detected by Western blot analysis. E. Comparisons of integrated intensity for HCBP6 and SREBP-1c (*P < 0.05 compared for HCBP6 with control;† P < 0.05 compared for SREBP-1c with control; n = 6).")
Expressions of HCBP6 and SREBP-1c in hepatocytes of Group 1, Group 2, and control rats. A. Immunofluorescence staining of HCBP6 and SREBP-1c in hepatocytes (Origina magnification: 100). Magnified images are shown in the bottom right of each section. B. Comparisons of percentages of HCBP6 + and SREBP-1c + hepatocytes (*P < 0.05 compared for HCBP6 with control;† P < 0.05 compared for SREBP-1c with control; n = 6). C. Comparisons of HCBP6 and SREBP-1c mRNA expressions in hepatocytes (*P < 0.05 compared for HCBP6 with control;† P < 0.05 compared for SREBP-1c with control; n = 6). D. Protein expressions of HCBP6 and SRBP-1c in hepatocytes detected by Western blot analysis. E. Comparisons of integrated intensity for HCBP6 and SREBP-1c (*P < 0.05 compared for HCBP6 with control;† P < 0.05 compared for SREBP-1c with control; n = 6).
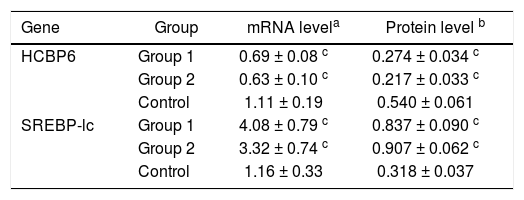
The mRNA expressions of HCBP6 and SREBP-1c in hepatocytes of Group 1, Group 2, and control rats were shown in table 2 and figure 2C. Compared with control rats, the mRNA expression of HCBP6 was significantly lower in hepatocytes of Group 1 and Group 2 rats (n = 6, P < 0.05). Conversely, a significantly higher expression of SREBP-1c was detected in hepatocytes of Group 1 and Group 2 rats than that in hepatocytes of control rats (n = 6, P < 0.05).
HCBP6 and SREBP-1c expressions in hepatocytes of Group 1, Group 2, and control rats.
Protein expressions of the HCBP6 and SREBP-1c were analyzed through western blotting on the liver samples. Compared with control rats, the protein expression of HCBP6 was decreased in hepatocytes of Group 1 and Group 2 rats. While SREBP-1c protein expression of hepatocytes in both Group 1 and Group 2 rats was significantly higher than that in control rats (n = 6, P < 0.05) (Figures 2D and 2E, and Table 2).
DiscussionNAFLD is an increasing prevalent health problem that ranges from simple fatty infiltration of the liver parenchyma (non-alcoholic simple fatty liver, NAFL) to steatosis with inflammation and hepatocellular ballooning (non-alcoholic steatohepatitis, NASH) and ultimately cirrhosi.12 It is estimated that 1 billion people currently suffer from some form of NAFLD.13 Liver steatosis, marked as the first stage of NAFLD, is closely associated with obesity, type 2 diabetes mellitus, IR, and drug-induced liver injury.14 Steatosis is considered as a benign reversible event, while NASH has a potential to lead to cirrhosis and hepatocellular carcinoma. As much as 10-25% of liver steatosis patients progress to NASH and 2-3% of NASH patients develop into liver cancer.15,16 Hence, liver steatosis is of major concern for worldwide health.
Pathologically, hepatic steatosis is featured by the accumulation of fat in at least 5% of hepatocytes. Hepatic steatosis occurs when the production and removal of intrahepatic TGs become unbalanced due to reduced fatty acid oxidation as well as increased de novo lipogenesis. Maintaining TG homeostasis is essential for normal liver function.17,18 Many risk factors can promote hepatic steatosis through different mechanisms, such as metabolic diseases, alcohol, virus, drugs, and nutritional disorders, with IR being the most common feature leading to hepatic lipid accumulation.4 Various genes, including SREBP-1c, LXR, AKT2, and FASN, have been demonstrated to be involved in IR-induced hepatic steatosis.19–22
It has classically been found that HCV, especially genotype 3, exerts direct metabolic effects which leads to liver steatosis.23 HCV core protein plays an important role in the development of hepatic steatosis in HCV infection.10 Researches have demonstrated that HCV core is localized on the endoplasmic reticulum and on lipid droplets which suggests a relationship between the expression of the HCV core protein and cellular lipid metabolism.7 HCBP6 has been identified as a HCV core-binding protein and shown to inhibit HCV core protein transactivation ef- fects.6,24 It has also been found to regulate the transcriptional activity of the alpha chain of nascent polypeptide-associated complex promoter and the expression of genes involved in cell proliferation, signal transduction, growth, and differentiation.25,26 Studies have revealed that HCBP6 is a negative regulator and sensor of intracellular TG levels in vitro and HCPB6 expression is induced by TGs in a time- and dose-dependent manner.8
SREBP-1c belongs to the basic helix-loop-helix-leucine zipper family of transcription factors and plays a key role in regulating fatty acid synthesis and TG accumulation in the liver.9 Three mammalian SREBP isoforms (SREBP-1a, SREBP-1c, and SREBP-2) are encoded by two genes, SREBF1 and SREBF2, and have distinct but overlapping functions in lipogenic gene regulation. Previous studies have reported that SREBP-1a activates fatty acid and cholesterol synthesis. SREBP-1c activates fatty acid and TG synthesis, and SREBP-2 activates cholesterol synthesis and uptake.27 SREBP-1c increases the transcriptional activity of genes involved in hepatic fatty acid synthesis (including FASN, ACC, and SCD), enhances transcription of genes required for fatty acid synthesis, and predominates in the liver.28,29 Alterations to the SREBP-1c-FASN pathway can result in liver steatosis and type 2 diabetes.30
Various animal models of NAFLD have been developed involving genetic and diet manipulation, treatment with toxins as well as combination models.31 In our study, we established the model of liver steatosis by a high-fat diet and CCL4 subcutaneous injection. This method accords with the pattern of NAFLD development in some degree and has been extensively studied.32–35 The pathology and liver function study revealed that hepatic steatosis was successfully induced in model groups. To further explore whether HCBP6 was involved with a time-dependent manner, we designed model groups treated for 3 weeks and 5 weeks. Two groups both exhibited fatty infiltration of quantifying Grade 2 while Group 2 represented more serious steatohepatitis.11 However, we did not include the investigation on the change of HCBP6 within clear stages of NAFLD to NASH, even to fibrosis, which was worth our further investigation.
Previous studies have demonstrated that HCV core protein induced TG accumulation by stimulating SREBP-1c gene expression and HCBP6 negatively regulated intracellular TG levels in hepatoma cell lines via the SREBP-1c/ FASN Pathway in vitro.8,10 The results implied that HCBP6 may impact TG metabolism through the regulation of SREBP-1c in vivo. In the current study, we investigated the in vivo change and revealed HCBP6 expression was downregulated in hepatic steatosis in rats, consistent with in vitro observations by Gao, et al.8 Our experimental results showed the expression of HCBP6 was significantly decreased in livers of rats induced by high-fat diet and CCL4. It continued to maintain at a lower level as treating time prolonged. All above showed HCBP6 was associated with the development of hepatic steatosis in rats. Besides, as a crucial transcription factor in hepatic fatty acid synthesis, SREBP-1c expression was up-regulated in the model groups, negatively correlated with HCBP6. So we speculated that the lower expression of HCBP6 may cause the higher expression of SREBP-1c and activate the SREBP-1c signal pathway, resulting in the increase of fatty acid and TG synthesis and the dysfunction of lipid metabolism in the development of hepatic steatosis. This study offered new insights into the pathophysiology of hepatic steatosis. On the other hand, it also suggested that HCBP6 may be used as a sensitive indicator for NAFLD occurrence and development. It may be an efficient way to prevent and treat NAFLD by promoting the expression of HCBP6.
In conclusion, we demonstrate that HCBP6 is involved in the development of hepatic steatosis induced by highfat diet and CCL4 in rats and HCBP6 is negatively related to SREBP-1c. The results offer new insights into the pathophysiology of hepatic steatosis. Thus, our results suggest that HCBP6 may represent a new potential therapeutic target in lipid metabolism and fatty liver management.
Abbreviations- •
ALT: alanine aminotransferase.
- •
AST: aspartate aminotransferase.
- •
CCL4: carbon tetrachloride.
- •
H&E: hematoxylin and eosin.
- •
HCBP6: hepatitis C virus core-binding protein 6.
- •
HCV: hepatitis C virus.
- •
IR: insulin resistance.
- •
NAFL: non-alcoholic simple fatty liver.
- •
NAFLD: non-alcoholic fatty liver disease.
- •
NASH: non-alcoholic steatohepatitis.
- •
SREBP-lc: sterol regulatory element binding protein 1c.
- •
TBS: tris-buffered saline.
- •
TC: total cholesterol.
- •
TG: triglyceride.
There is no conflict of interest to be declared. This study was supported by Science Foundation of Guangdong province for traditional Chinese medicine research (No. 20131053).


