


Background and aims. Previously, we reported that granulocyte-colony stimulating factor (G-CSF) improves hepatic steatosis in experimental animals. It may also have preventive effects on the development of hepatic steatosis. Therefore, we investigated the preventive effects of G-CSF by using a high-fat diet (HFD) rat model. Materials and methods. Twelve rats were fed HFD and 6 rats were fed control diet from 10 weeks of age. Once little steatosis was confirmed in the liver (after 10 weeks of feeding the HFD; at 20 weeks of age), HFD rats were randomly divided into two groups and treated with either G-CSF (100 Mg kg-1 day-1 for 5 consecutive days every other week; HFD/G-CSF rats) or saline (HFD/saline rats) for 10 weeks at 20 weeks of age. All rats were sacrificed at 30 weeks of age. Histology was examined by hematoxylin and eosin (H-E) and Oil Red O staining, and the expression levels of genes of associated with lipogenesis and β-oxidation enzymes were determined by qRT-PCR.
Results. Histological examinations revealed that HFD/G-CSF rats had significantly lower lipid accumulation in their hepatocytes than did HFD/saline rats (p < 0.05). HFD/G-CSF rats also showed lower expression levels of genes associated with lipogenesis and higher expression levels of genes associated with β-oxidation than HFD/saline rats (p < 0.05). Conclusion. In conclusion, we found that G-CSF prevented development of hepatic steatosis in an HFD rat model. The preventive effect may be associated with the regulation of gene expression involved in hepatic lipogenesis and β-oxidation.
Non-alcoholic fatty liver disease is the most common cause of chronic liver disease and is frequently associated with metabolic syndrome components such as obesity, diabetes mellitus, and insulin resistance.1,2 Hepatic steatosis, an early stage of nonalcoholic fatty liver disease, involves accumulation of fat in the liver in the absence of significant alcohol consumption.3 Hepatic steatosis develops as a result of triglyceride synthesis owing to an increase in free fatty acid (FFA) uptake and de novo lipogenesis, and an imbalance between oxidation and antioxidation in the liver.4
Granulocyte-colony stimulating factor (G-CSF) is widely used to mobilize the release of bone marrow-derived stem cells into peripheral circulation.5 In many recent animal studies, G-CSF has been shown to be an effective treatment for a variety of liver diseases including hepatic steatosis,6 steatohepatitis,7 and fibrosis.8 Recently, we reported that G-CSF ameliorates hepatic steatosis in the Otsuka Long-Evans Tokushima fatty rat model, and reduces the expression of hepatic lipogenic genes such as sterol regulatory element-binding protein (SREBP)-1c, and that of encoding enzymes such as fatty acid synthase (FAS) and acetyl-CoA carboxylase (ACC).6 We hypothesized that G-CSF might also prevent the development of hepatic steatosis in experimental animals.
In this study, we investigated the preventive effect of G-CSF in a high-fat diet (HFD)-induced hepatic steatosis rat model and explored potential mechanisms underlying the beneficial effects. Specifically, we examined the expression of various hepatic lipogenic and β-oxidative genes and the presence of G-CSF receptor (G-CSFR) in liver tissues.
Material and MethodsAnimalsMale Sprague-Dawley rats (Koatech, Kyungki-do, South Korea), 6 weeks of age and weighing 150-200 g, were used in this experiment. All the rats were housed under conditions of controlled temperature (23 ± 2 °C) and humidity (55 ± 5%) with a 12-h artificial light/dark cycle in the specific pathogen-free facility of the Hanyang University Medical School Animal Experiment Center. These experiments were performed in compliance with the ARRIVE guidelines for research,9 and were approved by the Hanyang University Institutional Animal Care and Use Committee.
Animal model and experimental designThe experimental protocol is outlined schematically in figure 1. Starting at 10 weeks of age, all animals had free access to either standard rodent chow (SD, n = 6) with 5.4% fat content (Lab Rodent Chow; 38057; Purina Korea Inc., Kyungki-do, South Korea) or HFD (n = 12) with 60% fat content (Research Diets; D12492; New Brunswick, NJ, USA) for 20 weeks. The HFD rats were divided randomly into two groups and injected with human recombinant G-CSF (HFD/G-CSF; 100 μg/kg/day; Leucostim, Dong-A Pharmaceutical, Seoul, South Korea; n = 6) or saline (HFD/saline; n = 6) intraperitoneally on 5 consecutive days every other week between 20 and 30 weeks of age. Body weight and blood were measured at 2-week intervals between 10 and 30 weeks of age. The animals were sacrificed under anesthesia at 30 weeks of age, and liver tissues were collected.
 or a high-fat diet (HFD; n = 12) for 20 weeks. HFD rats were given either saline (HFD/saline; n = 6) or G-CSF (HFD/G-CSF; n = 6) intraperitoneally on 5 consecutive days every other week between 20 and 30 weeks of age.")
Experimental design. Starting at 10 weeks of age, all animals had free access to either standard rodent chow (SD; n = 6) or a high-fat diet (HFD; n = 12) for 20 weeks. HFD rats were given either saline (HFD/saline; n = 6) or G-CSF (HFD/G-CSF; n = 6) intraperitoneally on 5 consecutive days every other week between 20 and 30 weeks of age.
Blood samples were collected from the tail vein after 8 h of fasting. Serum was obtained by centrifugation and stored at -70 oC. Serum glucose, total cholesterol, triglyceride, alanine aminotransferase (ALT), aspartate aminotransferase (AST) and FFA were measured with an Olympus AU400 auto analyzer (Olympus GmbH, Hamburg, Germany).10 Insulin resistance was estimated by homeostasis model assessment of insulin resistance (HOMA-IR) by using the following formula:11
Histological examination
To examine morphology, livers were fixed with a 10% formalin solution, embedded in paraffin and cut into 4 μm thick sections for hematoxylin and eosin (H-E) staining. Accumulation of hepatic steatosis was determined by Oil Red O staining.12 For Oil Red O staining, livers were snap-frozen, embedded in optimum cutting temperature, and sectioned on a cryostat microtome (4 thick). Slides were rinsed briefly in 60% isopropanol, incubated for 15 min in filtered Oil Red O solution, rinsed again in 60% isopropanol, and counterstained with Mayer’s hematoxylin for 1 min.13 Five fields in each slide were selected at random from the individual sections. The Oil Red O-positive area was calculated using ImagePro Plus software (Media Cybernetics, Silver Spring, MD, USA). Hepatic steatosis was calculated as a percentage of the ratio of the area of Oil Red Ostained lipid droplets to the total tissue area.
Quantitative real-time polymerase chain reaction (Q-PCR)Total RNA was extracted from liver tissue by using Qiazol reagent (Qiagen, Valencia, CA, USA) following the manufacturer’s instructions. RNA concentrations were measured with a Nanodrop ND-2000 spectrophotometer (Thermo Fisher Scientific Inc., Wilmington, DE, USA), and RNA purity was determined by measuring the ratios of A260 to A280, which ranged from 1.8 to 2.0.
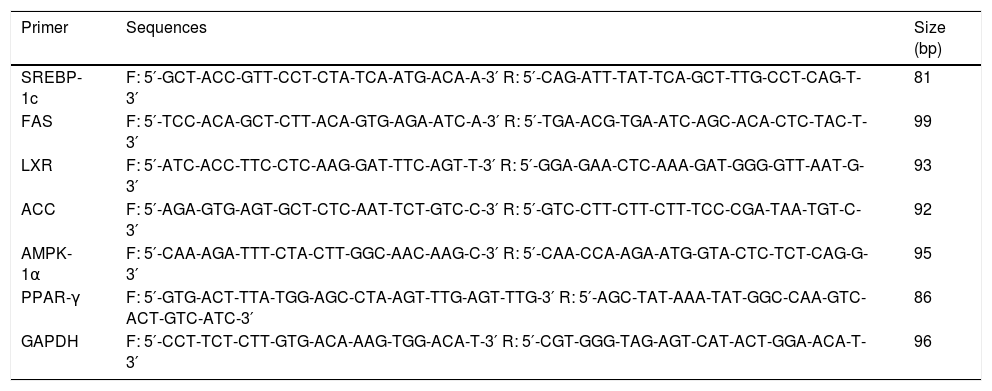
For real-time PCR, complementary DNA (cDNA) synthesized from 3 of RNA was reverse-transcribed with Moloney murine leukemia virus reverse transcriptase (Invitrogen Co., Carlsbad, CA, USA). mRNA expression was quantified using a Light Cycler® 480 System (Roche, Basel, Switzerland) with a FastStart DNA Master SYBR Green I kit (Roche Diagnostics, Indianapolis, IN, USA). The genes were selected SREBP-lc, FAS, liver X receptor (LXR), ACC, AMP-activated protein kinase (AMPK)-1α, and peroxisome proliferator-activated receptor (PPAR)-γ. The primers used in the analyses are shown in table 1. The following experimental run protocol was used: incubation for 10 min at 95 °C followed by 45 cycles of 10 s at 95 °C, 10 s at 60 °C, and 8 s at 72 °C and a final dissociation step at 65 °C for 15 s. The crossing point (Cp) of each PCR was automatically determined by the Light Cycler® program. All samples were run in duplicate. A relative change ratio was determined using the ratio of the mRNA for the selected gene to that of glyceralde-hyde-3-phosphate dehydrogenase (GAPDH).
Sequences of primers.
| Primer | Sequences | Size (bp) |
|---|---|---|
| SREBP-1c | F: 5′-GCT-ACC-GTT-CCT-CTA-TCA-ATG-ACA-A-3′ R: 5′-CAG-ATT-TAT-TCA-GCT-TTG-CCT-CAG-T-3′ | 81 |
| FAS | F: 5′-TCC-ACA-GCT-CTT-ACA-GTG-AGA-ATC-A-3′ R: 5′-TGA-ACG-TGA-ATC-AGC-ACA-CTC-TAC-T-3′ | 99 |
| LXR | F: 5′-ATC-ACC-TTC-CTC-AAG-GAT-TTC-AGT-T-3′ R: 5′-GGA-GAA-CTC-AAA-GAT-GGG-GTT-AAT-G-3′ | 93 |
| ACC | F: 5′-AGA-GTG-AGT-GCT-CTC-AAT-TCT-GTC-C-3′ R: 5′-GTC-CTT-CTT-CTT-TCC-CGA-TAA-TGT-C-3′ | 92 |
| AMPK-1α | F: 5′-CAA-AGA-TTT-CTA-CTT-GGC-AAC-AAG-C-3′ R: 5′-CAA-CCA-AGA-ATG-GTA-CTC-TCT-CAG-G-3′ | 95 |
| PPAR-γ | F: 5′-GTG-ACT-TTA-TGG-AGC-CTA-AGT-TTG-AGT-TTG-3′ R: 5′-AGC-TAT-AAA-TAT-GGC-CAA-GTC-ACT-GTC-ATC-3′ | 86 |
| GAPDH | F: 5′-CCT-TCT-CTT-GTG-ACA-AAG-TGG-ACA-T-3′ R: 5′-CGT-GGG-TAG-AGT-CAT-ACT-GGA-ACA-T-3′ | 96 |
SREBP-lc: sterol regulatory element-binding protein-lc. FAS: fatty acid synthase. LXR: liver X receptor. ACC: acetyl-CoA carboxylase. AMPK-1α: AMP-activated protein kinase-1 a. PPAR-γ: peroxisome proliferator-activated receptor-γ. GAPDH: glyceraldehyde-3-phosphate dehydrogenase.
Liver samples were homogenized with protein lysis buffer (Pro-prep; iNtRON, Seongnam, South Korea). Samples containing 50 μg proteins were loaded onto SDS-PAGE gels (5% stacking and 10% separating gels) after being boiled for 10 min and transferred to nitrocellulose membranes (0.45 μm pore size, Bio-Rad, Hercules, CA, USA). After blocking in 5% skim milk solution for 60 min, the membranes were incubated with primary antibodies against G-CSFR (1:500; Santa Cruz Biotechnology Inc., Santa Cruz, CA, USA) or GADPH (1:2,000; Cell Signaling Technology, Boston, MA, USA) overnight at 4°C and washed three times (3 × 10 min) with TBST. The membranes were then incubated with HRP-conjugated anti-rabbit antibody (1:2,000; Jackson Immunoresearch, West Grove, PA, USA) for 1 h at room temperature. GAPDH was used as a protein loading control. Positive protein bands were visualized using an ECL kit (GenDEPOT, Barker, TX, USA), and the results were quantified with an image analyzer (Image lab 3.0, Bio-Rad).
Statistical analysisData are expressed as mean ± standard deviation (SD), except for histological data which are expressed as mean ± standard error of the mean (SE). Comparisons between groups were made using oneway analysis of variance (ANOVA) followed by a post hoc Tukey’s test. Data were analyzed using Student’s t-tests (for single comparisons) or one-way ANOVA (for multiple comparisons), and post hoc multiple comparisons were made with the Tukey’s test (equal variances assumed). Values of p < 0.05 were considered statistically significant. All statistical analyses were performed using SPSS statistics 21.0 for Windows (IBM, New York, USA).
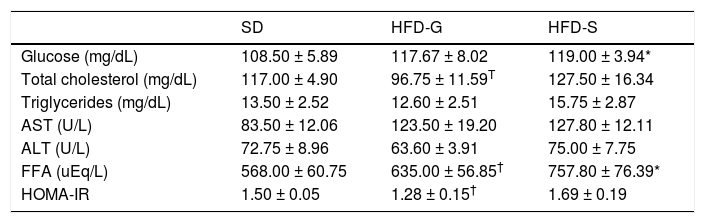
ResultsBody weight and biochemical analysisBody weight increased during the 30 weeks of the experiment in all groups, but was significantly higher (p < 0.05) in the HFD groups compared with the SD control group. Body weight did not differ significantly between the HFD groups (Figure 2). Glucose levels were similar in the HFD/G-CSF and HFD/saline groups during the 30 weeks of the experiment (data not shown). At the end of the experiment, total cholesterol was lower in the HFD/G-CSF group compared to that in the HFD/saline group (96.75 ± 11.59 mg/dL vs. 127.50 ± 16.34 mg/dL, p < 0.05), and was equal to that in the SD control group (117.00 ± 4.90 mg/dL). HOMA-IR was lower in the HFD/G-CSF group than in the HFD/saline group (1.28 ± 0.15 vs. 1.69 ± 0.19, p < 0.05), and was equal to that in the SD control group (1.50 ± 0.05). FFA was lower in the HFD/G-CSF group compared to that in the HFD/saline group (635.00 ± 56.85 μEq/L vs. 757.80 ± 76.39 μEq/L, p < 0.05), and was equal to that in the SD control group (568.00 ± 60.75 μEq/L). Finally, triglyceride, AST, and ALT levels were similar in the three groups (Table 2).

Biochemical analysis.
| SD | HFD-G | HFD-S | |
|---|---|---|---|
| Glucose (mg/dL) | 108.50 ± 5.89 | 117.67 ± 8.02 | 119.00 ± 3.94* |
| Total cholesterol (mg/dL) | 117.00 ± 4.90 | 96.75 ± 11.59T | 127.50 ± 16.34 |
| Triglycerides (mg/dL) | 13.50 ± 2.52 | 12.60 ± 2.51 | 15.75 ± 2.87 |
| AST (U/L) | 83.50 ± 12.06 | 123.50 ± 19.20 | 127.80 ± 12.11 |
| ALT (U/L) | 72.75 ± 8.96 | 63.60 ± 3.91 | 75.00 ± 7.75 |
| FFA (uEq/L) | 568.00 ± 60.75 | 635.00 ± 56.85† | 757.80 ± 76.39* |
| HOMA-IR | 1.50 ± 0.05 | 1.28 ± 0.15† | 1.69 ± 0.19 |
AST: aspartate aminotransferase. ALT: alanine aminotransferase. FFA: free fatty acid. HOMA-IR: homeostasis model assessment of insulin resistance. HOMA-IR = fasting insulin (μυ/mL) × fasting plasma glucose (mmoL/L)/22.5. SD: standard diet. HFD-G: high-fat diet treated with G-CSF. HFD-S: high-fat diet treated with saline. All data are expressed as mean ± SD.
All histological data were evaluated by an independent blinded investigator. The development of hepatic steatosis was confirmed by H-E and Oil Red O staining. Mild steatosis was evident in liver hepatocytes after 10 weeks on the HFD. At the end of the experiment, severe micro- and macrovesicular steatosis and hepatocyte ballooning were evident in the livers of the HFD/saline group after treatment, whereas fibrosis, collagen deposition, and inflammatory cell infiltration were still not evident. In contrast, fat accumulation was lower in the livers of the HFD/G-CSF group, which were no different from those of the SD control group (Figure 3A). The area of lipid droplets, as visualized by Oil Red O staining, was significantly lower in the HFD/G-CSF group compared to that in the HFD/saline group (0.70 ± 0.28% vs. 6.81 ± 1.74%, p < 0.01) and did not significantly differ from that in the SD control group (0.62 ± 0.04%) (Figure 3B and 3C).
. B. Stained with Oil Red O (magnification × 200). In Oil Red O-stained sections, red vesicles indicate lipid droplets. The mean percent area occupied by Oil Red O-stained lipid droplets was calculated for five randomly selected fields of each liver section. SD: standard diet. HFD-G: high-fat diet treated with G-CSF. HFD-S: high-fat diet treated with saline. All data are expressed as mean ± SE. * p < 0.05 vs. SD control group. † p < 0.05 vs. HFD-S group.")
Histological changes in liver tissue. A. Stained with hematoxylin and eosin (H-E). B. Stained with Oil Red O (magnification × 200). In Oil Red O-stained sections, red vesicles indicate lipid droplets. The mean percent area occupied by Oil Red O-stained lipid droplets was calculated for five randomly selected fields of each liver section. SD: standard diet. HFD-G: high-fat diet treated with G-CSF. HFD-S: high-fat diet treated with saline. All data are expressed as mean ± SE. * p < 0.05 vs. SD control group. † p < 0.05 vs. HFD-S group.
SREBP-1c, FAS, LXR, ACC, AMPK-1α, and PPAR-γ mRNA levels in the liver were measured using real-time PCR. The level of SREBP-1c mRNA was significantly lower in the HFD/G-CSF group compared to that in the HFD/saline group (117.87 ± 52.09% vs. 324.76 ± 76.47%, p < 0.05), and was equal to that in the SD control group (100.00 ± 55.40%) (Figure 4A). The level of FAS mRNA was significantly lower in the HFD/G-CSF group than in the HFD/saline group (185.73 ± 50.20% vs. 404.21 ± 164.59%, p < 0.05), and was equal to that in the SD control group (100.00 ± 54.21%) (Figure 4B). The level of LXR mRNA was significantly lower in the HFD/G-CSF group compared to that in the HFD/saline group (157.00 ± 31.02% vs. 310.26 ± 103.16%, p < 0.05), and was equal to that in the SD control group (100.00 ± 18.10%) (Figure 4C). No significant differences in the level of ACC mRNA were observed between the HFD/G-CSF and HFD/ saline groups (Figure 4D). The level of AMPK-1α mRNA was significantly higher in the HFD/G-CSF group than in the HFD/saline group (145.18 ± 69.42% vs. 45.56 ± 21.13%, p < 0.05), and not significantly different from that in the SD control group (100.00 ± 29.61%) (Figure 4E). The level of PPAR-γ mRNA was significantly higher in the HFD/G-CSF group compared to that in the HFD/saline group (175.99 ± 39.20% vs. 72.25 ± 36.64%, p < 0.05), and not significantly different from that in the SD control group (100.00 ± 27.43%) (Figure 4F).
-1c (A), fatty acid synthase (FAS) (B), liver X receptor (LXR) (C), acetyl-CoA carboxylase (ACC) (D), AMP-activated protein kinase (AMPK)-1α (E), and peroxisome proliferator-activated receptor (PPAR)-γ (F) mRNA in the liver were measured by real-time PCR. Mean values from the livers of four separate animals are shown. PCR was performed in duplicate. The transcript levels were normalized by comparison with GAPDH expression. SD: standard diet. HFD-G: high-fat diet treated with G-CSF. HFD-S: high-fat diet treated with saline. All data are expressed as mean ± SE. * p < 0.05 vs. SD control group. † p < 0.05 vs. HFD-S group.")
Expression of genes related to lipogenesis and β-oxidation. Levels of sterol regulatory element-binding protein (SREBP)-1c (A), fatty acid synthase (FAS) (B), liver X receptor (LXR) (C), acetyl-CoA carboxylase (ACC) (D), AMP-activated protein kinase (AMPK)-1α (E), and peroxisome proliferator-activated receptor (PPAR)-γ (F) mRNA in the liver were measured by real-time PCR. Mean values from the livers of four separate animals are shown. PCR was performed in duplicate. The transcript levels were normalized by comparison with GAPDH expression. SD: standard diet. HFD-G: high-fat diet treated with G-CSF. HFD-S: high-fat diet treated with saline. All data are expressed as mean ± SE. * p < 0.05 vs. SD control group. † p < 0.05 vs. HFD-S group.
G-CSFR expression in liver tissues was confirmed by the detection of the G-CSFR protein by western blot analysis (Figure 5). Based on these findings, we cannot exclude the possibility that G-CSF directly affects hepatic steatosis via receptor-mediated signaling.
Discussion in liver tissue. Levels of G-CSFR protein in the liver were detected by western blot. GAPDH was used as a loading control. A no-template negative control is also shown (N). M: marker.")
We showed that G-CSF treatment prevented the development of hepatic steatosis induced by HFD in our rat model. Moreover, G-CSF decreased expression of hepatic lipogenic genes such as SREBP-1c, FAS, and LXR, and increased expression of the β-oxidative genes AMPK-1α and PPAR-γ in the livers of rats.
Previously, we reported that G-CSF ameliorates hepatic steatosis at 4 weeks after only a single round of G-CSF treatment;6 however, the preventive effect of G-CSF in the development of hepatic steatosis has not been reported. In this study, we showed that G-CSF prevented the development of hepatic steatosis by continuously administering G-CSF to model rats before they developed steatosis. Histologically, we confirmed that G-CSF treatment prevents the development of macrovesicular steatosis and hepatocyte ballooning associated with steatosis, without any body weight reduction.
We used an HFD-induced hepatic steatosis rat model. Hepatic steatosis studies have used various mutant animal models, including db/db14 and ob/ob mice,15 and Otsuka Long-Evans Tokushima fatty rats.12 The HFD-induced hepatic steatosis rat model closely follows the progression pattern observed in obese humans.16 In addition, HFD can induce insulin resistance as well as hepatic steatosis.17
In the liver, insulin resistance stimulates the upregulation of lipogenic genes, resulting in increased FFAs. FFAs can either be oxidized in the mitochondria to form ATP or esterified to produce triglycerides.18 Imbalances between FFA synthesis and oxidation result in hepatic steatosis.19 We previously speculated that reduced expression of lipogenic genes such as SREBP-1c, FAS, and ACC is associated with a therapeutic effect of G-CSF on hepatic steatosis.6 In this study, we confirmed an increase in β-oxidative gene expression as well as a reduction in lipogenic gene expression in response to G-CSF treatment.
Higher HFD-induced oxidative stress activates SREBP-1c, which plays a key role in hepatic steatosis development.20 In addition, SREBP-1c activation increases FAS and ACC expression and leads to insulin resistance.20 LXR regulates lipogenic genes including SREBP-1c, FAS, and ACC, leading to de novo lipogenesis.21 Activation of AMPK suppresses SREBP-1c and ACC expression, leading to increases in mitochondrial fatty acid oxidation in the liver.22,23 Activation of PPAR-γ increases AMPK expression. In addition, previous studies have demonstrated that PPAR-γ, activated by rosiglitazone, ameliorates hepatic steatosis and increases fatty acid oxidation.24,25 In this study, G-CSF led to inactivation of lipogenic genes and activation of mitochondrial fatty acid oxidative genes in the hepatic steatosis rat model.
We observed reduced circulating FFA and insulin resistance. A reduction in circulating FFA reduces the input of FFA to hepatocytes. Because insulin in the liver accelerates FFA synthesis, improvement of insulin resistance leads to a reduction in hepatic steatosis.26 In addition, LXR and SREBP-1c reductions are associated with improvements in insulin resistance.27,28 A previous study showed that the absence of SREBP-1 improves insulin resistance in mice.29 In our study, G-CSF improved insulin resistance and reduced LXR and SREBP-1c expression. In addition, SREBP-1c inactivation by AMPK ameliorates insulin resistance and hepatic steatosis.30 In our animal model, G-CSF treatment reduced insulin resistance. We speculate that the preventive effect of G-CSF on hepatic steatosis in HFD rats is related to the improvement of insulin resistance and reduction of LXR and SREBP-1c expression.
Previous studies suggest several possible mechanisms underlying the general effect of G-CSF on liver diseases. Jin, et al.8 reported that the therapeutic effect of G-CSF in an acute hepatic injury mouse model is most likely due to mobilization of bone marrow mononuclear cells. Moreover, bone marrow-derived cells mobilized by G-CSF contribute to liver regeneration.31 In addition, Ji, et al.32 reported that G-CSF may act on liver cells through G-CSFR. In our study, G-CSFR was found in rat liver tissue. Thus, G-CSF may have a direct protective effect on hepatic steatosis by signaling via G-CSFR. Further studies are required to clarify whether G-CSF acts directly on hepatic steatosis as well as to explore the possibility of both receptor- and non-receptormediated mechanisms.
This study had several limitations. First, elucidating the major mechanisms underlying the preventive effect of G-CSF on hepatic steatosis will require further investigation into the bone marrow-dependent effects of G-CSF. Second, the optimal GCSF treatment including dose, timing, frequency, and duration remains to be established for clinical application. Third, we did not analyze the elevated GGT level, which is characteristic of NAFLD.33 It is necessary to clarify hepatic steatosis in future studies. Finally, the number of animals examined in this study was low. Further studies should involve a larger number of animals.
In summary, G-CSF prevented the development of hepatic steatosis and induced down-regulation of hepatic lipogenic genes and up-regulation of β-oxidative genes. We speculate that the preventive effect of GCSF on hepatic steatosis is related to the control of lipogenic and β-oxidative gene expression. In addition, we previously confirmed the therapeutic effect of GCSF on hepatic steatosis.6 Evidence supporting the preventive and therapeutic effects of G-CSF on hepatic steatosis points to an important new clinical approach for the treatment of hepatic steatosis with G-CSF, which merits examination in human clinical trials.
Abbreviations- •
ACC: acetyl-CoA carboxylase.
- •
ALT: alanine aminotransferase.
- •
AMPK: AMP-activated protein kinase.
- •
AST: aspartate aminotransferase.
- •
FAS: fatty acid synthase.
- •
FFA: free fatty acid.
- •
GAPDH: glyceraldehydes-3-phosphate dehydrogenase.
- •
G-CSF: granulocyte-colony stimulating factor.
- •
G-CSFR: granulocyte-colony stimulating factor receptor.
- •
GGT: gamma-glutamyl transferase.
- •
HFD: high-fat diet.
- •
HOMA-IR: homeostasis model assessment of insulin resistance.
- •
LXR: liver X receptor.
- •
PPAR: peroxisome proliferator-activated receptor.
- •
SREBP: strerol regulatory element-binding protein.


