


Background. This study aims to identify key genes and pathways involved in non-alcoholic fatty liver disease (NAFLD).
Material and methods. The dataset GSE48452 was downloaded from Gene Expression Omnibus, including 14 control liver samples, 27 healthy obese samples, 14 steatosis samples and 18 nonalcoholic steatohepatitis (NASH) samples. Differentially expressed genes (DEGs) between controls and other samples were screened through LIMMA package. Then pathway enrichment analysis for DEGs was performed by using DAVID, and alterations of enriched pathways were determined. Furthermore, protein-protein interaction (PPI) networks were constructed based on the PPI information from HPRD database, and then, networks were visualized through Cytoscape. Additionally, interactions between microRNAs (miRNAs) and pathways were analyzed via Fisher’s exact test.
Results. A total of 505, 814 and 783 DEGs were identified for healthy obese, steatosis and NASH samples in comparison with controls, respectively. DEGs were enriched in ribosome (RPL36A, RPL14, etc.), ubiquitin mediated proteolysis (UBE2A, UBA7, etc.), focal adhesion (PRKCA, EGFR, CDC42, VEGFA, etc.), FcγR-mediated phagocytosis (PRKCA, CDC42, etc.), and so on. The 27 enriched pathways gradually deviated from baseline (namely, controls) along with the changes of obese-steatosis-NASH. In PPI networks, PRKCA interacted with EGFR and CDC42. Besides, hsa-miR-330-3p and hsa-miR-126 modulated focal adhesion through targeting VEGFAand CDC42.
Conclusions. The identified DEGs (PRKCA, EGFR, CDC42, VEGFA), disturbed pathways (ribosome, ubi-quitin mediated proteolysis, focal adhesion, FcγR-mediated phagocytosis, etc.) and miRNAs (hsa-miR-330-3p, hsa-miR-126, etc.) might be closely related to NAFLD progression. These results might contribute to understanding NAFLD mechanism, conducting experimental researches, and designing clinical practices.
Non-alcoholic fatty liver disease (NAFLD) is the most common cause of liver disease worldwide with a prevalence of 15–30% in Western populations.1–4 In patients with NAFLD, nearly one quarter is nonalcoholic steatohepatitis (NASH),5 which is defined as the presence of hepatic steatosis and inflammation with hepatocyte injury (ballooning) with or without fibrosis.6 Many conditions, including obesity and location of fat storage, play a role in the pathogenesis of NAFLD, especially NASH.7 However, the molecular mechanism underlying NAFLD is still vague.
In the past years, NAFLD-related genes and microR-NAs (miRNAs) have been discovered. Previous studies have shown elevated levels of C-reactive protein (CRP), interleukin-6 (IL-6) and vascular endothelial growth factor (VEGF) in NASH patients compared with controls.8,9 The genetic variant I148M (rs738409) in Patatin-like phospholipase domain-containing 3 (PNPLA3) affects the secretion of hepatic very low density lipoproteins (VLDL) and promotes intracellular lipid accumulation in the liver by reducing the lipidation of VLDL, facilitating NAFLD development.10 Besides, miRNA-10b has been proven to regulate steatosis level by targeting peroxisome proliferator-activated receptors (PPAR)-α expression in NAFLD.11 It’s reported that apoptosis-related p53 overexpression activated miR-34a/SIRT1/p53 pathway in NAFLD morbid obese patients.12
Along with the development of high-throughput technology, microarray analysis and next-generation sequencing have been widely utilized to identify candidate disease-related genes and pathways. Based on RNA sequencing analysis of Shp(-/-) mice, novel gene signatures implicated in NASH have been identified and validated, including tetraspanin 4 (TSPAN4), peptidoglycan recognition protein 2 (PGLYRP2), thrombospondin 1 (THBS1), dual specific phosphatase-4 (DUSP4), etc.13 Through gene expression profiling and gene set enrichment analysis, Yoneda, et al. have found genes involved in NASH, including 27 up-regulated gene sets and 25 down-regulated gene sets.14 By analyzing gene expression profiles in high- and low-risk NAFLD patients, Moylan, et al. has found a 64-gene profile that can differentiate severe NAFLD from mild NAFLD and an independent 20-gene subset that correlates with NAFLD severity.15 Through array-based DNA methylation and mRNA expression profiling analyses of liver samples from healthy obese patients, steatosis patients, NASH patients, and controls, Ahrens, et al.16 have discovered NAFLD-specific mRNA expression and DNA methylation of nine genes coding for key enzymes in intermediate metabolism (including PC, ACLY and PLCG1) and insulin/insulin-like signaling (including IGF1, IGFBP2 and PRKCE). It’s also found that NAFLD-associated methylation changes were partially reversible. However, the pathways changed in NAFLD progression, and the miRNAs that regulate these altered pathways are still unclear.
In this study, the microarray dataset GSE48452 up-loaded by Ahrens, et al.16 was further analyzed to screen differentially expressed genes (DEGs) between healthy obese samples, steatosis samples, NASH samples, and controls. Then, pathway enrichment analysis was performed for DEGs, and variation of enriched pathways at different statuses was detected. Furthermore, protein-protein interaction (PPI) networks were constructed. Additionally, miRNAs targeting DEGs enriched in pathways were predicted. These results might be conducive to further experimental studies and provide better understanding of the nosogenesis of NAFLD.
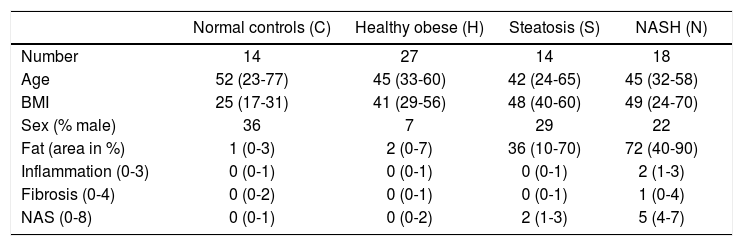
Material and MethodsGene expression dataThe gene expression data set GSE48452 was downloaded from Gene Expression Omnibus (GEO, http://www.ncbi.nlm.nih.gov/geo/), including 14 control liver samples (group C), 27 healthy obese samples (group H), 14 steatosis samples (group S) and 18 NASH samples (group N). It should be noted that only gene expression data were downloaded, and thus the sample size and information of enrolled individuals are different from the previous article of Ahrens, et al. In addition, information on sample number, age, body mass index, sex, fat area, inflammation, fibrosis, and non-alcoholic fatty liver disease activity score were collected from GEO (Table 1). Gene expression levels were measured by using [HuGene-1_1-st] Affymetrix Human Gene 1.1 ST Array [transcript (gene) version] (Affymetrix Inc., Santa Clara, California, USA). For the gene expression experiment, all patients provided written and informed consent, and its protocol was approved by the institutional review board (“Ethikkommission der Medizinischen Fakultät der Universität Kiel,” D425/07, A111/99).16
Overview for normal controls, healthy obese samples, steatosis samples, and NASH samples.
| Normal controls (C) | Healthy obese (H) | Steatosis (S) | NASH (N) | |
|---|---|---|---|---|
| Number | 14 | 27 | 14 | 18 |
| Age | 52 (23-77) | 45 (33-60) | 42 (24-65) | 45 (32-58) |
| BMI | 25 (17-31) | 41 (29-56) | 48 (40-60) | 49 (24-70) |
| Sex (% male) | 36 | 7 | 29 | 22 |
| Fat (area in %) | 1 (0-3) | 2 (0-7) | 36 (10-70) | 72 (40-90) |
| Inflammation (0-3) | 0 (0-1) | 0 (0-1) | 0 (0-1) | 2 (1-3) |
| Fibrosis (0-4) | 0 (0-2) | 0 (0-1) | 0 (0-1) | 1 (0-4) |
| NAS (0-8) | 0 (0-1) | 0 (0-2) | 2 (1-3) | 5 (4-7) |
The median and the interquartile range are provided for all numeric parameters. NASH: nonalcoholic steatohepatitis. BMI: body mass index. NAS: non-alcoholic fatty liver disease activity score.
Linear Models for Microarray Data (LIMMA) package17 of Bioconductor (available at http:// www.bioconductor.org/packages/release/bioc/html/) was used to identify genes that were differentially expressed between healthy obese and control samples (H vs. C), between steatosis and control samples (S vs. C), and between NASH and control samples (N vs. C). Because the DEGs with |log2 fold change (FC)| > 1 were rare, |log2 FC| ≠ 0 and p-value < 0.01 were chosen as the cut-off criteria.
Pathway enrichment analysisKyoto Encyclopedia of Genes and Genomes (KEGG) pathways enriched by the three sets of DEGs were revealed by using the Database for Annotation, Visualization and Integrated Discovery (DAVID, available at http:// david.abcc.ncifcrf.gov/).18 The p-value < 0.1 was set as the cut-off criterion.
Scoring altered pathwaysThree sets of significantly enriched pathways (H vs. C, S vs. C, and N vs. C) were combined, and a total of N pathways were obtained. The deviations of every pathway at status H, status S, and status N from status C were calculated based on gene expression levels.19 Firstly, DEGs from the gene pool of a specific pathway were selected out. Secondly, p-value was converted to Z-score (Z) by using inverse cumulative distribution function. Finally, an alteration score of a pathway, namely A (P), was determined for pathway P based on DEG Z-scores and following algorithm:
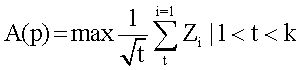
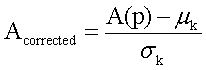
Several issues should be taken into account. First, not all DEGs involved in a pathway had significant influence on this pathway. For example, changes of downstream genes might be induced by abnormalities of upstream genes. In other words, changes of upstream genes involved in pathway could have more significant influence on pathways. Second, number of genes varies in different pathways. Thus, random perturbation treatment was applied to eliminate the influence of pathway size. During calculation, Z-score of DEGs was sorted in descending order. Bigger Z-score meant higher degree of differential expression. Assuming that pathway P contained k DEGs, when t genes (1 < t < k) had maximum average Z-score, these t genes were considered to have the most significant contribution to the pathway P, and then, A (P) was also calculated. In order to eliminate the influence of pathway size, normalization of each A (P) to Acorrected(P) score was accomplished by correcting background distributions based on the mean and standard deviation which were derived from A(P) scores of 10,000 random sets of k genes.
Construction of protein-protein interaction networksPPIs were obtained from Human Protein Reference Database (HPRD, available at http://www.hprd.org/)20 via Python program.21 If a protein normally expressed in human interacted with at least three DEGs, this protein would be selected to construct PPI networks together with DEGs. Then, PPI networks were visualized by using Cytoscape (available at http://cytoscape.org/).22 Moreover, in order to disclose changes of the networks at different statuses, topological properties of these networks were analyzed by using network analysis (a plugin in Cytoscape), such as degree, average shortest path length (ASPL), clustering coefficient (CC) and topological coefficient (TC).
Prediction of miRNAs associated with significant pathwaysThe common regulatory relationships between miRNAs and DEGs were abstracted from three databases, including miRecord,23 miRTarBase24 and Tarbase 6.0.25 A total of 5,489 interactions were obtained, containing 482 miRNAs and 2,331 target genes. Then, Fisher’s exact test26 was adopted to identify pairs of miRNA and pathway with significant relevance. Fisher’s exact test examines whether the proportion of target genes (namely, target genes of miRNA) in the gene group is same to the proportion of target genes in the entire genome. There are two hypotheses: first, whether the gene belongs to target gene group or not; second, whether the gene belongs to functional gene group (for example, group of pathway genes). Fisher’s score was defined as the probability of at least x genes can be identified in functional gene group in the K target genes.
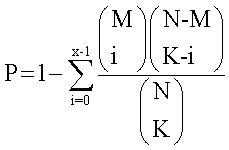
N represents the number of total genes in the whole genome; M represents the number of genes in a functional genes group; and K represents the number of target genes. Finally, altered pathways at different statuses were identified, as well as the miRNAs regulating the corresponding pathways.
ResultsIdentification of DEGsAccording to the threshold (p-value < 0.01 and |log2 FC| ≠ 0), a total of 505 DEGs (including 205 up-regulated and 300 down-regulated DEGs), 814 DEGs (including 283 up-regulated and 531 down-regulated DEGs), and 783 DEGs (including 392 up-regulated and 391 down-regulated DEGs) were identified between healthy obese and control samples (H vs. C), between steatosis and control samples (S vs. C), and between NASH and control samples (N vs. C), respectively.
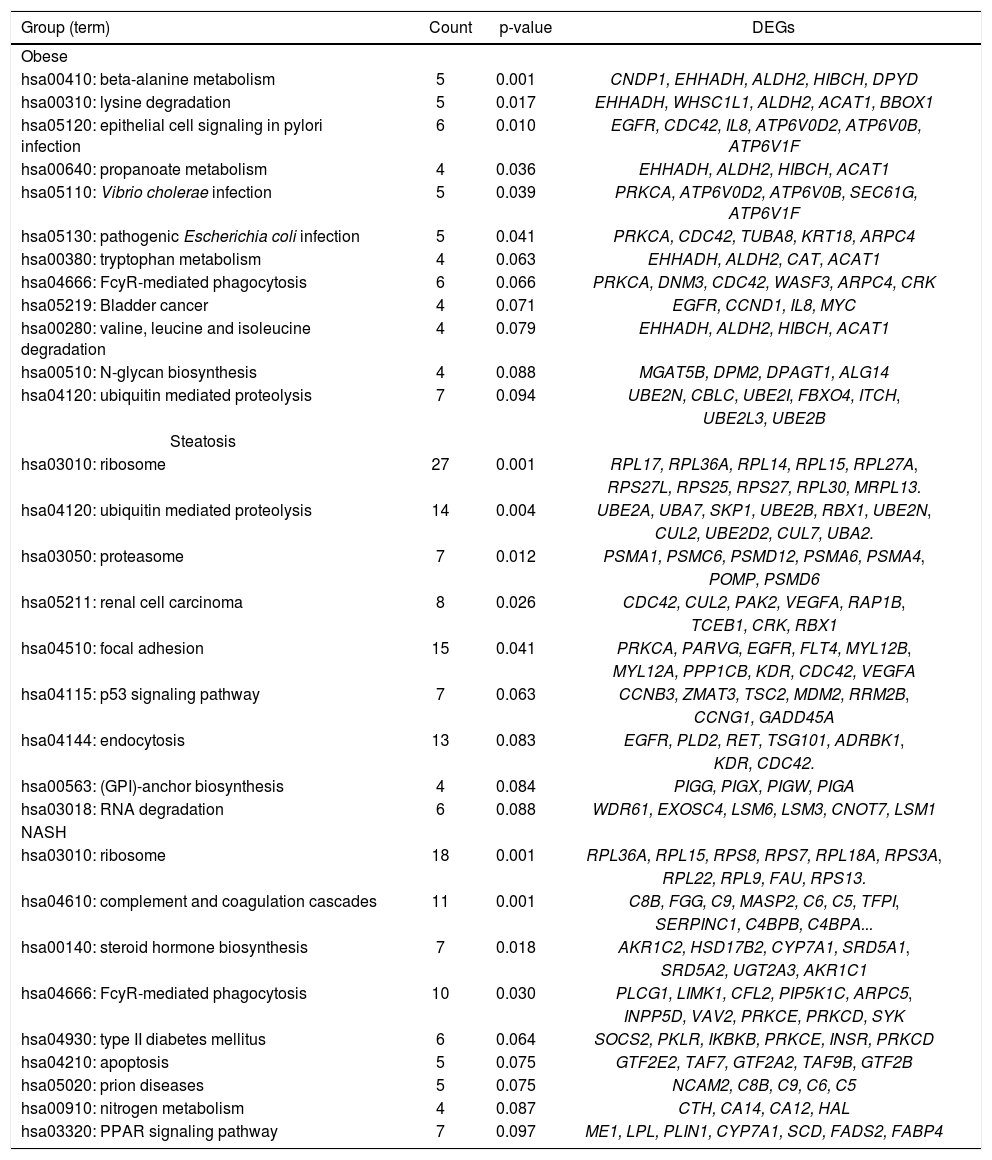
Pathway enrichment analysis for DEGsIn H vs. C contrast group, DEGs were significantly enriched in 6 KEGG pathways, such as FcyR-mediated phagocytosis (PRKCA, CDC42, etc.), ubiquitin mediated proteolysis (UBE2N, UBE2B, etc.), and so on. In S vs. C contrast group, DEGs were markedly enriched in ribosome (RPL36A, RPL14, etc.), ubiquitin mediated proteolysis (UBE2A, UBA7, etc.), focal adhesion (PRKCA, EGFR, CDC42, VEGFA, etc.), and so on. Meanwhile, in N vs. C contrast group, DEGs were significantly enriched in ribosome (RPL36A, RPL15, etc.), FcyR-mediated phagocytosis (PRKCE, PRKCD, etc.), and so on (Table 2).
Pathway enrichment analysis result for the DEGs between healthy obese, steatosis, NASH, and controls.
| Group (term) | Count | p-value | DEGs |
|---|---|---|---|
| Obese | |||
| hsa00410: beta-alanine metabolism | 5 | 0.001 | CNDP1, EHHADH, ALDH2, HIBCH, DPYD |
| hsa00310: lysine degradation | 5 | 0.017 | EHHADH, WHSC1L1, ALDH2, ACAT1, BBOX1 |
| hsa05120: epithelial cell signaling in pylori infection | 6 | 0.010 | EGFR, CDC42, IL8, ATP6V0D2, ATP6V0B, ATP6V1F |
| hsa00640: propanoate metabolism | 4 | 0.036 | EHHADH, ALDH2, HIBCH, ACAT1 |
| hsa05110: Vibrio cholerae infection | 5 | 0.039 | PRKCA, ATP6V0D2, ATP6V0B, SEC61G, ATP6V1F |
| hsa05130: pathogenic Escherichia coli infection | 5 | 0.041 | PRKCA, CDC42, TUBA8, KRT18, ARPC4 |
| hsa00380: tryptophan metabolism | 4 | 0.063 | EHHADH, ALDH2, CAT, ACAT1 |
| hsa04666: FcyR-mediated phagocytosis | 6 | 0.066 | PRKCA, DNM3, CDC42, WASF3, ARPC4, CRK |
| hsa05219: Bladder cancer | 4 | 0.071 | EGFR, CCND1, IL8, MYC |
| hsa00280: valine, leucine and isoleucine degradation | 4 | 0.079 | EHHADH, ALDH2, HIBCH, ACAT1 |
| hsa00510: N-glycan biosynthesis | 4 | 0.088 | MGAT5B, DPM2, DPAGT1, ALG14 |
| hsa04120: ubiquitin mediated proteolysis | 7 | 0.094 | UBE2N, CBLC, UBE2I, FBXO4, ITCH, |
| UBE2L3, UBE2B | |||
| Steatosis | |||
| hsa03010: ribosome | 27 | 0.001 | RPL17, RPL36A, RPL14, RPL15, RPL27A, |
| RPS27L, RPS25, RPS27, RPL30, MRPL13. | |||
| hsa04120: ubiquitin mediated proteolysis | 14 | 0.004 | UBE2A, UBA7, SKP1, UBE2B, RBX1, UBE2N, |
| CUL2, UBE2D2, CUL7, UBA2. | |||
| hsa03050: proteasome | 7 | 0.012 | PSMA1, PSMC6, PSMD12, PSMA6, PSMA4, |
| POMP, PSMD6 | |||
| hsa05211: renal cell carcinoma | 8 | 0.026 | CDC42, CUL2, PAK2, VEGFA, RAP1B, |
| TCEB1, CRK, RBX1 | |||
| hsa04510: focal adhesion | 15 | 0.041 | PRKCA, PARVG, EGFR, FLT4, MYL12B, |
| MYL12A, PPP1CB, KDR, CDC42, VEGFA | |||
| hsa04115: p53 signaling pathway | 7 | 0.063 | CCNB3, ZMAT3, TSC2, MDM2, RRM2B, |
| CCNG1, GADD45A | |||
| hsa04144: endocytosis | 13 | 0.083 | EGFR, PLD2, RET, TSG101, ADRBK1, |
| KDR, CDC42. | |||
| hsa00563: (GPI)-anchor biosynthesis | 4 | 0.084 | PIGG, PIGX, PIGW, PIGA |
| hsa03018: RNA degradation | 6 | 0.088 | WDR61, EXOSC4, LSM6, LSM3, CNOT7, LSM1 |
| NASH | |||
| hsa03010: ribosome | 18 | 0.001 | RPL36A, RPL15, RPS8, RPS7, RPL18A, RPS3A, |
| RPL22, RPL9, FAU, RPS13. | |||
| hsa04610: complement and coagulation cascades | 11 | 0.001 | C8B, FGG, C9, MASP2, C6, C5, TFPI, |
| SERPINC1, C4BPB, C4BPA... | |||
| hsa00140: steroid hormone biosynthesis | 7 | 0.018 | AKR1C2, HSD17B2, CYP7A1, SRD5A1, |
| SRD5A2, UGT2A3, AKR1C1 | |||
| hsa04666: FcyR-mediated phagocytosis | 10 | 0.030 | PLCG1, LIMK1, CFL2, PIP5K1C, ARPC5, |
| INPP5D, VAV2, PRKCE, PRKCD, SYK | |||
| hsa04930: type II diabetes mellitus | 6 | 0.064 | SOCS2, PKLR, IKBKB, PRKCE, INSR, PRKCD |
| hsa04210: apoptosis | 5 | 0.075 | GTF2E2, TAF7, GTF2A2, TAF9B, GTF2B |
| hsa05020: prion diseases | 5 | 0.075 | NCAM2, C8B, C9, C6, C5 |
| hsa00910: nitrogen metabolism | 4 | 0.087 | CTH, CA14, CA12, HAL |
| hsa03320: PPAR signaling pathway | 7 | 0.097 | ME1, LPL, PLIN1, CYP7A1, SCD, FADS2, FABP4 |
DEGs: differentially expressed genes. NASH: nonalcoholic steatohepatitis.
After combining the above three sets of pathways enriched by DEGs, a total of 27 significant pathways were obtained. Taking normal controls as the baseline (Figure 1), alteration score was determined for each pathway. On the whole, all of the 27 pathways were gradually deviated from the baseline along with the change of normal-obesity-steatosis-NASH. Some pathways showed significant deviation from the baseline and obvious changes along with the change of normal-obesity-steatosis-NASH, such as ribosome, ubiquitin mediated proteolysis, focal adhesion and FcR-mediated phagocytosis.
PPI networks analysis
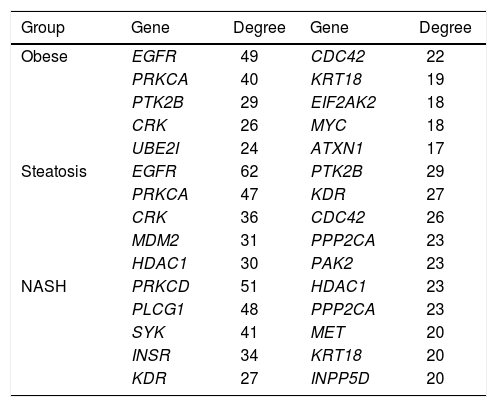
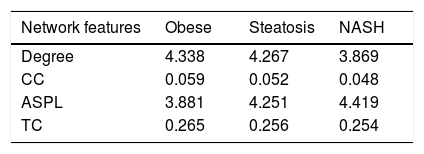
The PPI network for DEGs in H vs. C contrast group consisted of 254 genes and 551 interactions (Figure 2), and some genes had high degrees, such as EGFR (degree = 49) and PRKCA (degree = 40) (Table 3). Besides, in the net-work for DEGs in S vs. C contrast group, there were 464 genes and 1,059 interactions (Figure 3), and some genes had high degrees, such as EGFR (degree = 62), PRKCA (degree = 47) (Table 3). Meanwhile, in these two networks, PRKCA interacted with numerous genes, such as EGFR and CDC42. Furthermore, the network for DEGs in N vs. C contrast group contained 471 genes and 995 interactions (Figure 4), and some genes had higher degrees, such as PRKCD (degree = 51) and PLCG1 (degree = 48) (Table 3). Additionally, along with the change of obesity-steatosis-NASH, the average degrees of PPI network decreased, ASPLs of PPI network increased, CCs and TCs of PPI network exhibited small declines (Table 4).

The top 10 genes in the PPI networks of obese, steatosis, and NASH
| Group | Gene | Degree | Gene | Degree |
|---|---|---|---|---|
| Obese | EGFR | 49 | CDC42 | 22 |
| PRKCA | 40 | KRT18 | 19 | |
| PTK2B | 29 | EIF2AK2 | 18 | |
| CRK | 26 | MYC | 18 | |
| UBE2I | 24 | ATXN1 | 17 | |
| Steatosis | EGFR | 62 | PTK2B | 29 |
| PRKCA | 47 | KDR | 27 | |
| CRK | 36 | CDC42 | 26 | |
| MDM2 | 31 | PPP2CA | 23 | |
| HDAC1 | 30 | PAK2 | 23 | |
| NASH | PRKCD | 51 | HDAC1 | 23 |
| PLCG1 | 48 | PPP2CA | 23 | |
| SYK | 41 | MET | 20 | |
| INSR | 34 | KRT18 | 20 | |
| KDR | 27 | INPP5D | 20 |
PPI: protein-protein interaction. NASH: nonalcoholic steatohepatitis.


Topological properties of the 3 networks.
| Network features | Obese | Steatosis | NASH |
|---|---|---|---|
| Degree | 4.338 | 4.267 | 3.869 |
| CC | 0.059 | 0.052 | 0.048 |
| ASPL | 3.881 | 4.251 | 4.419 |
| TC | 0.265 | 0.256 | 0.254 |
CC: clustering coefficient ASPL: average shortest path length. TC: topological coefficient NASH: nonalcoholic steatohepatitis. The value is a mean for all genes in each network.
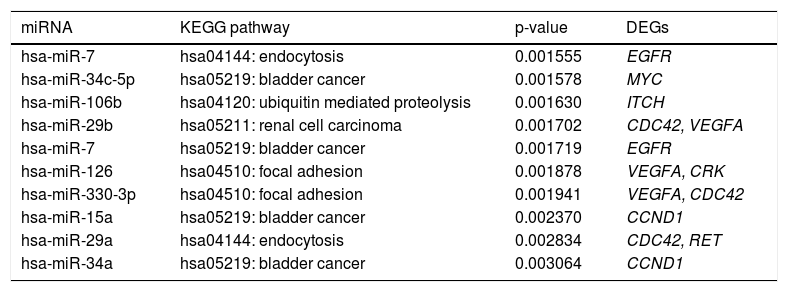
Some miRNAs were identified to regulate DEGs enriched in a set of significant pathways. For instance, hsa-miR-126 and hsa-miR-330-3p regulated focal adhesion via targeting VEGFA and CDC42 (Table 5).
The top 10 miRNA-target-pathway with the highest significant relevance.
| miRNA | KEGG pathway | p-value | DEGs |
|---|---|---|---|
| hsa-miR-7 | hsa04144: endocytosis | 0.001555 | EGFR |
| hsa-miR-34c-5p | hsa05219: bladder cancer | 0.001578 | MYC |
| hsa-miR-106b | hsa04120: ubiquitin mediated proteolysis | 0.001630 | ITCH |
| hsa-miR-29b | hsa05211: renal cell carcinoma | 0.001702 | CDC42, VEGFA |
| hsa-miR-7 | hsa05219: bladder cancer | 0.001719 | EGFR |
| hsa-miR-126 | hsa04510: focal adhesion | 0.001878 | VEGFA, CRK |
| hsa-miR-330-3p | hsa04510: focal adhesion | 0.001941 | VEGFA, CDC42 |
| hsa-miR-15a | hsa05219: bladder cancer | 0.002370 | CCND1 |
| hsa-miR-29a | hsa04144: endocytosis | 0.002834 | CDC42, RET |
| hsa-miR-34a | hsa05219: bladder cancer | 0.003064 | CCND1 |
miRNA: microRNA. KEGG: Kyoto Encyclopedia of Genes and Genomes. DEGs: differentially expressed genes. The genes enriched in pathways were regulated by the corresponding miRNAs.
In the present study, gene expression profiles of healthy obese, steatosis and NASH samples were compared to healthy controls, and a total of 505, 814 and 784 DEGs were identified, respectively. According to the pathway deviation analysis, obvious changes of pathways enriched by DEGs along with the change of normal-obesity-steatosis-NASH were observed, such as ribosome (RPL36A, RPL14, etc.), ubiquitin mediated proteolysis (UBE2A, UBE2B, etc.), focal adhesion (PRKCA, EGFR, CDC42, VEGFA, etc.), and FcyR-mediated phagocytosis (PRKCA, CDC42, etc.). Reportedly, obesity is a risk factors of NAFLD,7 and NASH is always developed from steatosis. Therefore, it’s supposed that obesity develops into steatosis, steatosis develops into NASH, and these developments are associated with the deviation of the 27 pathways.
Among these pathways, ubiquitin mediated proteolysis and ribosome were both associated with protein metabolism. In the liver with non-alcoholic steatosis or steatohepatitis, inactivation of the ubiquitin-proteasome pathway mediates cell death caused by oxidative stress.27 In this study, UBE2A (ubiquitin-conjugating enzyme E2A) and UBA7 (ubiquitin-like modifier activating enzyme 7) were demonstrated to take part in ubiquitin mediated proteolysis. Thus, UBE2A and UBA7 might be involved in NAFLD through ubiquitin mediated proteolysis.
There is no relevant evidence showing ribosome is associated with NASH or NAFLD, while ribosome is closely related to apoptosis,28 which is a pathological feature of NAFLD and promote the development from simple steatosis to NASH.29 In the present study, RPL36A (ribosomal protein L36a) and RPL14 (ribosomal protein L14) were found to participate in ribosome pathway. In addition, the expression levels of RPL36A were significantly down-regulated in healthy obese samples (log2 FC = −0.186), steatosis samples (log2 FC = −0.421), and NASH samples (log2 FC = −0.340), in comparison with normal controls; the expression levels of RPL14 were significantly down-regulated in healthy obese samples (log2 FC = −0.104), steatosis samples (log2 FC = −0.221), and NASH samples (log2 FC = −0.187), in comparison with normal controls. The down-regulation of RPL36A and RPL14 might further promote cell death. Therefore, these genes might play a role in NAFLD through ribosome pathway.
Focal adhesion is crucial in liver disease, because the stage of simple steatosis progressing over steatohepatitis to fibrosing steatohepatitis is characterised by adhesion of leucocytes to the sinusoidal endothelium.30 In this study, PRKCA (protein kinase C α), EGFR (epidermal growth factor receptor), CDC42 (cell division cycle 42) and VEGFA (vascular endothelial growth factor A) were significantly enriched in focal adhesion. The expression levels of PRKCA were significantly up-regulated in healthy obese samples (log2 FC = 0.210), steatosis samples (log2 FC = 0.253), and NASH samples (log2 FC = 0.063), in comparison with normal controls. In the PPI networks for DEGs of H vs. C contrast group and S vs. C contrast group, PRK-CA had high degrees and interacted with EGFR and CDC42. The study of Yang, et al. has shown that EGFs can stimulate proliferation of hepatic stellate cells,31 which is the primary effector cell, orchestrating the deposition of extracellular matrix (ECM) in fibrotic liver.32 In this study, the expression levels of EGFR were significantly up-regulated in healthy obese samples (log2 FC = 0.224), steatosis samples (log2 FC = 0.243), and NASH samples (log2 FC = 0.059), in comparison with normal controls. Besides, CDC42 participates in the activation of saturated fatty acid-induced c-Jun N-terminal kinase (JNK) in hepatocytes,33 which is evident in NASH patients.34,35 In addition, VEGFs play an important role in the development of liver fibrosis and hepatocarcinogenesis in NASH, coordinating with leptin-mediated neovascularization.36 In this study, the expression levels of VEGFA were significantly up-regulated in healthy obese, steatosis, and NASH samples, in comparison with normal controls. This result was consistent with the study (at serum level) of Coulon, et al.37 Hence, PRKCA, EGFR, CDC42, and VEGFA might participate in the development of NAFLD through focal adhesion.
In the progression of NAFLD, phagocytic dysfunction is aggravated.38 In this study, DEGs PRKCA, CDC42, PRKCE and PRKCD were enriched in FcyR-mediated phagocytosis. It should be noted that PRKCA, PRKCE (protein kinase C ε), and PRKCD (protein kinase C δ) belong to the same protein family, and thus share similar bio-functions in liver.39 As discussed above, PRKCA, CDC42, PRKCE, and PRKCD might participate in the development of NAFLD through FcyR-mediated phagocytosis.
In our study, it’s also discovered that CDC42 and VEG-FA were regulated by hsa-miR-330-3p, and VEGFA was regulated by hsa-miR-126, in the pathway of focal adhesion. Reportedly, the expression of hsa-miR-330-3p is altered in NAFLD,40 and miR-126 is down-regulated in type 2 diabetes,41 which is commonly associated with NASH.42 Also, miR-126 can target insulin receptor substrate-1 (IRS-1),43 which is correlated with the severity of liver damage in patients with NAFLD.44 Thereby, hsamiR-330-3p and hsa-miR-126 might play pivotal roles in the development of NAFLD via regulating focal adhesion through VEGFA or CDC42.
In summary, a number of DEGs (including PRKCA, EGFR, CDC42, VEGFA, etc.), disturbed pathways (including ribosome, ubiquitin mediated proteolysis, FcγR-mediated phagocytosis, focal adhesion, etc.) and several miRNAs (including hsa-miR-330-3p, hsa-miR-126, etc.) were revealed in the development of NAFLD. The results of this study might be conducive to the further understanding of NAFLD mechanism, and provide a theoretical basis for further experimental researches and clinical practices. For example, the key genes and miRNAs identified in this study might serve as therapeutic targets for the treatment of NAFLD after generating pre-clinical evidences.
Disclosures of Conflict of InterestThe authors declare that they have no conflict of interests.
Authors’ ContributionsRFW proposed the study. RFW and XW performed research and wrote the first draft. SR collected and analyzed the data. All authors contributed to the design and interpretation of the study and to further drafts. LWZ is the guarantor.
AcknowledgementsThis work was financially supported by the Natural Science Foundation of Heilongjiang Province of China (No. D201139).


