


Liver biopsy is the golden standard for staging liver fibrosis, but it may be accompanied by complications. Because of this complication, the aim of this study is to evaluate a simple noninvasive score to assess hepatic fibrosis in chronic hepatitis C genotype 4 patients which is very may have an important in diagnosis and therapeutic decision. This score [HA vascular (HAV) score] is a combination of direct markers [hyaluronic acid (HA) and vascular endothelial growth factor (VEGF)] and indirect markers [aspartate aminotransferase (AST)/alanine aminotransferase (ALT) ratio (AAR)].
ResultsSamples were collected from 220 patients (F0-F4): an estimated group (n = 120) and a validated group (n = 100). HA and VEGF levels, HCV RNA, liver function tests, platelet counts were assayed, Fibroscan was done and liver biopsy was taken and the stage of liver fibrosis and the grade of inflammatory activity was calculated according to Metavir score system. HA vascular (HAV) score = -35.1 + 0.14 (HA) (ng/L) + 0.03 (VEGF) (pg/mL) + (-6.7) [AAR (AST/ALT ratio)]. The HAV score produced areas under curve of 0.979 and 0.994 for significant (F2-F4) and advanced fibrosis (F3-F4) (cut off = 0.583 and 6.3, respectively). Surprisingly, the validation study of this score gave very good values of AUCs i.e. 0.990, 0.996 and 0.995 for significant, advanced and liver cirrhosis.
ConclusionsOur developed score can not only help to assess liver fibrosis staging effectively but also avoid the invasiveness and the limitations of liver biopsy in Egyptian hepatitis C virus patients.
The liver is a vital organ in the body because it performs many important functions e.g. detoxification, protein synthesis and help in digestion.1 It is prone to many diseases including viral hepatitis C virus (HCV) which cause its inflammation2 with subsequent acute or chronic disorders e.g. liver fibrosis, cirrhosis, hepatocellular carcinoma (HCC) and finally death.3
Globally HCV is considered a major health problem. This is because more than 180 million individuals are chronically infected with HCV.4 Virological diagnosis of HCV infection is based on two categories of laboratory tests; detecting specific antibody to HCV (anti-HCV) (indirect tests) and assays that can detect, quantify, or characterize the components of HCV viral particles, such as HCV RNA and core antigen (direct tests).5
Liver fibrosis is the scarring process that produced from the excessive accumulation of extracellular matrix (ECM) proteins6,7 that form fibrous scar tissue in the liver. The formation of the latter distorts the organization of hepatic architectures and develops nodules of renewal hepatocytes, disrupts blood flow through the liver and finally produces hepatocellular dysfunctions.6
Liver biopsy, which is staged by Metavir (stages 0-4) and Ishak score (stages 0-5),8,9 is still the golden standard for assessment of hepatic fibrosis although its invasiveness, and the possibility of sampling errors and complications.10
Nowadays, there is a need for reliable, simple, and non-invasive methods for staging liver fibrosis. These methods contain routine laboratory tests, such as serum ami-notransferase, platelet count, serum albumin level and pro-thrombin time (indirect markers).11,12 In addition, serum levels of proteins, which are directly related to hepatic fi-brogenesis, are used as surrogate markers of such process. These include collagen type III, tissue inhibitor of metal-loproteinase type 1 (TIMP-1), HA and vascular endotheli-al growth factor VEGF.13
Serum HA level increases with the development of fi-brosis and/or cirrhosis.14 Generally, the imbalance between ECM proteins degradation and production lead to liver fibrogenesis.15
Liver sinusoidal endothelium (LSE) plays an important role in stabilizing tissues and in the organization of the growth and cells differentiation. Cirrhotic livers are characterized by transformation of the LSE into a continuous, vascular type, i.e. sinusoidal endothelial cells (SECs) cap-illarization. HA is a serum marker which can effectively reflect such capillarization process. The latter process; initiates response from hepatic stellate cell (HSC) that gets activated by oxidative stress resulting in the production of larger amounts of ECM components including HA which exegrravated SECs capillarization. Under these conditions, if the liver regeneration fails, the hepatocytes are substituted with abundant fibrillar collagen.16 Such transformations lead to hypoxia17 through mechanisms requiring the participation of pro-inflammatory cytokines and growth factors;18 including vascular endothelial growth factor (VEGF). The latter promotes and regulates en-dothelial cell proliferation and migration, matrix remodeling, recruitment of pericytes and neovessels stabilization in a process called angiogenesis. This is because it acts as a highly specific mitogen for endothelial cells by increasing vascular permeability through disorganization of endothe-lial junctional proteins.18-20
Angiogenesis is an essential process for organ growth and repair during and after hepatic diseases.21 The disruption of the balance between hepatic fibrogenesis and ang-iogenesis can lead to several diseases including malignancy.22
Therefore, the aim of this study is to develop and validate a predictive noninvasive score to assess hepatic fibro-sis in chronic hepatitis C genotype 4 patients which have an important role in the diagnosis and therapeutic decision. Also, its diagnostic power will be compared against APRI,23 AAR,24 FI,25 GUCI26 and King score.27
Materials and MethodsPatientsThis study was conducted on 220 patients (F0-F4): an estimated group (n = 120) and a validated group (n = 100). The patients were randomly chosen from adult males and females. They were selected from The Egyptian Liver Research Institute and Hospital (ELRIAH) in Dakahlia, Egypt and considered a part of processing for treatment design. All patients were negative for other causes of chronic liver diseases and having normal kidney function, normal glucose and with no liver transplantation. All patients were tested positive for the presence of HCV RNA using quantitative polymerase chain reaction (PCR) assay for HCV-RNA (COBAS; Roche Diagnostics, Pleasanton, California, USA) and HCV antibodies using Enzyme linked immunosorbent (ELISA) [version 4.0, Diasorin S.P.A. via Crescent no 13040 Saluggia (VC) ( Italy)]. None of the patients had received antiviral treatment before liver biopsies and blood samples. The dominant HCV genotype in Egypt is HCV genotype4 which is detected by immu-nohistochemistry to detect the HCV nonstructural 3 protein in paraffin-embedded tissue specimens of B-cell NHL patients. In addition, the study included 20 healthy individuals who were free from any disease, especially chronic liver diseases.
The study was approved by the ethical committee of Mansoura Medical School. An informed consent was obtained from each individual who participated, and all of the participants were fully informed about the nature of the disease and the diagnostic procedures involved.
Samples and blood markersBlood samples were withdrawn by vein puncture from all cases within 2 weeks of liver biopsy and were divided into two portions. The first was collected on EDTA-K2 (EDM, Cairo, Egypt) for determination of platelet count (PLt). The second part was left to clot and serum was separated and either freshly used or kept frozen at -80 °C until use in each case. Serum liver functions, HA, VEGF, HCV RNA and HCVAbs were estimated in both patients and control.
Biochemical investigationsThe following were measured in the serum of each patient and control subject.
- •
Human Hyaluronic Acid (HA) and Vascular En-dothelial Growth Factor (VEGF) assay. The used HA and VEGF kits were bought purchased from WKEA MED SUPPLIES CORP (206 building 6, Chenguang Gardon, Qianjin street; Changchan 130012 China). The reaction based on sandwich ELISA technique (Stat Fax 3200) according to the enclosed pamphlets.19
- •
Routine liver function tests and blood picture. They include alanine amino-transferase (ALT) and aspartate aminotransferase (AST), alkaline phosphatase (ALP), albumin (Alb) and total bilirubin. These parameters were assayed using automated Biochemistry analyzer (A15; Biosystem, Barcelona, Spain). Prothrombin activity was estimared and INR was calculated.
- •
Haematological parameters. Complete blood pictures including Platelets were performed on D-cell 60 automated Hematology analyzer (D-cell 60; Diagon Ltd, Budapest, Hungary).
Serological markers for detecting HCV antibodies were done using ELISA kit which was provided by Mer-ieux anti-HCV, version 4.0, Diasorin S.P.A. via Crescent no 13040 Saluggia (VC) (Italy). Molecular detection of HCV RNA was done by quantitative PCR using QIAamp viral RNA extraction kit (Qiagen USA cat #52906).
Histopathological examinationLiver biopsy was performed as part of the routine clinical care of these patients to make a decision on antiviral therapy. Liver biopsy was carried out using 16-gauge Tru-Cut needle biopsy. Tissue specimens obtained by liver biopsy were fixed immediately in 10% formalin solution, prepared and examined by sent to the two experienced pa-thologists who were blinded to the clinical data at the same day. The stage of fibrosis and grade of inflammatory activity in the liver were determined according to the METAVIR scoring system.17 All biopsy specimens were examined by two experienced pathologists who were blinded to the clinical data and the measurements of liver stiffness which is: F0 (no fibrosis), F1 (mild fibrosis without septa), F2 (moderate fibrosis with few septa), F3 (severe fibrosis with numerous septa but without cirrhosis) and F4 (cirrhosis). After staging of liver fibrosis, the patients were classified into two groups; the first includes F0-F1 (non-significant fibrosis) and F2, F3 and F4 (significant fibrosis). The second group includes F0, F1, F2 (non-severe fibrosis) and F3, F4 (severe fibrosis).23
Fibroscan and ultrasonographyLiver stiffness was also measured by transient elastogra-phy (Fibroscan; Echosens SA, Paris, France). Ten successful acquisitions were performed on each patient. The results that obtained ten valid measurements with a success rate of at least 60% and an interquartile range under 30% were considered successful. A median of 10 valid measurements was regarded as the liver stiffness for a given subject, and expressed in Kilopascals (KPa).
Formulas of the selected Scores and our developed score- •
AST: platelets ratio index (APRI) was calculated using Wai's formula:23
AST (upper limit of normal)/ALT (IU/L) x 100)/plate-let count (platelets x 109/L) X 100
- •
Fibrosis index (FI) was calculated using this formula25 as: 8.0-0.01 x platelet count (x 109/L) - serum albumin (g/dL)
- •
Göteborg University Cirrhosis Index (GUCI) using this formula:26
(AST x INR x 100)/platelet count (109/L)
- •
King's score using this formula:27
Age (years) x AST (IU/L) x INR/platelet count (109/L)
- •
AAR: alanine aspartate transferase (AST)/alanine ami-notransferase (ALT) ratio (AAR).24
- •
6- our developed score:
HA vascular (HAV) score = [-35.1 + 0.14 (HA) (ng/L) + 0.03 (VEGF) (pg/mL) + (-6.7) (AAR)].
All patients were informed about the study details then signed a written informed consent. With respect to patients’ confidentiality, patients were represented in the study by code numbers. All personal data were included. The study protocol conformed to the ethical guidelines of the 1975 Declaration of Helsinki as reflected in a priori approval by the institution's human research committee.
Statistical analysisAll statistical analyses were performed by Medcalc software (version 15; Medcalc Software Bvba, Mariakerke, Belgium). Continuous variables were expressed as mean ± standard deviation (SD). Comparisons of fibrogenic and angiogenic markers as well as routine laboratory tests and fibrosis stages were analyzed by Mann-Whitney U-test using a two-sided P-value. The main endpoint was the identification of patients with clinically significant fibrosis (F2-F4) versus those without (F0-F1) using a simple combination of routine laboratory markers. Multiple logistic regression analysis was carried out using variables found to show significant differences between the two groups by univariate or receiver operating characteristic (ROC) analysis. Markers with high area under the curve (AUC) or a high significance on univariate analysis were added to create multivariable models. Models on the basis of combinations of different markers were then compared by ROC curves to determine which was the most accurate in detecting significant fibrosis. For formulation of the predictive score, a univariate analysis was carried out to identify variables that were significantly different between patients with clinically significant fibrosis versus those without clinically significant fibrosis. A single model with the fewest variables and greatest AUC was selected and applied to the validation group. The cut-off values for optimal clinical performance measure were determined from ROC curves. The cut-offs selected from the ROC curve were those that best identified significant fibrosis (F2-F4), advanced fibrosis (F3-F4). A value of P < 0.05 was considered statistically significant. ROC curve was done to determine the cutoff point, AUC, sensitivity, specificity, positive predictive value (PPV) and negative predictive value (NPV) of presences of fibrosis to define Diagnostic accuracy.
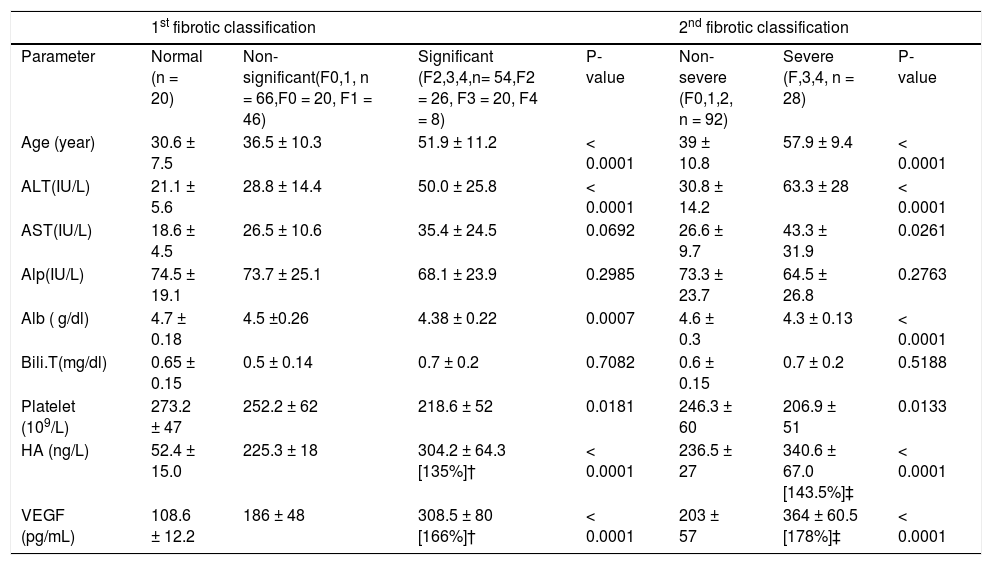
ResultsPatient's dataAccording to Metavair score, 20 (16.5%) patients were in F0, F1 in 46 (38%), F2 in 26 (22%), F3 in 20 (16.5%) and 8 (7%) patients in F4 (Table 1). The demographic data and laboratory blood markers of all patients and 20 healthy individuals are shown in table 1.
Baseline characteristics of chronic hepatitis C patients and healthy individuals.
| 1st fibrotic classification | 2nd fibrotic classification | ||||||
|---|---|---|---|---|---|---|---|
| Parameter | Normal (n = 20) | Non-significant(F0,1, n = 66,F0 = 20, F1 = 46) | Significant (F2,3,4,n= 54,F2 = 26, F3 = 20, F4 = 8) | P-value | Non-severe (F0,1,2, n = 92) | Severe (F,3,4, n = 28) | P-value |
| Age (year) | 30.6 ± 7.5 | 36.5 ± 10.3 | 51.9 ± 11.2 | < 0.0001 | 39 ± 10.8 | 57.9 ± 9.4 | < 0.0001 |
| ALT(IU/L) | 21.1 ± 5.6 | 28.8 ± 14.4 | 50.0 ± 25.8 | < 0.0001 | 30.8 ± 14.2 | 63.3 ± 28 | < 0.0001 |
| AST(IU/L) | 18.6 ± 4.5 | 26.5 ± 10.6 | 35.4 ± 24.5 | 0.0692 | 26.6 ± 9.7 | 43.3 ± 31.9 | 0.0261 |
| Alp(IU/L) | 74.5 ± 19.1 | 73.7 ± 25.1 | 68.1 ± 23.9 | 0.2985 | 73.3 ± 23.7 | 64.5 ± 26.8 | 0.2763 |
| Alb ( g/dl) | 4.7 ± 0.18 | 4.5 ±0.26 | 4.38 ± 0.22 | 0.0007 | 4.6 ± 0.3 | 4.3 ± 0.13 | < 0.0001 |
| Bili.T(mg/dl) | 0.65 ± 0.15 | 0.5 ± 0.14 | 0.7 ± 0.2 | 0.7082 | 0.6 ± 0.15 | 0.7 ± 0.2 | 0.5188 |
| Platelet (109/L) | 273.2 ± 47 | 252.2 ± 62 | 218.6 ± 52 | 0.0181 | 246.3 ± 60 | 206.9 ± 51 | 0.0133 |
| HA (ng/L) | 52.4 ± 15.0 | 225.3 ± 18 | 304.2 ± 64.3 [135%]† | < 0.0001 | 236.5 ± 27 | 340.6 ± 67.0 [143.5%]‡ | < 0.0001 |
| VEGF (pg/mL) | 108.6 ± 12.2 | 186 ± 48 | 308.5 ± 80 [166%]† | < 0.0001 | 203 ± 57 | 364 ± 60.5 [178%]‡ | < 0.0001 |
ALT: Alanine amino-transferase. AST: Aspartate aminotransferase. Alb: Albumin. Alp: Alkaline phosphatase (IU/L). Bili.T: total bilirubin. HA: Hyaluronic acid. VEGF: Vascular Endothelial Growth Factor. SD: standard deviations. Values were expressed as mean ±SD. †Percent of change compared to Non- significant fibrosis. ‡ Percent of change compared to Non- severe.
Liver biochemical tests (serum albumin and total bi-lirubin level, ALT, AST, and Alp activity alkaline phos-phatase) were significantly different in various groups in both classifications (Table 2). The activities of both ALT and AST and the level of HA and VEGF were increased in sera of patients with significant fibrosis as well as in those with severe fibrosis compared with those of nonsignificant and non-severe fibrosis, respectively. While Alp activity, albumin level and platelet count were decreased in the blood of patients with significant fibrosis. Comparing the ability of these markers to differentiate between groups of both classifications, it was found that the extent of increase of HA, VEGF, ALT and AST in severe fibrosis (F3-F4, n = 14) was higher than that of the significant fibrosis (F2-F4, n = 27). In each case, the AUCs were used for identification of patients with significant fibrosis from those with non-significant fibrosis. The AUCs were 0.941 and 0.911 for HA and VEGF, respectively. The basic diagnostic power of HA has specificity (94%) and sensitivity (85%) PPV (92%) and NPV (89%) (p < 0.0001). In addition, those of VEGF the specificity was (91%), sensitivity (78%), PPV of 88% and NPV of 83% (p < 0.0001). Also, the levels of HA and VEGF can differentiate patients with severe from those with a non-severe fibrosis. AUC of HA is 0.959 with specificity of 89, sensitivity of 93, PPV of 72%, NPV of 98%, (p < 0.0001) (Figure 1A) and AUC of VEGF is 0.994 with specificity (93%), sensitivity (100%), PPV of 82% and NPV of 100% (p < 0.0001) (Figure 1B) (Table 2).
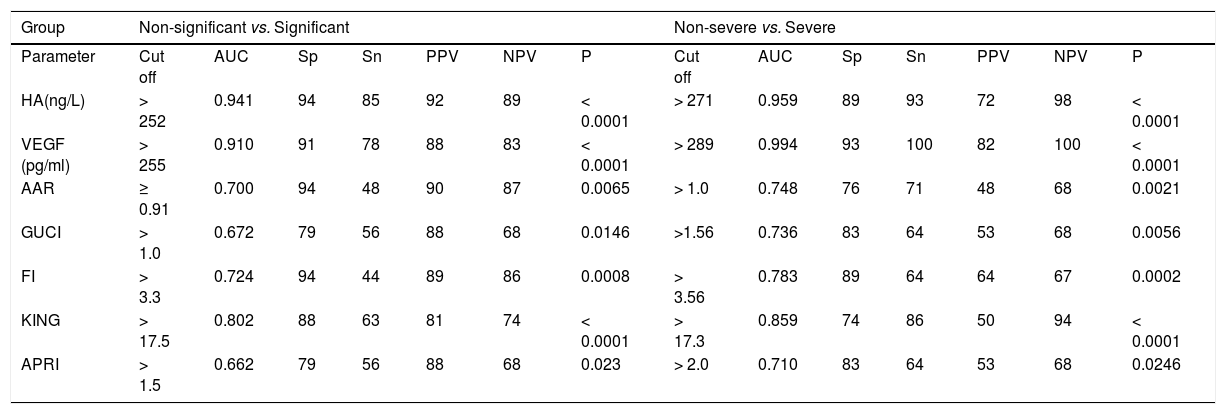
Comparison of the diagnostic values of hyaluronic acid (HA), vascular endothelial growth factor (VEGF) and those of AAR, GUCI, FI, KING and APRI at their original cut-off in staging of liver fibrosis.
| Group | Non-significant vs. Significant | Non-severe vs. Severe | ||||||||||||
|---|---|---|---|---|---|---|---|---|---|---|---|---|---|---|
| Parameter | Cut off | AUC | Sp | Sn | PPV | NPV | P | Cut off | AUC | Sp | Sn | PPV | NPV | P |
| HA(ng/L) | > 252 | 0.941 | 94 | 85 | 92 | 89 | < 0.0001 | > 271 | 0.959 | 89 | 93 | 72 | 98 | < 0.0001 |
| VEGF (pg/ml) | > 255 | 0.910 | 91 | 78 | 88 | 83 | < 0.0001 | > 289 | 0.994 | 93 | 100 | 82 | 100 | < 0.0001 |
| AAR | ≥ 0.91 | 0.700 | 94 | 48 | 90 | 87 | 0.0065 | > 1.0 | 0.748 | 76 | 71 | 48 | 68 | 0.0021 |
| GUCI | > 1.0 | 0.672 | 79 | 56 | 88 | 68 | 0.0146 | >1.56 | 0.736 | 83 | 64 | 53 | 68 | 0.0056 |
| FI | > 3.3 | 0.724 | 94 | 44 | 89 | 86 | 0.0008 | > 3.56 | 0.783 | 89 | 64 | 64 | 67 | 0.0002 |
| KING | > 17.5 | 0.802 | 88 | 63 | 81 | 74 | < 0.0001 | > 17.3 | 0.859 | 74 | 86 | 50 | 94 | < 0.0001 |
| APRI | > 1.5 | 0.662 | 79 | 56 | 88 | 68 | 0.023 | > 2.0 | 0.710 | 83 | 64 | 53 | 68 | 0.0246 |
AUC: Area under the ROC curve: Sp: Specificity. Sn: Sensitivity. PPV: Positive predictive value. NPV: Negative predictive value. P value: P > 0.05 non significant. P < 0.05: Significan. P < 0.001: More significant. P < 0.0001: Extremely significant.
 generated by HA and VEGF: (A,C) for differentiating patients with significant fibrosis (P value: <0.0001, r = 0.768**) and in (B,D) for differentiating patients with severe fibrosis with correlation coefficient (P value = 0.0003, r = 0.826**).")
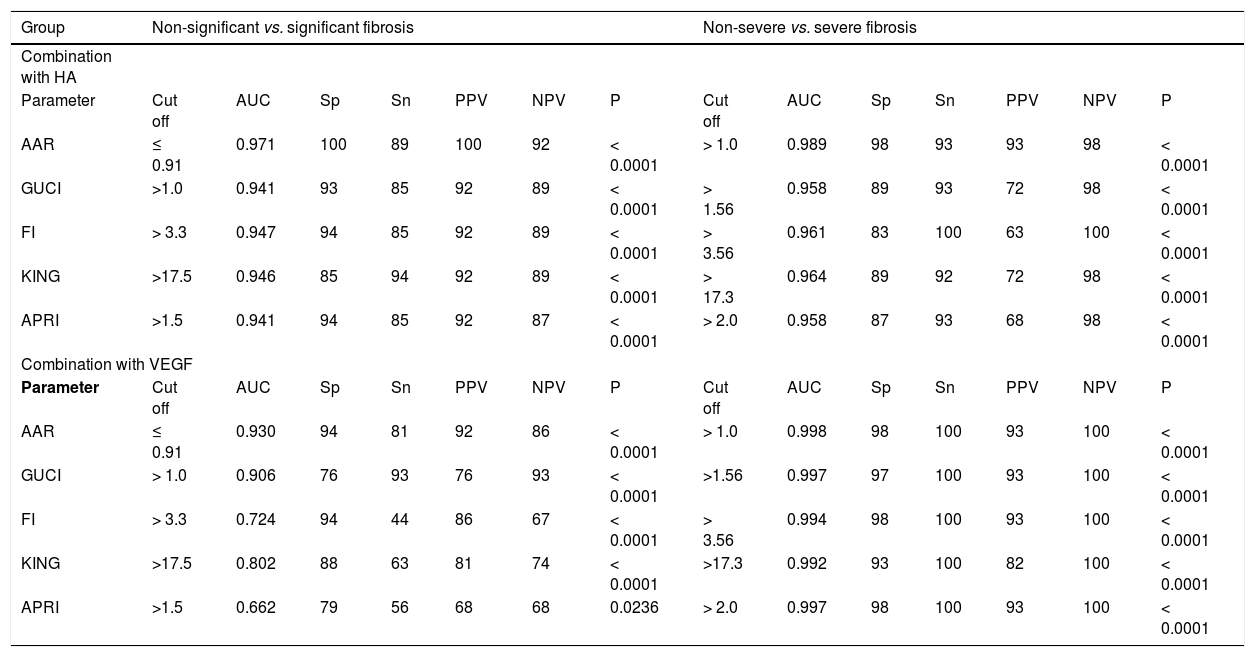
As we expected, the performance characteristics after combining the individual values of HA or VEGF with the numerical values of the previously published 5 noninva-sive scores at their optimal Cut off for the discriminating between significant and non-significant liver fibrosis were enhanced. In addition, the same combination enhanced the discrimination between severe and non-severe liver fibro-sis (Table 3). Therefore, we tested whether the combination between HA and VEGF only would help in discriminating the liver fibrosis stages or not.
Modifications of the diagnostic powers of the selected 8 noninvasive scores after combining the individual results of hyaluronic acid (HA); then vascular endothelial growth factor (VEGF) in discriminating various fibrotic stages.
| Group | Non-significant vs. significant fibrosis | Non-severe vs. severe fibrosis | ||||||||||||
|---|---|---|---|---|---|---|---|---|---|---|---|---|---|---|
| Combination with HA | ||||||||||||||
| Parameter | Cut off | AUC | Sp | Sn | PPV | NPV | P | Cut off | AUC | Sp | Sn | PPV | NPV | P |
| AAR | ≤ 0.91 | 0.971 | 100 | 89 | 100 | 92 | < 0.0001 | > 1.0 | 0.989 | 98 | 93 | 93 | 98 | < 0.0001 |
| GUCI | >1.0 | 0.941 | 93 | 85 | 92 | 89 | < 0.0001 | > 1.56 | 0.958 | 89 | 93 | 72 | 98 | < 0.0001 |
| FI | > 3.3 | 0.947 | 94 | 85 | 92 | 89 | < 0.0001 | > 3.56 | 0.961 | 83 | 100 | 63 | 100 | < 0.0001 |
| KING | >17.5 | 0.946 | 85 | 94 | 92 | 89 | < 0.0001 | > 17.3 | 0.964 | 89 | 92 | 72 | 98 | < 0.0001 |
| APRI | >1.5 | 0.941 | 94 | 85 | 92 | 87 | < 0.0001 | > 2.0 | 0.958 | 87 | 93 | 68 | 98 | < 0.0001 |
| Combination with VEGF | ||||||||||||||
| Parameter | Cut off | AUC | Sp | Sn | PPV | NPV | P | Cut off | AUC | Sp | Sn | PPV | NPV | P |
| AAR | ≤ 0.91 | 0.930 | 94 | 81 | 92 | 86 | < 0.0001 | > 1.0 | 0.998 | 98 | 100 | 93 | 100 | < 0.0001 |
| GUCI | > 1.0 | 0.906 | 76 | 93 | 76 | 93 | < 0.0001 | >1.56 | 0.997 | 97 | 100 | 93 | 100 | < 0.0001 |
| FI | > 3.3 | 0.724 | 94 | 44 | 86 | 67 | < 0.0001 | > 3.56 | 0.994 | 98 | 100 | 93 | 100 | < 0.0001 |
| KING | >17.5 | 0.802 | 88 | 63 | 81 | 74 | < 0.0001 | >17.3 | 0.992 | 93 | 100 | 82 | 100 | < 0.0001 |
| APRI | >1.5 | 0.662 | 79 | 56 | 68 | 68 | 0.0236 | > 2.0 | 0.997 | 98 | 100 | 93 | 100 | < 0.0001 |
AUC: Area under the ROC curve. Sp: Specificity. Sn: Sensitivity. PPV: Positive predictive value. NPV: Negative predictive value. P value: P > 0.05 non significant. P <0.05: Significant. P < 0.001: More significant. P < 0.0001: Extremely significant.
For this reason the individual results of both HA and VEGF were tested for the latter discriminating activity using logistic regression.
By applying such equation on the estimation study, the AUROC of such combination was 0.897 in differentiating patients with significant from non significant fibrosis and was 0.909 in differentiating patients with severe from non severe fibrosis (p < 0.0001, Table 4, Figure 2a,b).
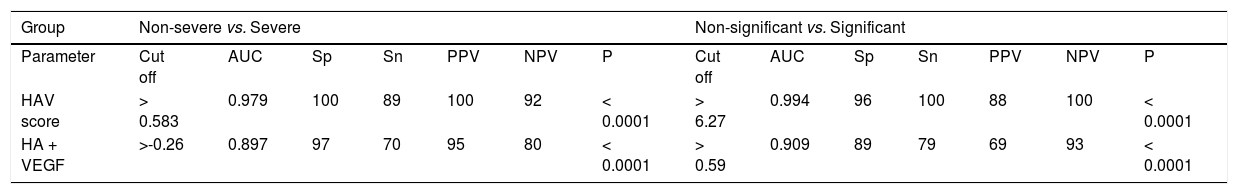
Comparison of the diagnostic values of HA-Vascular score (HAV score) and hyaluronic acid (HA)+ vascular endothelial growth factor (VEGF) in staging of liver fibrosis.
| Group | Non-severe vs. Severe | Non-significant vs. Significant | ||||||||||||
|---|---|---|---|---|---|---|---|---|---|---|---|---|---|---|
| Parameter | Cut off | AUC | Sp | Sn | PPV | NPV | P | Cut off | AUC | Sp | Sn | PPV | NPV | P |
| HAV score | > 0.583 | 0.979 | 100 | 89 | 100 | 92 | < 0.0001 | > 6.27 | 0.994 | 96 | 100 | 88 | 100 | < 0.0001 |
| HA + VEGF | >-0.26 | 0.897 | 97 | 70 | 95 | 80 | < 0.0001 | > 0.59 | 0.909 | 89 | 79 | 69 | 93 | < 0.0001 |
AUC: Area under the ROC curve. Sp: Specificity. Sn: Sensitivity. PPV: Positive predictive value. NPV: Negative predictive value. P value: P > 0.05 non significant. P < 0.05: Significant. P < 0.001: More significant. P < 0.0001: Extremely significant.
 of HA + VEGF for discriminating patients with significant fibrosis; AUC was 0.897 and the best cut-off was at -0.26 (A) and for differentiating patients with severe fibrosis; AUC was 0. 909 and the best cut-off was at -0.59 (B).")
Using logistic regression analyses that combine the bi-omarkers evaluated in our patients to create several predictions for staging liver fibrosis in patients with non-significant fibrosis (F0-F1), the best linear combination of blood markers that were selected by the multivari-ate discriminate analysis for the development of a novel simple noninvasive score was called HA-Vascular score (HAV score) which calculated according to HA vascular (HAV) score = -35.1+ 0.14 (HA) (ng/L) + 0.03 (VEGF) (pg/mL) + (-6.7) (AAR). The score was initially based on HA and VEGF and then on AAR, The first two were direct markers of hepatic fibrosis and the third one was indirect. The HAV score was able to differentiate non-significant fi-brosis from significant one with an AUC of 0.979 and at a cut off > 0.583 (p < 0.0001, Figure 3a), Also, it can differentiate patients with non-severe fibrosis from the severe one with AUC of 0.994 at a cut off > 6.27 (p < 0.0001, Figure 3b and Table 4).
 of HAV score on the basis of the HA, VEGF and AAR for differentiating patients with significant fibrosis (F2-F4; AUC = 0.979 and the best cut-off = 0.583) (A) and for differentiating patients with severe fibrosis (F3-F4; AUC = 0.994 and the best cut-off = 6.27) (B).")
Receiver-operating characteristic curves (ROC) of HAV score on the basis of the HA, VEGF and AAR for differentiating patients with significant fibrosis (F2-F4; AUC = 0.979 and the best cut-off = 0.583) (A) and for differentiating patients with severe fibrosis (F3-F4; AUC = 0.994 and the best cut-off = 6.27) (B).
To evaluate the differential diagnostic power of HAV score, we constructed ROC curves for the developed score. The AUC was 0.979 for differentiating patients with significant liver fibrosis (F2-F4) (Figure 3). An optimal cut-off point of 0.583 was selected on the basis of the ROC curve analysis with a sensitivity of 89% and a specificity of 100%. The PPV was 100 and NPV of 92%. The comparison between our and other 5 scores, showed that the AUC of our method (HAV score) were the best (AUC = 0.979) among others AUCs. This is because the AUC of AAR = 0.700, GUCI = 0.672, FI = 0.724, KING = 0.802 and APRI = 0.662 (Figure 4).
 and comparison with AAR, GUCI, FI, KING and APRI for differentiating patients with (A) significant fibrosis (F2-F4) and for differentiating patients with (B) severe fibrosis (F3-F4), AAR = aspartate aminotransferase (AST/ alanine aminotransferase (ALT); Gotebörg University Cirrhosis Index (GUCI) = normalizedAST x INR x 100/Plt (109/l); King = age x AST (U/l) x INR/Plt (109/l), Fibrosis index (FI) was calculated using this formula as: 8.0-x platelet count (x 109/L) - serum albumin (g/dL), AST: platelets ratio index (APRI) was calculated using Wais formula AST (upper limit of normal)/platelet count (platelets x 109/L) X 100 and HAV score = -35.1 + 0.14 (HA) (ng/L) + 0.03 (VEGF) (pg/mL) + (-6.7) (AAR); ROC, receiver operating characteristic.")
Area under the ROC curve for the hyaluronic acid vascular score (HAV scors) and comparison with AAR, GUCI, FI, KING and APRI for differentiating patients with (A) significant fibrosis (F2-F4) and for differentiating patients with (B) severe fibrosis (F3-F4), AAR = aspartate aminotransferase (AST/ alanine aminotransferase (ALT); Gotebörg University Cirrhosis Index (GUCI) = normalizedAST x INR x 100/Plt (109/l); King = age x AST (U/l) x INR/Plt (109/l), Fibrosis index (FI) was calculated using this formula as: 8.0-x platelet count (x 109/L) - serum albumin (g/dL), AST: platelets ratio index (APRI) was calculated using Wais formula AST (upper limit of normal)/platelet count (platelets x 109/L) X 100 and HAV score = -35.1 + 0.14 (HA) (ng/L) + 0.03 (VEGF) (pg/mL) + (-6.7) (AAR); ROC, receiver operating characteristic.
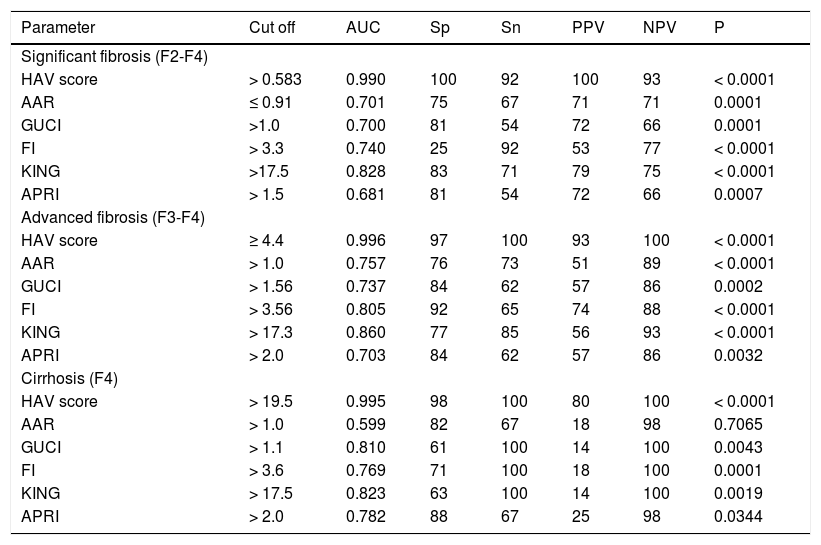
The validation group included 100 HCV patients with matched clinical and pathological investigations as well as the inclusion and exclusion criteria as those for the estimation study. There was no significant difference between the values of the laboratory blood tests in the estimation and in the validation studies. Our validation study only contains the best 5 non invasive scores (AAR, GUCI, FI, KING and APRI). Table 5 illustrates the diagnostic accuracies of HAV score for discriminating significant fibrosis, advanced fibrosis and cirrhosis patients. The HAV score was able to differentiate patients with significant fibrosis (F2-F4) at a cut-off of > 0.583 in the validation group with an AUC of 0.990, PPV of 100%, NPV of 93%, specificity of 100, sensitivity of 92. Also, HAV score produced an AUC of 0.996 with PPV of 93%, NPV of 100%, specificity of 97%, sensitivity of 100% at cutoff point >-4.4 (p < 0.0001) for identify advanced fibrosis. In addition, in cirrhotic; HAV score produced an AUC of 0.995 with PPV of 80%, NPV of 100%, specificity of 98%, sensitivity of 100% and at a cutoff point > 19.5 (P < 0.0001, table 5). Surprisingly, there was no significant difference between the diagnostic performance of HAV in the estimation and in the validation study.
Diagnostic performances of HAV score and the 5 noninvasive scores for predicting the stages of liver fibrosis in chronic hepatitis C genotype 4 patients in the validation study.
| Parameter | Cut off | AUC | Sp | Sn | PPV | NPV | P |
|---|---|---|---|---|---|---|---|
| Significant fibrosis (F2-F4) | |||||||
| HAV score | > 0.583 | 0.990 | 100 | 92 | 100 | 93 | < 0.0001 |
| AAR | ≤ 0.91 | 0.701 | 75 | 67 | 71 | 71 | 0.0001 |
| GUCI | >1.0 | 0.700 | 81 | 54 | 72 | 66 | 0.0001 |
| FI | > 3.3 | 0.740 | 25 | 92 | 53 | 77 | < 0.0001 |
| KING | >17.5 | 0.828 | 83 | 71 | 79 | 75 | < 0.0001 |
| APRI | > 1.5 | 0.681 | 81 | 54 | 72 | 66 | 0.0007 |
| Advanced fibrosis (F3-F4) | |||||||
| HAV score | ≥ 4.4 | 0.996 | 97 | 100 | 93 | 100 | < 0.0001 |
| AAR | > 1.0 | 0.757 | 76 | 73 | 51 | 89 | < 0.0001 |
| GUCI | > 1.56 | 0.737 | 84 | 62 | 57 | 86 | 0.0002 |
| FI | > 3.56 | 0.805 | 92 | 65 | 74 | 88 | < 0.0001 |
| KING | > 17.3 | 0.860 | 77 | 85 | 56 | 93 | < 0.0001 |
| APRI | > 2.0 | 0.703 | 84 | 62 | 57 | 86 | 0.0032 |
| Cirrhosis (F4) | |||||||
| HAV score | > 19.5 | 0.995 | 98 | 100 | 80 | 100 | < 0.0001 |
| AAR | > 1.0 | 0.599 | 82 | 67 | 18 | 98 | 0.7065 |
| GUCI | > 1.1 | 0.810 | 61 | 100 | 14 | 100 | 0.0043 |
| FI | > 3.6 | 0.769 | 71 | 100 | 18 | 100 | 0.0001 |
| KING | > 17.5 | 0.823 | 63 | 100 | 14 | 100 | 0.0019 |
| APRI | > 2.0 | 0.782 | 88 | 67 | 25 | 98 | 0.0344 |
AUC: Area under the ROC curve. Sp: Specificity. Sn: Sensitivity. PPV: Positive predictive value. NPV: Negative predictive value. P value: P > 0.05 non significant. P < 0.05: Significant P < 0.001: More significant. P < 0.0001: Extremely significant.
Hepatitis C virus (HCV) is a hepatotropic virus has no symptoms in the initial infection. Therefore, most patients don’t know about their illness till end stage.28 Also, this virus can damage the liver and cause accumulation of components of ECM that can either lead to reversible liver fibrosis or irreversible cirrhosis.29 The latter's, can distort the hepatic architecture and form capillarization.30 Therefore, effective HCV screening, early diagnosis and hepatic fibrosis staging are highly relevant for controlling transmission, treating infected patients and, consequently, avoiding end-stage liver disease.31
Development of liver fibrosis is characterized by the excess deposition of several components of ECM), including various types of collagens, proteoglycans, structural glycoproteins and HA. This excess of organized ECM in the space of Disse (perisinusoidal fibrosis) causes a reduced blood flow through the organ and strangulates the near hepatocytes, influencing the clearance ability of all liver cells.32 This process extends to distort the hepatic architecture by forming a fibrous scar and developing nodules of regenerating hepatocytes that produces hepatocellular dysfunction and increase the intrahepatic resistance to blood flow.30
Liver sinusoidal endothelium (LSE) is crucial for normal liver physiology. Cirrhotic livers are characterized by sinusoidal endothelial dysfunction and transformation of LSE into what is called SECs capillarization. Under these conditions, the normal fenestrae were lost. Thence, the disease is progressed and hypoxia was developed.33 This mechanism requires the participation of pro-inflammatory cytokines and growth factors;34 including VEGF. This is already the case in the present study. This is because the increase in serum HA levels reflect SECs capillarization.35 Also, the levels of VEGF, which promote and regulate en-dothelial cell proliferation and migration, matrix remodeling, recruitment of pericytes and neovessels stabilization, were increased with increase in the severity of the dis-ease.36 A general talk is that, the excessive increase in ECM components production; including HA, together with the reduction in ECM turnover characterizes liver fibrosis and estimate liver angiogenesis; including VEGF.
Angiogenesis is the formation of new vascular structures from preexisting vessels37 which is essential process for organ growth and repair during and after hepatic disor-ders.38 Chronic HCV infection is one of the main causes for development of hepatic angiogenesis.21 The imbalance between hepatic fibrogenesis and angiogenesis can lead to several diseases including malignancy.39
HA is an essential component of ECM40 which contributes significantly to cell proliferation and migration.41 HA seems to be prognosticator of fibrosis and reflects sinusoidal endothelial cells (SECs) capillarization. This is because it is detected in early stage of liver fibrosis.42 Also, VEGF is a glycosylated peptide which induces endothelial proliferation and angiogenesis via increasing vascular permeability through disorganization of endothelial junction-al proteins which is a highly specific factor for endothelial cells43 and it is a promoter of fibrogenesis but its actual role in fibrogenesis isn’t identified until now.
HA act as a promoter of angiogenesis during tissue damage due to its enhancement of the endothelial cell tube formation and its ability to induce the expression of ang-iogenic factors, such as ICAM-1, VCAM-1 and MMP-2. Therefore, one can it could be suggested that both HA and VEGF act as fibrotic and angiogenic factors.44
Liver fibrosis is considered a common target of clinical trials in chronic hepatitis C (CHC) patients. Therefore, its evaluation can yield considerable data and it can be very useful for the diagnosis and prognosis of the disease, and for follow-up of the natural history or progress under therapy. Up till now, the invasive liver biopsy which causes pain, hemorrhage, errors in small samples, can’t be repeated and other complications is considered the golden standard test for the evaluation of fibrosis.15 Therefore, serum HA and VEGF can be used to assess hepatic fibrosis in Egyptian patient's which suffer from chronic HCV genotype 4 infection. AAR is considered a surrogate marker of liver fibrosis, with values greater than one being suggestive of cirrhosis. That is may be because of due to the increased release of cellular AST, the decreased clearance of AST, and/or impaired ALT synthesis in the late stages of liver disease.
HA was able to differentiate non-significant from those with significant fibrosis with specificity, sensitivity, PPV, NPV and AUC of 94, 85, 92, 89 and 0.941, respectively. The latter parameters were 89, 93, 72, 98 and 0.959, respectively when the results of HA in severe were compared with those of the non-severe fibrosis. In addition VEGF has specificity, sensitivity, PPV, NPV and AUC of 91, 78, 88, 83 and 0.911, respectively when the results of VEGF in patients with non-significant fibrosis were compared with those with significant one. The latter parameters of diagnostic power were 93, 100, 82, 100 and 0.994, respectively, when the results of VEGF in patients with severe fibrosis were compared with those with non-severe fibrosis (Tables 2 and figure 1, p < 0.0001).The elevated diagnostic powers implicate the involvement of HA or VEGF or both in the mechanisms of hepatic fibrogenesis. The latter involvement is not only based on the increase in the deposition of HA in hepatic fibrosis and/or cirrhosis but also on the major role of HA in cell regulation, proliferation and migration. In addition, the growing HA molecule translocates extracellularly through the membrane that increased vascular permeability.45 Therefore, HA is not just acting as a driving factor of fibrosis but also as a passive player for TGF-β to exert its profibrotic effects.40
Due to the complications of liver biopsy for liver staging in HCV patients, all researchers try to find easy, quick, inexpensive and available scores that should be reproducible. Therefore, HA or VEGF were combined with the numerical values of 5 published non-invasive scores and the parameters of the new diagnostic powers were investigated again. Surprisingly, the diagnostic powers of the 8 scores were significantly enhanced after the addition. One example is that the AUC of GUCI was 0.672, 0.736 but became 0.941 and 0.958 after addition of HA and 0.906 and 0.997 after addition of VEGF in discriminating patients with significant from those with non- significant and those with non-severe from those with severe liver fibro-sis, respectively (Table 3).
The latter amplifications of the diagnostic powers encourage us to test the possible enhancement in the parameters of diagnostic powers or AUCs after addition of the results of HA to those of VEGF. After addition, the AUC was 0.897 for differentiating non- significant from those with significant fibrosis and was 0.996 for differentiating non severe from those with severe fibrosis confirming the major role of the direct fibrosis markers in the assessment of hepatic disorders.
As before, the role of indirect markers in the assessment of the latter disorders must be kept in our mind. Therefore, the individual results of albumin, ALT, AST or AAR were tested for their abilities to enhance the diagnostic power of the direct markers or not. After testing, AAR was found to add more to the parameters of the diagnostic powers of both HA and VEGF. Thus, the results of AAR were implicated in the construction of the predicting score named HA-Vascular score (HAV score) which was, therefore, consisted of HA, VEGF and AAR (Figure 5).

In the estimation study, HAV score could differentiate non-significant fibrosis from those with significant fibro-sis with specificity, sensitivity, PPV, NPV and AUC of 100, 89, 100, 92 and 0.979, respectively. The latter parameters were 96, 100, 88, 100 and 0.994, respectively when the results of HAV score in severe were compared with those of non-severe fibrosis (Table 4).
In addition, when the results of the diagnostic powers of the latter non-invasive indirect markers were compared with those of HAV score, the statistical results showed that those of HAV score were the best in diagnosing the stages of hepatic fibrosis.
Surprisingly, in the validation study HAV score showed high diagnostic performances in differentiating significant, advanced and cirrhosis with specificity, sensitivity, PPV, NPV and AUC of 100,92,100,93 and 0.996; 97,100,93,100 and 0.995 and 98,100,80,100 and 0.995, respectively (Table 5 ).
Moreover, the diagnostic powers of other published 5 noninvasive scores, as was originally reported, were lower than those of the candidate HAV score. This study is useful for staging liver fibrosis. In conclusion, HAV score may add more to the reduction of liver biopsy and may be of value in diagnosis of liver malfunction in the future; especially in cirrhotic patients, which is actually the aim of the present study.


