


Introduction. Lower 25-hydroxyvitamin D [25(OH)D] levels have been observed in cirrhotic patients and have been related to disease severity. However, most previous studies included patients with very advanced disease, lacking an adequate control for other variables that could interfere with vitamin D levels. We sought to investigate the prevalence of hypovitaminosis D and the factors related to its occurrence.
Material and methods. This cross-sectional study included 133 cirrhotic patients and 30 healthy controls. Bivariate and multivariate analyses were performed to determine factors associated with 25(OH)D levels below the lower tertile. Thirty patients who had been recently hospitalized were compared in two time points.
Results. Mean 25(OH)D levels were 32.34 ± 11.38 in controls and 27.03 ± 6.22 ng/mL in patients (P = 0.018). 25(OH)D levels were < 30 ng/mL in 69.9% and < 20 ng/mL in 14.3% of the sample. Levels of 25(OH)D below the lower tertile (< 24 ng/mL) were independently associated with higher triceps skinfold and non-Caucasian race. Parathyroid hormone above the reference value (65 pg/mL) was found in 24.6% of patients without association with 25(OH)D or severity of liver disease. Significantly lower levels of 25(OH)D were found at the time of acute decompensation of cirrhosis.
Conclusions. In conclusion, hypovitaminosis D was prevalent in cirrhotics and it was associated with adiposity and non-Caucasian race in stable patients with relatively well preserved liver function. However, significantly lower levels were observed during admission for acute decompensation suggesting an impact of systemic inflammation or liver dysfunction on 25(OH)D levels.
Liver cirrhosis is one of the ten main causes of mortality in the western world and it is responsible for significant functional disability and increased health expenses.1 Histologically, cirrhosis represents the last stage of liver fibrosis, leading to the distortion of the hepatic architecture and development of regenerative nodules.2 Alcohol consumption and chronic viral hepatitis are the most common etiologies of cirrhosis; nonetheless, non-alcoholic fatty liver disease is emerging as an increasingly important cause, especially in developed countries.3
The progressive deterioration of liver function observed in patients with chronic liver diseases is associated with several complications such as ascites, digestive bleeding, hepatic encephalopathy and increased risk of bacterial infections.2 Despite the high risk of bone loss and the unquestionable relevance of hepatic osteodystrophy as an extrahepatic manifestation of advanced cirrhosis, the clinical significance of parathyroid hormone(PTH)-vitamin D axis disturbances in chronic liver diseases remains uncertain.4 It is known that vitamin D from the skin or food is biologically inactive and needs to be hydroxylated in the liver to 25-hydroxyvitamin D [25(OH)D], its major circulating form.5,6 Subsequently, 25(OH)D is converted in the kidneys to the active form, 1.25-dihydroxyvitamin D.5,6 Furthermore, the liver is responsible for producing the bile salts involved in the absorption of dietary vitamin D.7 Hence, liver function seems to be essential for the maintenance of 25(OH)D levels.
Vitamin D deficiency secondary to liver disease was once considered to occur exclusively in chronic cholestatic conditions. However, recent studies have demonstrated a high prevalence of vitamin D deficiency in patients with liver cirrhosis, regardless of the etiology.8 Several factors could explain this finding, including:
- •
Lower exposure to vitamin D sources (e.g., dietary, exposure to sunlight).
- •
Reduced intestinal absorption of vitamin D.
- •
Decreased liver production of albumin and vitamin D binding protein.
- •
Decreased hepatic hydroxylation of vitamin D to 25(OH)D, and
- •
Increased catabolism and removal of 25(OH)D.
Besides its high prevalence, vitamin D deficiency in cirrhotic patients was associated with more advanced liver disease and higher mortality.9–11 However, these results have not been reproduced by all researchers. In addition, the majority of the studies that investigated the factors associated with lower vitamin D levels in patients with chronic liver diseases had included a large proportion of individuals with very advanced liver disease, in whom several factors may have influenced 25(OH)D levels.8 Likewise, the impact of other variables on the vitamin D levels in cirrhotic patients, especially anthropometric and nutritional parameters, has not been studied yet.
Our aim was to investigate vitamin D status and the calcium-PTH-vitamin D axis among outpatients with liver cirrhosis, evaluating the relationship between 25(OH)D levels and clinical, laboratory, and nutritional parameters. Additionally, a subgroup of patients recently hospitalized was assessed at two different moments to study the impact of acute decompensation of cirrhosis on 25(OH)D levels.
Material and MethodsPatientsCross-sectional study that included consecutive adult subjects (≥ 18 years of age) attending the outpatient clinic at the University Hospital of the Federal University of Santa Catarina. All patients were evaluated from June to October 2012. The diagnosis of cirrhosis was established either histologically (when available) or by the combination of clinical, imaging and laboratory findings in patients with evidence of portal hypertension. Patients in the following situations were excluded: supplementation of vitamin D; diagnosis of hepatocellular carcinoma; interferon-based therapy over the last 30 days; refusal or inability of the patient to understand the terms of the informed consent. Among the included patients, those who had been hospitalized in the last six months for acute decompensation of cirrhosis were compared on both moments (in- and outpatient evaluation) regarding clinical and laboratory variables. A control group composed of 30 unmatched subjects (mean age 41.8 ± 15.4 years, 21.4% males) evaluated during routine laboratory check-up tests was also included for comparison of 25(OH)D levels.
The study protocol conformed to the ethical guidelines of the 1975 Helsinki Declaration and was approved by our institutional review board.
MethodsPatients were evaluated at the outpatient clinic of the Gastroenterology Division and the following clinical variables were collected: age, gender, race, smoking history, etiology of cirrhosis, history of previous decompensation and hospitalization, previous diagnosis of diabetes mellitus and systemic arterial hypertension, diagnosis of esophageal varices, presence of ascites, encephalopathy and peripheral edema. Current significant alcohol intake was defined as an average overall consumption of 21 drinks per week or more for men and 14 drinks per week or more for women during the 4 weeks before enrolment (one standard drink is equal to 12 g absolute alcohol). The same criterion was used to define previous alcohol abuse, considering the habitual alcohol consumption pattern before the last four weeks.12 Subjects of the control group were evaluated while waiting for blood collection in the central laboratory.
All subjects underwent laboratory evaluation at the same day of the clinical evaluation and the following tests were performed for this study: creatinine, albumin, total bilirubin, international normalized ratio (INR), total calcium, phosphorus, C-reactive protein (CRP). Corrected calcium was calculated from the following formula:13
Corrected calcium (mg/dL) = measured total calcium (mg/dL) + 0.8 x [4.0 - serum albumin (mg/dL)]
Normal reference range = 8.5 to 10.2 mg/dL.
Glomerular filtration rate (GFR) was estimated according to the Cockcroft-Gault equation.14
Child-Pugh classification15 and the MELD (Model for End-Stage Liver Disease) score16 were used to assess the severity of the hepatic disease. Liver cirrhosis was also categorized in five stages according to the D’Amico’s classification:17
- 1.
Absence of esophageal varices.
- 2.
Presence of varices, without decompensation.
- 3.
History of variceal bleeding.
- 4.
Current or previous ascites.
- 5.
History of ascites and bleeding varices.
All patients were submitted to a general nutritional assessment procedure which was proposed and validated for use in cirrhotic patients (Royal Free Hospital Global Assessment - RFH-GA).18 This evaluation includes the following parameters: body mass index (BMI) based on estimated dry weight; mid-arm muscle circumference (MAMC); estimated daily caloric intake and clinical data (gastrointestinal symptoms, recent history of infections, renal failure, hepatic encephalopathy, gastrointestinal bleeding, weight variation, physical activity and fatigue). According to the proposed algorithm, patients are divided into well nourished, mildly/ moderately malnourished and severely malnourished. The MAMC measurements were expressed in relation to the 5th percentile for age and gender.19 The triceps skinfold thickness (TSF) was measured with a Lange Skinfold Caliper as an estimate of fat mass and it was expressed in millimeters (mm).
Determination of 25(OH)D and intact parathyroid hormone (PTH) levelsThe 25(OH)D and PTH serum levels were measured in samples collected after clinical evaluation and stored at -80 °C Serum 25(OH)D concentrations were measured by chemiluminescent microparticle immunoassay, ARCHITECT™ 25-oh vitamin assay (Abbott Laboratories, Abbott Park, Illinois-USA). The analytical sensitivity of the method ranges from 0 to 160 ng/mL. Although the American Society of Endocrinology defines vitamin D insufficiency as levels between 20 and 30 ng/mL and deficiency as levels below 20 ng/mL,5 there is significant variation across the studies. Therefore, in the present study, the sample was divided into tertiles according to 25(OH)D levels, and factors associated with values bellow the lower tertile were investigated.
Serum concentrations of intact PTH were measured by chemiluminescence immunoassay, Immulite™ 2000 (Siemens Medical Solutions Diagnostic, Los Angeles, California - USA), with an analytical sensitivity from 3 to 500,000 pg/mL and upper reference value of 65 pg/mL.
Statistical analysisThe normality of the variable distribution was determined by One-Sample Kolmogorov-Smirnov test. The correlation between the numerical variables was evaluated by the Spearman’s correlation coefficient. Continuous variables were compared using Student’s t test in the case of normal distribution or Mann-Whitney test in the remaining cases. Categorical variables were evaluated by chi-square test. Variables with P < 0.100 were included in a multiple logistic regression analysis in order to investigate factors independently associated to 25(OH)D levels below the lower tertile. The comparison of PTH levels across the tertiles of 25(OH) D was performed by ANOVA. Paired samples t-test or Wilcoxon signed rank-test were used for comparing variables in two time points (hospitalization and outpatient assessment). A P value of less than 0.05 was considered statistically significant. All tests were two-tailed and were performed by the SPSS software, version 17.0 (SPSS, Chicago, IL, USA).
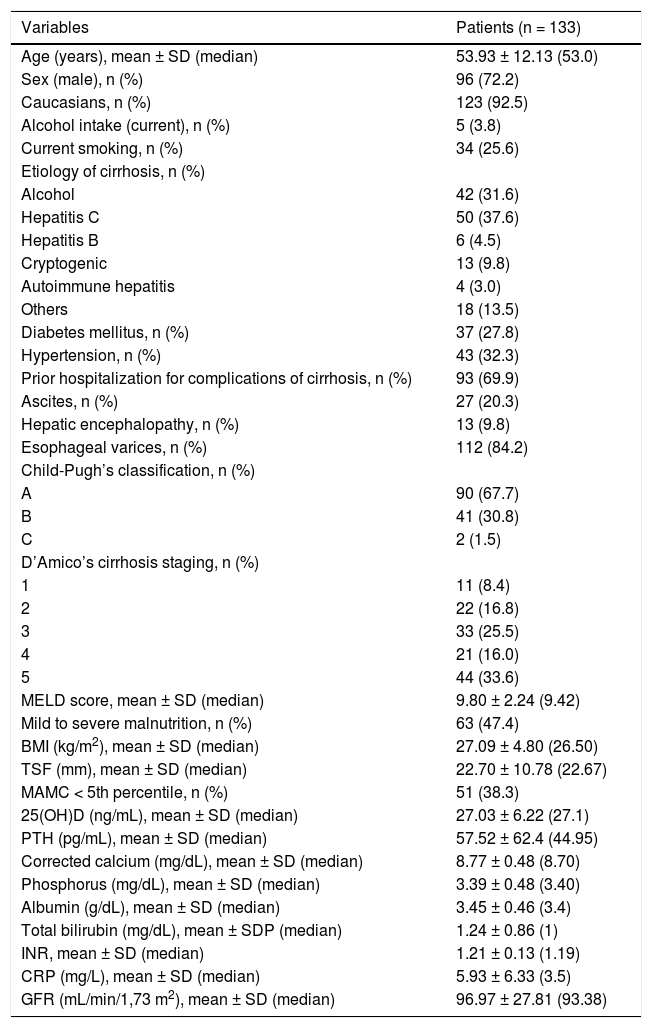
ResultsCharacteristics of the patientsDuring the study period, 133 patients eligible for participation were evaluated. Characteristics of the studied sample are summarized in table 1. The mean age was of 53.9 ± 12.1 years, there was predominance of the male gender (72.2%) and of the white skin color (92.5%). Current alcohol intake and smoking were reported by 3.8 and 25.6% of the patients, respectively. The main causes of liver cirrhosis were chronic viral hepatitis (HBV infection in 4.5% and HCV in 37.6%) and alcohol abuse (31.6%). Only five individuals (3.8%) presented with diagnosis of chronic cholestatic diseases (primary biliary cirrhosis in three cases, primary sclerosing cholangitis and idiopathic adulthood ductopenia in the others).
Characteristics of included patients.
| Variables | Patients (n = 133) |
|---|---|
| Age (years), mean ± SD (median) | 53.93 ± 12.13 (53.0) |
| Sex (male), n (%) | 96 (72.2) |
| Caucasians, n (%) | 123 (92.5) |
| Alcohol intake (current), n (%) | 5 (3.8) |
| Current smoking, n (%) | 34 (25.6) |
| Etiology of cirrhosis, n (%) | |
| Alcohol | 42 (31.6) |
| Hepatitis C | 50 (37.6) |
| Hepatitis B | 6 (4.5) |
| Cryptogenic | 13 (9.8) |
| Autoimmune hepatitis | 4 (3.0) |
| Others | 18 (13.5) |
| Diabetes mellitus, n (%) | 37 (27.8) |
| Hypertension, n (%) | 43 (32.3) |
| Prior hospitalization for complications of cirrhosis, n (%) | 93 (69.9) |
| Ascites, n (%) | 27 (20.3) |
| Hepatic encephalopathy, n (%) | 13 (9.8) |
| Esophageal varices, n (%) | 112 (84.2) |
| Child-Pugh’s classification, n (%) | |
| A | 90 (67.7) |
| B | 41 (30.8) |
| C | 2 (1.5) |
| D’Amico’s cirrhosis staging, n (%) | |
| 1 | 11 (8.4) |
| 2 | 22 (16.8) |
| 3 | 33 (25.5) |
| 4 | 21 (16.0) |
| 5 | 44 (33.6) |
| MELD score, mean ± SD (median) | 9.80 ± 2.24 (9.42) |
| Mild to severe malnutrition, n (%) | 63 (47.4) |
| BMI (kg/m2), mean ± SD (median) | 27.09 ± 4.80 (26.50) |
| TSF (mm), mean ± SD (median) | 22.70 ± 10.78 (22.67) |
| MAMC < 5th percentile, n (%) | 51 (38.3) |
| 25(OH)D (ng/mL), mean ± SD (median) | 27.03 ± 6.22 (27.1) |
| PTH (pg/mL), mean ± SD (median) | 57.52 ± 62.4 (44.95) |
| Corrected calcium (mg/dL), mean ± SD (median) | 8.77 ± 0.48 (8.70) |
| Phosphorus (mg/dL), mean ± SD (median) | 3.39 ± 0.48 (3.40) |
| Albumin (g/dL), mean ± SD (median) | 3.45 ± 0.46 (3.4) |
| Total bilirubin (mg/dL), mean ± SDP (median) | 1.24 ± 0.86 (1) |
| INR, mean ± SD (median) | 1.21 ± 0.13 (1.19) |
| CRP (mg/L), mean ± SD (median) | 5.93 ± 6.33 (3.5) |
| GFR (mL/min/1,73 m2), mean ± SD (median) | 96.97 ± 27.81 (93.38) |
SD: standard deviation. MELD: Model for End-Stage Liver Disease. BMI: body mass index based on estimated dry weight. TSF: triceps skin-fold thickness. MAMC: mid-arm muscle circumference. 25(OH)D: 25-hydroxyvitamin D. PTH: intact parathyroid hormone. INR: international normalized ratio. TB: total bilirubin. CRP: C-reactive protein. GFR: estimated glomerular filtration rate.
At the time of evaluation, 20.3% of the patients presented ascites and 9.8% hepatic encephalopathy. Endoscopic diagnosis of esophageal varices was observed in 84.2% of the subjects. When evaluated according to the Child-Pugh classification, 67.7% were classified as class A, 30.8% class B, and 1.5% class C. The mean MELD score was 9.80 ± 2.24 (median 9.42). Previous decompensation of liver disease (D’Amico’s stages 3, 4 or 5) was observed in 75.1% of the sample.
According to the RFH-GA, malnutrition was present in 47.4% of the patients. The mean BMI was 27.09 ± 4.80 kg/m2 (median of 26.50 kg/m2) and the mean TSF was 22.70 ± 10.78 mm (median of 22.67 mm). MAMC below the 5th percentile of standard values was noted in 38.3% of the sample.
Factors associated with lower 25(OH)D levelsThe mean 25(OH)D levels were 32.34 ± 11.38 in the control group and 27.03 ± 6.22 ng/mL in patients with cirrhosis (P = 0.018). Levels of 25(OH)D lower than 30 ng/mL were found in 93 patients (69.9%) and 19 patients (14.3%) presented levels lower than 20 ng/mL. The sample was divided into tertiles according to 25(OH)D concentrations, and 42 individuals exhibited levels below the lower tertile (24 ng/mL).
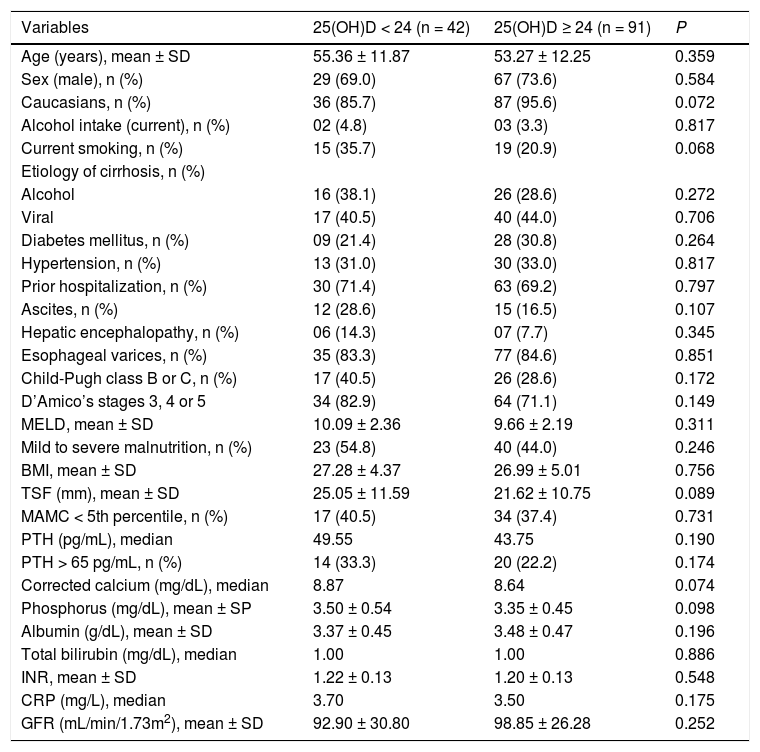
Table 2 shows the bivariate analysis of the factors associated with 25(OH)D levels below the lower tertile. There were no statistically significantly associations between the studied variables and lower 25(OH)D levels. However, there was a trend towards lower proportion of Caucasians (85.7 vs. 95.6%, P = 0.072), higher proportion of currently smoking (35.7 vs. 20.9%, P = 0.068), greater TSF (25.05 ± 11.59 mm vs. 21.62 ± 10.75 mm, P = 0.089), higher phosphorus levels (3.50 ± 0.54 mg/dL vs. 3.35 ± 0.45 mg/dL, P = 0.098) and higher median of corrected calcium levels (8.87 mg/dL vs. 8.64 mg/dL, P = 0.074).
Bivariate analysis of factors associated with 25(OH)D levels below the lower tertile (< 24 ng/mL).
| Variables | 25(OH)D < 24 (n = 42) | 25(OH)D ≥ 24 (n = 91) | P |
|---|---|---|---|
| Age (years), mean ± SD | 55.36 ± 11.87 | 53.27 ± 12.25 | 0.359 |
| Sex (male), n (%) | 29 (69.0) | 67 (73.6) | 0.584 |
| Caucasians, n (%) | 36 (85.7) | 87 (95.6) | 0.072 |
| Alcohol intake (current), n (%) | 02 (4.8) | 03 (3.3) | 0.817 |
| Current smoking, n (%) | 15 (35.7) | 19 (20.9) | 0.068 |
| Etiology of cirrhosis, n (%) | |||
| Alcohol | 16 (38.1) | 26 (28.6) | 0.272 |
| Viral | 17 (40.5) | 40 (44.0) | 0.706 |
| Diabetes mellitus, n (%) | 09 (21.4) | 28 (30.8) | 0.264 |
| Hypertension, n (%) | 13 (31.0) | 30 (33.0) | 0.817 |
| Prior hospitalization, n (%) | 30 (71.4) | 63 (69.2) | 0.797 |
| Ascites, n (%) | 12 (28.6) | 15 (16.5) | 0.107 |
| Hepatic encephalopathy, n (%) | 06 (14.3) | 07 (7.7) | 0.345 |
| Esophageal varices, n (%) | 35 (83.3) | 77 (84.6) | 0.851 |
| Child-Pugh class B or C, n (%) | 17 (40.5) | 26 (28.6) | 0.172 |
| D’Amico’s stages 3, 4 or 5 | 34 (82.9) | 64 (71.1) | 0.149 |
| MELD, mean ± SD | 10.09 ± 2.36 | 9.66 ± 2.19 | 0.311 |
| Mild to severe malnutrition, n (%) | 23 (54.8) | 40 (44.0) | 0.246 |
| BMI, mean ± SD | 27.28 ± 4.37 | 26.99 ± 5.01 | 0.756 |
| TSF (mm), mean ± SD | 25.05 ± 11.59 | 21.62 ± 10.75 | 0.089 |
| MAMC < 5th percentile, n (%) | 17 (40.5) | 34 (37.4) | 0.731 |
| PTH (pg/mL), median | 49.55 | 43.75 | 0.190 |
| PTH > 65 pg/mL, n (%) | 14 (33.3) | 20 (22.2) | 0.174 |
| Corrected calcium (mg/dL), median | 8.87 | 8.64 | 0.074 |
| Phosphorus (mg/dL), mean ± SP | 3.50 ± 0.54 | 3.35 ± 0.45 | 0.098 |
| Albumin (g/dL), mean ± SD | 3.37 ± 0.45 | 3.48 ± 0.47 | 0.196 |
| Total bilirubin (mg/dL), median | 1.00 | 1.00 | 0.886 |
| INR, mean ± SD | 1.22 ± 0.13 | 1.20 ± 0.13 | 0.548 |
| CRP (mg/L), median | 3.70 | 3.50 | 0.175 |
| GFR (mL/min/1.73m2), mean ± SD | 92.90 ± 30.80 | 98.85 ± 26.28 | 0.252 |
25(OH)D: 25-hydroxyvitamin D. SD: standard deviation. MELD: Model for End-Stage Liver Disease. BMI: body mass index based on estimated dry weight. TSF: triceps skin-fold thickness. MAMC: mid-arm muscle circumference. PTH: intact parathyroid hormone. TB: total bilirubin. INR: international normalized ratio. CRP: C-reactive protein. GFR: estimated glomerular filtration rate.
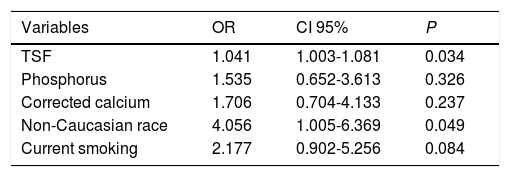
Variables with P < 0.100 in the bivariate analysis were included in the multiple logistic regression analysis (Table 3). Levels of 25(OH)D below the lower tertile were independently associated with greater TSF (OR 1.041, IC95% 1.003-1.081, P = 0.034) and non-Caucasian race (4.056, IC95% 1.005-16.369, P = 0.049).
Multiple logistic regression analysis of factors associated with 25(OH)D levels below the lower tertile (variables with P < 0.100 in bivariate analysis).
| Variables | OR | CI 95% | P |
|---|---|---|---|
| TSF | 1.041 | 1.003-1.081 | 0.034 |
| Phosphorus | 1.535 | 0.652-3.613 | 0.326 |
| Corrected calcium | 1.706 | 0.704-4.133 | 0.237 |
| Non-Caucasian race | 4.056 | 1.005-6.369 | 0.049 |
| Current smoking | 2.177 | 0.902-5.256 | 0.084 |
25(OH)D: 25-hydroxyvitamin D. OR: odds ratio. CI: confidence interval. TSF: triceps skin-fold thickness.
PTH levels above the reference value (65 pg/mL) were found in 24.6% of the patients (25.3% among Child-Pugh A and 23.3% among Child-Pugh B/C subjects, P = 0.800). There was no correlation between the PTH and 25(OH)D (P = 0.193). A small positive correlation was observed between PTH levels and age (r = 0.184; P = 0.036) and creatinine levels (r = 0.191; P = 0.029). There were no associations with the other studied variables (data not shown).
Among those with 25(OH)D levels lower than 24 ng/dL, 31.7% showed high PTH (> 65 pg/mL). Individuals with a combination of 25(OH)D lower than 24 ng/dL and PTH higher than 65 pg/mL showed no differences when compared to the remaining subjects regarding the study variables.
Corrected calcium below 8.5 mg/dL was observed in 41 patients and, among these, PTH levels were elevated in only 11 subjects. Hypocalcemia with high PTH was not associated with severity of the liver disease, 25(OH)D levels, variables related to the nutritional status or other laboratory variables (data not shown). Only one patient presented hypercalcemia (corrected calcium higher than 10.2 mg/dL), with 25(OH)D of 19.8 ng/dL and normal PTH.
Levels of 25(OH)D during hospitalization for acute decompensation of cirrhosisThirty patients that had been included in the above analysis were previously hospitalized for acute decompensation of cirrhosis and had samples for 25(OH)D measurements collected in the first 48 h of hospitalization. The median interval between the hospitalization and outpatient assessment was of 105 days. During their hospital stay, 3 patients were classified as Child-Pugh A, 19 as B and 8 as C. Upper gastrointestinal bleeding was present on admission in 26 patients, hepatic encephalopathy in 16 and ascites in 11 cases. Bacterial infections were diagnosed at hospitalization in four patients. As compared to outpatient assessment, significantly lower 25(OH)D levels were observed at admission (22.90 ± 9.53 ng/mL vs. 29.46 ± 7.06 ng/mL, P < 0.001) (Figure 1). Likewise, lower 25(OH)D levels at hospitalization were noticed in 26 out of 30 patients included in this analysis (87%). Admission for acute decompensation of liver disease was also associated with higher MELD (13.65 ± 3.29 vs. 10.84 ± 2.39, P < 0.001), INR (1.45 ± 0.25 vs. 1.27 ± 0.15, P < 0.001), total bilirubin (1.85 ± 1.34 mg/dL vs. 1.33 ± 0.84 mg/dL, P = 0.015), CRP median (6.78 mg/L vs. 3.50 mg/L, P = 0.009) and lower albumin (2.69 ± 0.52 g/dL vs. 3.26 ± 0.43 g/dL, P < 0.001). There were no significant differences in 25(OH)D levels when Child-Pugh C patients were compared the remaining subjects (P = 0.243). Levels of 25(OH)D during acute decompensation were also not associated with other laboratory variables related to hepatic dysfunction (MELD, INR, albumin and total bilirubin), with CRP or with the estimated GFR.
DiscussionD for 30 patients with cirrhosis in two different moments. As compared to outpatient assessment, significantly lower 25(OH)D levels were observed at admission for acute decompensation of cirrhosis (P < 0.001).")
The main currently known physiological functions of vitamin D are the increase of intestinal calcium absorption and the stimulation of calcium transport from bones and kidneys to the circulation. Thus, vitamin D deficiency affects bone development, leading to rickets in children (or osteomalacia in adults) and to an increased risk of osteoporosis.20 Recently, the extraskeletal effects of vitamin D have been brought to attention. Vitamin D deficiency has been associated to increased risk of neoplastic, cardiovascular, autoimmune and infectious diseases.21–25 In the case of liver diseases, lower 25(OH)D levels have been associated with greater histologic severity in chronic hepatitis C,26 greater degree of hepatic dysfunction,11 and higher risk of non-alcoholic fatty liver disease, hepatic osteodystrophy and hepatocellular carcinoma.27–29 However, not all studies have found these associations, and the impact of other variables, such as body composition parameters, have not been taken into consideration. Therefore, there are still uncertainties about the real meaning of 25(OH)D levels in patients with chronic liver diseases.
In the present study, significantly lower levels of 25(OH)D were observed in patients with cirrhosis as compared to the control group (27.03 ± 6.22 ng/mL vs. 32.34 ± 11.38 ng/mL, P = 0.018). In addition, 25(OH)D levels lower than 30 ng/mL were found in 69.9% of the subjects, and levels lower than 20 ng/ mL were found in 14.3%. These results are in agreement with most of previous studies, in which 25(OH)D levels below 30 ng/mL were observed in the majority of cirrhotic patients.8 However, the prevalence of 25(OH)D levels below 20 ng/mL observed here was smaller than suggested by previous studies, in which it ranged from 64 to 85%.9,11,30 This difference can probably be explained by the fact that these studies were carried out in European countries in which a higher prevalence of vitamin D deficiency is observed.31 Moreover, in two of these studies the data collection period was extended for all seasons of the year, which may limit the interpretation of results due to the influence of seasonality on 25(OH)D levels.31
Among those individuals with 25(OH)D levels below the lower tertile (24 ng/mL), there was a trend toward lower proportion of Caucasians, higher proportion of currently smoking, greater TSF, higher phosphorus and higher median of corrected calcium. However, in the logistic regression analysis, only greater TSF and non-Caucasian race were associated with 25(OH)D below the lower tertile. The TSF thickness measurement is considered an appropriate method for estimating body fat.32 Although there are no studies evaluating the relationship between body fat deposits and 25(OH)D levels in cirrhotic patients, data from population-based studies suggest an inverse relation between 25(OH)D and adiposity.33,34 This can be a result from the sequestrating effect of a high subcutaneous fat on circulating vitamin D, explained by the liposolubility of this compound.35,36 Therefore, the inverse association between TSF and 25(OH)D levels observed here may be explained by the effects of adipose tissue on circulating 25(OH)D, regardless of the high prevalence of malnutrition (nearly 50%) and of TSF bellow de 50th percentile (25.6%). Similarly, there is a relationship between lower 25(OH)D levels and black race, probably due to lower rates of 7-dehydrocholesterol photoconversion in individuals with more pigmented skin.36,37 These findings were also observed in a study including 118 individuals, most of which with HCV-related liver disease, that found that black race had the higher odds ratio for 25(OH)D levels lower than 7 ng/mL.38
Levels of PTH above 65 pg/mL were found in 24.6% of the patients and were not associated with the severity of liver disease nor with 25(OH)D levels. This is in accordance with the majority of previous studies, in which a relationship between the severity of liver disease and PTH levels was not observed.10,30,39,40 In the present study, hyperparathyroidism (PTH > 65 pg/mL) was not more frequent in the group with 25(OH)D below 24 ng/mL. The PTH secretion is controlled by vitamin D and calcium levels via vitamin D receptor and calcium-sensing proteins, respectively. Despite the well-established negative correlation between PTH and vitamin D levels, the absence of a compensatory increase of PTH levels in cirrhotic patients with low 25(OH)D levels has already been described.39 Possible explanations for this include polymorphism of the vitamin D receptor gene and suppression of PTH secretion by L-amino acids that activate calciumsensing receptors.39 However, further studies are needed to elucidate this phenomenon.
In this study, 25(OH)D levels were not associated with variables related to the severity of liver disease, such as MELD, Child-Pugh classification and D’Amico’s stage of cirrhosis. These findings are in disagreement with the majority of previous studies, in which lower 25(OH)D levels had been related to the severity of the hepatic disease.9–11,28,39,41 A possible explanation for these differences is the low number of patients with more advanced liver disease (Child-Pugh C) included in the present study. Nevertheless, the lack of association with other parameters such as MELD, D’Amico’s classification and laboratory tests (INR, albumin, total bilirubin) suggests that, in this sample, the degree of hepatocellular dysfunction had little impact on the levels of 25(OH)D. Moreover, most of the studies that investigated 25(OH)D levels in cirrhosis performed only bivariate analysis and included patients hospitalized for complications of the disease. Several factors influence 25(OH)D levels, such as skin pigmentation, adiposity, dietary factors and renal function, and they should be taken into account when investigating factors associated with vitamin D status.42
When the subgroup that had previously been admitted for complications of liver disease was compared in two different time points, significantly lower 25(OH)D levels were found during hospitalization. This reduction occurred in parallel with the worsening of hepatic parameters and rise of CRP levels. However, as in the outpatient evaluation, during hospitalization, 25(OH)D levels were not associated with the laboratory variables related to hepatic failure (Child-Pugh, MELD, INR, albumin and total bilirubin). Although these findings are limited by the possibility that 25(OH)D levels flutuate over time, the fact that lower 25(OH)D levels at hospitalization were noticed in 87% of cases (26/30 patients) suggests that vitamin D levels might have been affected by specific factors related to hospitalization. These lower levels evidenced at the time of acute decompensation of cirrhosis may indicate a significant role of liver function in the maintenance of serum 25(OH)D concentration. It is still possible that other factors, especially systemic inflammation, may explain these findings. A recent study showed that 25(OH)D behave like negative acute phase reactant, suggesting that hypovitaminosis D may be more a consequence than a cause of inflammatory processes.43 This theory seems to be especially interesting in the setting of chronic liver diseases, since cirrhosis is associated with increased bacterial translocation, endotoxemia and, consequently, chronic inflammation, which seems to be more intense in the patients with more advanced disease.44
It can be concluded that, in this group of stable cirrhotic patients with relatively preserved liver function, the prevalence of hypovitaminosis D was high and it was associated with level of adiposity and non-Caucasian race, but not with the severity of liver disease. Moreover, admission due to acute decompensation of cirrhosis was associated with lower 25(OH)D concentrations. Although this finding may suggest a role of the liver function in maintaining 25(OH)D levels, the absence of influence of variables related to liver dysfunction suggests that the relationship between 25(OH)D levels and the severity of the disease in cirrhotic patients seem to be more complex than previously supposed. New studies investigating the role of other phenomena such as endotoxemia and chronic inflammatory state are necessary for the clarification of this issue.
Conflict of InterestPotential conflict of interest and funding support: none to declare.
Previous presentation and/or publication: nothing to report


