


Background. Non-alcoholic fatty liver disease (NAFLD) is correlated with obesity, but specific therapeutic interventions are lacking. Adiponectin is an adipokine with anti-inflammatory activity and is considered a hepatic protector. We aimed to investigate effects of a low-fat diet on the hepatic expression of adiponectin and its receptors in rats with NAFLD.
Materials and methods. Sixteen male SD rats were fed a high-fat diet for 8 weeks (HFD1 group) or 16 weeks (HFD2 group) to induce NAFLD, and these rats were compared with rats on a normal diet for 8 weeks (NC1 group) or 16 weeks (NC2 group). Another group of 8 rats was fed an HFD for 8 weeks and then switched to a low-fat diet (DIET group) until the 16th week. The expression of hepatic adiponectin and its receptors was detected by western blotting, immunohistochemistry and RT-qPCR.
Results. The NAFLD activity score (NAS) in the HFD groups increased from 3.2 ± 0.45 (8th week) to 6.2 ± 0.84 (16th week) (P < 0.001), reflecting the progression in the NAFLD histology. In contrast to the HFD2 group, the low-fat diet ameliorated the steatosis, ballooning degeneration and inflammation. Dietary intervention augmented the expression of adiponectin and its receptors, which was down-regulated in the HFD2 group.
Conclusions. The NAFLD rat model was successfully developed by feeding the animals a high-fat diet. Adiponectin may play a role in the pathogenesis of NAFLD, especially in the progression from steatosis to NASH. The low-fat diet alleviated the histological lesions associated with NAFLD by up-regulating the expression of adiponectin and its receptors.
Nonalcoholic fatty liver disease (NAFLD) is the most common cause of chronic liver disease, and NAFLD occurs in 10-24% of the general population.1,2 Nonalcoholic steatohepatitis (NASH) refers to a stage within the spectrum of NAFLD that is characterized by hepatic steatosis, inflammation (which can progress to cirrhosis), liver dysfunction, and even hepatocellular carcinoma.3,4
NAFLD treatment is currently based on lifestyle intervention (diet and exercise). Insulin resistance (IR) and obesity-related inflammation are two of the possible dietary- and lifestyle-related factors that are considered to play a dominant role in the pathogenesis of this disease.5 NAFLD represents the hepatic component of metabolic syndrome, for which lifestyle modifications are definitely effective and possibly more useful than pharmacologic interventions at avoiding progression.6 An important aspect of lifestyle is diet. A cornerstone of the management strategy in such patients is initiating a diet to decrease body weight and to improve glycemic control, dyslipidemia and cardiovascular risk as well as to treat the fatty liver.7 Despite the fact that dietary change is the cornerstone of the management strategy for NAFLD, no specific guidelines exist pertaining to diet. There is no consensus as to what dietary approach is appropriate for NAFLD, largely because scientific evidence is lacking. Some reviews have summarized the recent findings from human studies on the dietary effects on NAFLD. The number of randomized intervention studies examining the relationships between NAFLD and dietary macronutrient composition is limited. Both of the randomized studies advised patients with NAFLD to reduce their caloric intake with either a low-fat or a low-carbohydrate diet and to limit their intake of fructose, trans-fatty acids and saturated fat.8–10 Nevertheless, the above tests focused on clinical patient research, and the long-term low-fat or low-carbohydrate diets were limited by patient compliance. Due to their invasive nature, liver biopsies are used sparingly to assess treatment efficacy.
Adiponectin is the most abundant adipose-specific hormone. It has anti-inflammatory, anti-diabetic and anti-atherogenic properties.11 Its expression and plasma concentration are inversely related to IR and metabolic syndrome12,13, including T2DM14 and obesity.15 Adiponectin functions via its specific receptors, adipoR1 and adipoR2. AdipoR1/adipoR2 are ubiquitously expressed in many tissues. In mice, adipoR1 is most abundantly expressed in skeletal muscle, whereas adipoR2 is most abundantly expressed in the liver.16 The activation of adipoR1 and adipoR2 can increase hepatic and skeletal muscle fatty acid oxidation and cellular glucose uptake and inhibit inflammation and oxidative stress.17,18 Therefore, adiponectin and its receptors are inversely related to the degree of IR and obesity and have been identified as potential therapeutic targets for the treatment of NAFLD.
Several recent studies have demonstrated that low-calorie dietary intervention elicits weight loss and up-regulates serum adiponectin levels.19,20 There have been various studies on the relationship between adiponectin receptors and NAFLD, and these studies demonstrated that adiponectin receptors may be involved in the progression of NAFLD.21,22 However, whether dietary intervention has a favorable effect on hepatic pathology and affects adiponectin and its receptors in the liver remains unknown.
Therefore, we used a high-fat diet (HFD) to create an NAFLD rat model and then studied the effects of a low-fat diet intervention. We analyzed biochemical assays, hepatic pathology and the expression of adiponectin and its receptors in the liver. We aimed to further understand the therapeutic effect and the mechanism of action of a low-fat diet intervention on NAFLD.
Material and MethodsExperimental model and drug treatmentForty male SD rats (6 weeks old, 190-210 g) supplied by Hayes Lake experimental animals company (Shanghai, China) were acclimatized in communal cages at 22 °C with a 12 h light, 12 h dark cycle for 1 week with a normal diet. The rats were then randomly divided into two groups that were fed a normal control diet (16 rats) or an HFD (24 rats) (10% lard, 20% sucrose, 2% cholesterol, 0.3% cholate, and 67.7% conventional feed by mass). Their body weight and food intake were measured weekly. Sixteen male SD rats were fed an HFD for 8 weeks (HFD1 group) or 16 weeks (HFD2 group) to induce NAFLD and were compared with 16 rats on a normal diet for 8 weeks (NC1 group, 8 rats) or 16 weeks (NC2 group, 8 rats). Another group of 8 rats was fed an HFD for 8 weeks and then switched to a low-fat diet (4% crude fat, DIET group) until sacrifice at the end of the 16th week. The body weights of the rats were measured after anesthesia with diethyl ether. Blood samples were collected via the heart and were centrifuged at 3,000 g for 10 min; the plasma was collected and stored at -80 °C until analysis. Liver tissues were quickly excised, washed with ice-cold PBS, and weighed. A small portion of each liver specimen was cut and fixed in formalin solution. The remaining liver tissue samples were rapidly frozen in liquid nitrogen and then stored at -80 °C for subsequent molecular assays. All of the experiments were approved by the Laboratory Animal Care and Use Committee of Xiamen University.
Biochemical assaysFasting total cholesterol (TC), triglycerides (TG), high-density lipoprotein cholesterol (HDL-C), low-density lipoprotein cholesterol (LDL-C), alanine aminotransferase (ALT), aspartate aminotransferase (AST) and plasma glucose were measured using commercial spectrophotometry-based kits (Nanjing, China) according to the manufacturer’s instructions. Plasma insulin concentrations were determined using ELISA kits for rat/mouse insulin (Millipore Corporation, USA). The plasma levels of adiponectin were measured using a Rat Total Adiponectin/Acrp30 Quantikine ELISA kit (R&D Systems, Minneapolis, MN, USA) according to the manufacturer’s instructions. The homeostasis model assessment of insulin resistance (HOMA-IR) was calculated based on the formula:

Where FPG is fasting plasma glucose and FINS is fasting insulin.
Liver histopathologyThe liver tissues in formalin solution were fixed overnight in 10% buffered formalin and embedded in paraffin. Sections (5 µm) of liver tissue were stained with hematoxylin and eosin (HE) for microscopic examination of hepatic structures and to ascertain the presence of lipid droplets. Two experienced pathologists blinded to the experimental data scored the liver specimens according to guidelines for the management of NAFLD.23 The NAFLD activity score (NAS) includes the following:
- •
Steatosis was scored from 0 to 3 based on a four-grade scoring system from S0 to S3, where S0 indicates no to less than 5% steatosis, S1 indicates 5-33% steatosis, S2 indicates 33-66% steatosis, and S3 indicates >66% steatosis.
- •
Lobular inflammation was graded as:
- °
Stage 0: no foci.
- °
Stage 1: < 2 foci per 200 x field.
- °
Stage 2: 2-4 foci per 200 x field.
- °
Stage 3: > 4 foci per 200 x field.
- °
- •
Ballooning degeneration of liver cells was evaluated as:
- °
Grade 0: absent.
- °
Grade 1: a few cells.
- °
Grade 2: many cells.
- °
The histological NAS score was defined as the unweighted sum of the scores for steatosis (0-3), lobular inflammation (0-3), and ballooning degeneration (0-2); therefore, the scores ranged from 0 to 8. The diagnostic criteria for simple steatosis, borderline NASH, and NASH were scores of 0-2, 3-4, and 5 or greater, respectively.
Liver immunohistochemical analysisImmunohistochemistry for adiponectin, adipoR1 and adipoR2 was performed on additional histological liver tissue sections. The unstained 5 µm sections were dried overnight at 60 °C. The sections were then deparaffinized with xylene and rehydrated in a graded series of ethanol. The sections were incubated in a citric acid antigen retrieval solution (Maxim Corp, Fuzhou, China) at 100 °C for 4 min (adiponectin protein expression) or 20 min (adipoR1 and adipoR2 protein expression). After cooling, endogenous peroxidase activity was inhibited by incubation with 3% H2O2 for 20 min at room temperature, and then the sections were washed with PBS (3 min x 3) and blocked with 10% rabbit serum in PBS for 20 min at room temperature to avoid non-specific reactivity. The sections were then incubated at 4 °C overnight with one of the following primary antibodies: goat anti-rat adiponectin polyclonal antibody (1:20; R&D Systems, Minneapolis, MN, USA), goat anti-rat adipoR1 polyclonal antibody (1:50; Novus Biologicals, Littleton, CO, USA) or goat anti-rat adipoR2 polyclonal antibody (1:50; Proteintech, Chicago, USA). The sections were washed with PBS (5 min x 3) and incubated for 30 min with secondary antibody (polymerized horseradish peroxidase-conjugated rabbit anti-goat IgG, Maxim Corp, Fuzhou, China) at 37°C. Immunoreactivity was visualized after reacting with diaminobenzidine (Maxim Corp, Fuzhou, China) for 2 min. The sections were then counterstained with Mayer’s hematoxylin for 2 min. Sections incubated without primary antibody were used as negative controls.
Western blottingTotal protein was extracted from liver tissues using a Protein Extraction Kit (Applygen Technologies Inc., Beijing, China) according to the manufacturer’s protocol. Total protein levels were determined by the bicinchoninic acid (BCA) method (Applygen Technologies Inc., Beijing, China). An equal amount of each protein sample was separated by sodium dodecyl sulfate polyacrylamide gel electrophoresis (SDS-PAGE) and electro-transferred to 0.45 PVDF membranes. The membranes were blocked with 5% skim milk in TBS with 0.1% Tween 20 and then incubated at 4 °C overnight with one of the following primary antibodies: goat anti-rat adiponectin polyclonal antibody (diluted 1:1000 in TBS with 0.1% Tween 20; R&D Systems, Minneapolis, MN, USA) goat anti-rat adipoR1 polyclonal antibody (diluted 1:1000 in TBS with 0.1% Tween 20; Novus Biologicals, Littleton, CO, USA) or rabbit anti-rat adipoR2 polyclonal antibody (diluted 1:500 in TBS with 0.1% Tween 20; Proteintech, Chicago, USA). After three washes with TBS-Tween, the membranes were incubated with HRP-conjugated anti-goat secondary antibody (1:5,000; Multi Sciences Biotech Co., Hangzhou, China) or HRP-conjugated anti-rabbit secondary antibody (1:5,000; Multi Sciences Biotech Co., Hangzhou, China) at room temperature for 1 h. The membranes were exposed using the ECL system (Applygen Technologies Inc., Beijing, China), and the bands were quantified using Adobe Photoshop CS5.0 (Adobe Company, USA).
RT-qPCR analysisTotal RNA was extracted using TRIzol reagent (Invitrogen, USA) according to the manufacturer’s instructions. After determining the RNA concentrations by measuring the absorbance at 260 nm and 280 nm, 4 of RNA was reverse transcribed to cDNA using a RevertAid™ First Strand cDNA Synthesis Kit (Fermentas, USA). Quantitative real-time PCR (RT-qPCR) was performed on a 7500 Real-time PCR machine (ABI Applied Biosystems) using Power SYBR Green PCR Master Mix. The following primer sequences were utilized:
- •
Adiponectin, forward 5’-GACTGCCACTAATTCAGAGC-3’ and reverse 5’-CTCATGGGGATAACACTCAG-3’.
- •
AdipoR1, forward 5’-GCTGGCCTTTATGCTGCTCG-3’ and reverse 5’-TCTAGGCCGTAACGGAATTC-3’.
- •
AdipoR2, forward 5’-CCACAACCTTGCTTCATCTA-3’ and reverse 5’-GATACTGAGGGGTGGCAAAC-3’.
- •
β-actin, forward 5’-GTAGCCATCCAGGCTGTGTT-3’ and reverse 5’-AACACAGCCTGGATGGCTAC-3’.
The cycling conditions were as follows: 10 min at 95 °C followed by 40 (adipoR1/R2) or 45 (adiponectin) cycles of 15 seconds at 95 °C and 1 min at 60 °C (adipoR1/R2) or 57 °C (adiponectin). A melting curve analysis was used to confirm the specificity of the PCR products, which was demonstrated as a single peak (data not shown). The expression of ß-actin served as the internal control. Each sample was analyzed in triplicate. The previously reported comparative Ct method was used to analyze the real-time PCR data.
Statistical analysisThe data are presented as the mean ± standard deviation. The significance of the differences was determined by one-way ANOVA. The differences between the two groups were analyzed by Student’s t-test. To test the associations between different variables, Spearman’s correlation analysis was performed. A two-tailed P-value of < 0.05 was considered statistically significant. SPSS 13.0 for Windows (SPSS Software, Chicago, IL, USA) was used to perform the statistical analysis.
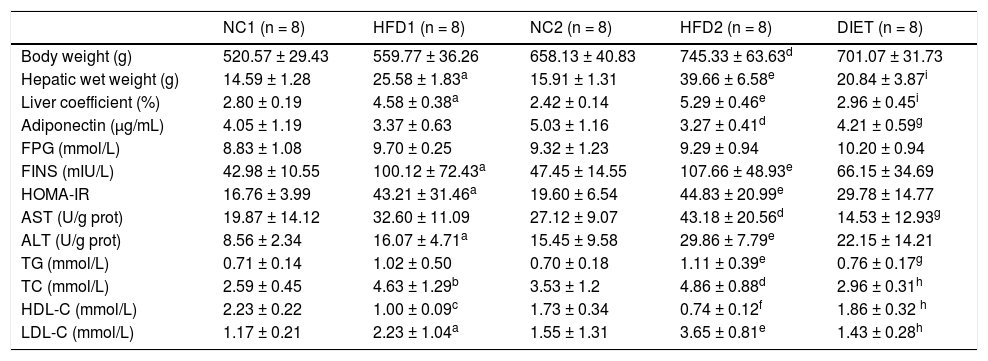
ResultsAnimal characteristicsThroughout the experimental period, the weight, hepatic wet weight and liver coefficient were higher in the rats fed an HFD than in the control rats, although there was no significant difference between the HDF1 and NC1 groups (P = 0.067). The body weight (P < 0.01), hepatic wet weight (P < 0.001) and liver coefficient (P < 0.001) were markedly increased in the HFD2 group compared with the NC2 group. In addition, the body weight (P < 0.001), hepatic wet weight (P < 0.01) and liver coefficient (P < 0.05) were significantly higher in the HFD2 group than in the HFD1 group. The body weight in the DIET group tended to be lower than that in the HFD2 group, but the difference was not significant (P > 0.05). Nevertheless, the hepatic wet weight (P < 0.001) and liver coefficient (P < 0.001) were significantly lower in the DIET group compared with the HFD2 group (Table 1).
Comparison of the animal characteristics and biochemical parameters.
| NC1 (n = 8) | HFD1 (n = 8) | NC2 (n = 8) | HFD2 (n = 8) | DIET (n = 8) | |
|---|---|---|---|---|---|
| Body weight (g) | 520.57 ± 29.43 | 559.77 ± 36.26 | 658.13 ± 40.83 | 745.33 ± 63.63d | 701.07 ± 31.73 |
| Hepatic wet weight (g) | 14.59 ± 1.28 | 25.58 ± 1.83a | 15.91 ± 1.31 | 39.66 ± 6.58e | 20.84 ± 3.87i |
| Liver coefficient (%) | 2.80 ± 0.19 | 4.58 ± 0.38a | 2.42 ± 0.14 | 5.29 ± 0.46e | 2.96 ± 0.45i |
| Adiponectin (µg/mL) | 4.05 ± 1.19 | 3.37 ± 0.63 | 5.03 ± 1.16 | 3.27 ± 0.41d | 4.21 ± 0.59g |
| FPG (mmol/L) | 8.83 ± 1.08 | 9.70 ± 0.25 | 9.32 ± 1.23 | 9.29 ± 0.94 | 10.20 ± 0.94 |
| FINS (mIU/L) | 42.98 ± 10.55 | 100.12 ± 72.43a | 47.45 ± 14.55 | 107.66 ± 48.93e | 66.15 ± 34.69 |
| HOMA-IR | 16.76 ± 3.99 | 43.21 ± 31.46a | 19.60 ± 6.54 | 44.83 ± 20.99e | 29.78 ± 14.77 |
| AST (U/g prot) | 19.87 ± 14.12 | 32.60 ± 11.09 | 27.12 ± 9.07 | 43.18 ± 20.56d | 14.53 ± 12.93g |
| ALT (U/g prot) | 8.56 ± 2.34 | 16.07 ± 4.71a | 15.45 ± 9.58 | 29.86 ± 7.79e | 22.15 ± 14.21 |
| TG (mmol/L) | 0.71 ± 0.14 | 1.02 ± 0.50 | 0.70 ± 0.18 | 1.11 ± 0.39e | 0.76 ± 0.17g |
| TC (mmol/L) | 2.59 ± 0.45 | 4.63 ± 1.29b | 3.53 ± 1.2 | 4.86 ± 0.88d | 2.96 ± 0.31h |
| HDL-C (mmol/L) | 2.23 ± 0.22 | 1.00 ± 0.09c | 1.73 ± 0.34 | 0.74 ± 0.12f | 1.86 ± 0.32 h |
| LDL-C (mmol/L) | 1.17 ± 0.21 | 2.23 ± 1.04a | 1.55 ± 1.31 | 3.65 ± 0.81e | 1.43 ± 0.28h |
Table 1 presents the plasma biochemistry for all the groups. The adiponectin levels were slightly, but not significantly, decreased after 8 weeks on an HFD but were significantly lower (P < 0.05) after 16 weeks on an HFD compared with the control group. After dietary intervention for 8 weeks, the adiponectin levels increased in comparison with the HFD2 group. Compared with the NC1 and NC2 groups, there were no differences in the fasting glucose concentration, but the fasting insulin levels were elevated in the HFD1 and HFD2 groups (P < 0.05 and P < 0.01, respectively). Furthermore, the HOMA-IR was significantly higher in the HFD1 and HFD2 groups than in the control groups (P < 0.05 and P < 0.01, respectively). A decreasing trend in fasting glucose, fasting insulin and HOMA-IR levels was found in the DIET group compared with the HFD2 group, but the differences were not significant. ALT and AST were significantly increased in the HFD groups compared with the control groups, especially in the HFD2 group. The ALT and AST levels decreased after dietary intervention. Certain lipid metabolism markers, including TG, TC and LDL-C, were up-regulated, but HDL-C was down-regulated in the HFD groups compared with the NC groups. After dietary intervention, all of the lipid metabolism parameters improved significantly in comparison with the HFD2 group (Table 1).
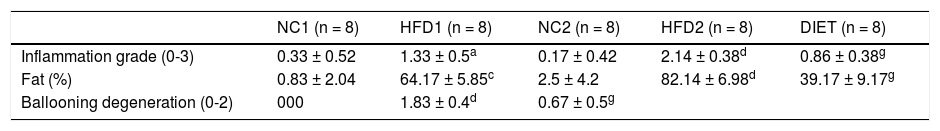
Liver pathologyHE staining of liver specimens from HFD rats suggested that the rat model of NAFLD had been successfully established. In liver samples from the HFD1 group, steatosis lesions were observed in hepatocytes, which showed a speckled distribution with more serious lesions around the central vein and mild lesions in the portal vein area. In the liver samples from the HFD2 group, steatosis was present along with liver lobule destruction, lobular inflammation and ballooning degeneration of hepatocytes, but fibrosis lesions were not apparent. The NAFLD activity score (NAS) for the HFD1 group was 3.7 ± 0.52, which was higher than that for the NC1 group (0.5 ± 0.55; P < 0.001); the NAS for the HFD2 group was 6.57 ± 0.79, which was higher than that for the NC2 group (0.5 ± 0.54; P < 0.001) (Figure 1B). In contrast to the HFD2 group, the liver samples from the DIET group showed improvement in steatosis, ballooning degeneration and inflammation (Figure 1 and Table 2).
, HFD1 (b), NC2 (c), HFD2 (d), and DIET (e) groups (x 200). B. NAFLD activity scores in the liver specimens. * P < 0.001 compared with the NC1 group. ** P < 0.001 compared with the NC2 group; and *** P < 0.001 compared with the HFD2 group.")
HE staining of liver specimens. A. HE staining of liver specimens in the NC1 (a), HFD1 (b), NC2 (c), HFD2 (d), and DIET (e) groups (x 200). B. NAFLD activity scores in the liver specimens. * P < 0.001 compared with the NC1 group. ** P < 0.001 compared with the NC2 group; and *** P < 0.001 compared with the HFD2 group.
Histological parameters of the liver specimens.
Immunohistochemical staining of rat liver specimens showed that adiponectin was primarily expressed in vascular endothelial cells and that its receptors were predominantly expressed in the cytoplasm of hepatocytes. The results suggested that adiponectin expression tended to be lower in the HFD1 group compared with the NC1 group, but the difference was not significant. The expression of adipoR1 and adipoR2 was down-regulated in the HFD1 group compared with the NC1 group. The expression of adiponectin and its receptors decreased after 16 weeks on an HFD compared with the NC2 group. The protein expression of adiponectin and its receptors increased in the DIET group compared with the HFD2 group (Figure 2). Western blotting confirmed that adipoR1/adipoR2 expression decreased in the HFD1 group compared with the NC1 group. The protein expression of adiponectin, adipoR1 and adipoR2 was decreased in the HFD2 group compared with the NC2 group. Markedly higher expression of adiponectin and adipoR1/adipoR2 was observed after dietary intervention (Figure 3).
, adipoR1 (C) and adipoR2 (E). The sections labeled ‘a’ were from the NC1 group, and those labeled ‘b’, ‘c’, ‘d’, and ‘e’ were from the HFD1, NC2, HFD2, and HFD+D groups, respectively. ‘f’ represents the negative control sections (x 200). (B, D, F) Relative adiponectin (B), adipoR1 (D) and adipioR2 (F) immunohistochemical scores in liver tissue from the five groups. * P < 0.001 compared with the NC1 group. † P < 0.001 compared with the NC2 group; and ‡ P<0.05, § P < 0.01, and ║ P < 0.001 compared with the HFD2 group.")
Immunohistochemical staining for hepatic adiponectin (A), adipoR1 (C) and adipoR2 (E). The sections labeled ‘a’ were from the NC1 group, and those labeled ‘b’, ‘c’, ‘d’, and ‘e’ were from the HFD1, NC2, HFD2, and HFD+D groups, respectively. ‘f’ represents the negative control sections (x 200). (B, D, F) Relative adiponectin (B), adipoR1 (D) and adipioR2 (F) immunohistochemical scores in liver tissue from the five groups. * P < 0.001 compared with the NC1 group. † P < 0.001 compared with the NC2 group; and ‡ P<0.05, § P < 0.01, and ║ P < 0.001 compared with the HFD2 group.
. Relative adipoR1 protein expression in the liver as determined by western blotting using GAPDH as a reference protein (C, D). Relative adipoR2 protein expression as determined by western blotting using GAPDH as a reference protein (E, F). * P < 0.05 and † P < 0.01 compared with the NC1 group; ‡ P < 0.05 and § P < 0.01 compared with the NC2 group; and ║P < 0.05 and ¶ P < 0.01 compared with the HFD2 group.")
Relative adiponectin protein expression in liver as determined by western blotting using GAPDH as a reference protein (A, B). Relative adipoR1 protein expression in the liver as determined by western blotting using GAPDH as a reference protein (C, D). Relative adipoR2 protein expression as determined by western blotting using GAPDH as a reference protein (E, F). * P < 0.05 and † P < 0.01 compared with the NC1 group; ‡ P < 0.05 and § P < 0.01 compared with the NC2 group; and ║P < 0.05 and ¶ P < 0.01 compared with the HFD2 group.
Our quantitative real-time PCR data indicated that the mRNA expression of adiponectin was lower in the HFD1 group than in the NC1 group, but the difference was not significant (P > 0.05); however, adiponectin mRNA expression was significantly decreased in the HFD2 group compared with the NC2 group (P < 0.05). The mRNA expression of the adiponectin receptors (adipoR1/adipoR2) was significantly down-regulated (P < 0.05) in the livers from the HFD groups compared with those from the NC groups. The data also showed that the DIET group exhibited an increasing trend in adiponectin receptor expression, but the data were not significant. The expression of the adiponectin receptors was significantly increased in the DIET group compared with the HDF2 group (Figure 4).
Correlation analysis of adiponectin and liver histological alterations, adipoR1 (B) and adipoR2 (C) mRNA expression in rat liver tissue. *P < 0.05 compared with the HFD2 group.")
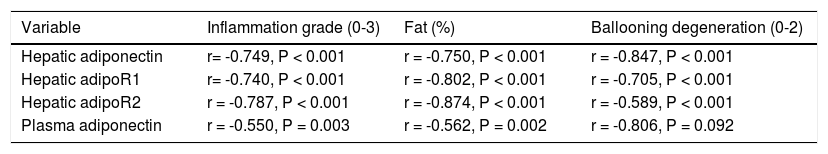
The immunohistochemistry scores of the expression of adiponectin and its receptors were negatively correlated with the inflammation grade, percent fat, and ballooning degeneration (P < 0.001). Plasma adiponectin levels were negatively correlated with the inflammation grade (P = 0.003) and percent fat (P = 0.002) but were not correlated with ballooning degeneration (P = 0.092) (Table 3).
Correlations between serum adiponectin levels and the immunohistochemical scores for adiponectin and its receptors and inflammation grade, fat (%), and ballooning degeneration in the rat liver.
| Variable | Inflammation grade (0-3) | Fat (%) | Ballooning degeneration (0-2) |
|---|---|---|---|
| Hepatic adiponectin | r= -0.749, P < 0.001 | r = -0.750, P < 0.001 | r = -0.847, P < 0.001 |
| Hepatic adipoR1 | r= -0.740, P < 0.001 | r = -0.802, P < 0.001 | r = -0.705, P < 0.001 |
| Hepatic adipoR2 | r = -0.787, P < 0.001 | r = -0.874, P < 0.001 | r = -0.589, P < 0.001 |
| Plasma adiponectin | r = -0.550, P = 0.003 | r = -0.562, P = 0.002 | r = -0.806, P = 0.092 |
NAFLD has a high incidence and is closely related to obesity. The histology of NAFLD ranges from simple steatosis to severe steatohepatitis and can develop into NASH, which can progress to cirrhosis and liver failure. The diagnostic procedure for confirming NAFLD involves a liver biopsy. Liver tissue with NASH contains fatty deposits, inflammation and damaged hepatic cells.23 In our study, HFD induced NAFLD in rats, and longer exposure to an HFD led to more severe histological lesions, which was supported by the NAS for the HFD group. HE staining of rat liver specimens showed steatosis lesions in hepatocytes from the HFD1 group and more severe steatosis with destruction of the liver lobules and lobular inflammation in the HFD2 group. The NAS for the HFD1 group was 3.67 ± 0.55, which indicates probable NASH, and the NAS for the HFD2 rats was 6.57 ± 0.79, which corresponds with a diagnosis of NASH.23 A NAFLD rat model was successfully created by feeding the animals a high-fat diet.
Adiponectin, an adipokine secreted by adipose tissue, plays an important role in regulating glucose and lipid metabolism and controlling energy homeostasis in insulin-sensitive tissue.24 Adiponectin signals through specific receptors (adipoR1/adipoR2), but its role and that of its receptors in the progression of NAFLD are unclear. There is evidence that both adiponectin receptor agonists and up-regulated adiponectin receptor expression alleviate insulin resistance.25 Insulin resistance is commonly considered a pivotal feature of NAFLD.5 Hence, there is a hypothesis that adiponectin and its receptors may be promising therapeutic targets for the treatment of NAFLD. Our study found that the expression of adipoR1 and adipoR2 in liver tissue decreased significantly and that this was accompanied by insulin resistance and hyperlipidemia in the HFD1 group (rats fed a high-fat diet for 8 weeks); in this group, adiponectin expression exhibited a decreasing trend that was not significant. After being on an HFD for 16 weeks, rats in the HFD2 group presented with more severe glucose and lipid metabolic disturbances as well as with hepatic lesions with decreased expression of adiponectin and its receptors (adipoR1/adipoR2). To further explore the relationship between the expression of the adiponectin pathway and the extent of hepatic pathology, we used Spearman’s rank correlation coefficient to analyze the selected variables. The staining intensity of adiponectin and its receptors negatively correlated with the percent fat, ballooning degeneration and the inflammation grade. Plasma adiponectin levels were negatively correlated with the percent fat and the inflammation grade. The data indicated that adi-ponectin and its receptors potentially play a role in the pathogenesis of NAFLD.
Currently, lifestyle (including diet and exercise) intervention is the fundamental strategy for treating NAFLD, as there is no consensus on effective pharmacological treatment. An important aspect of lifestyle is diet. Although dietary intervention is recommended as a primary treatment for NAFLD, there is little scientific data on diet and NAFLD. The effects of dietary intervention on the expression of adiponectin and its receptors in liver tissue require confirmation. Some recent articles have suggested that decreasing total fat intake may be beneficial for treating nonalcoholic steatohepatitis, but these conclusions were based on a limited number of clinical human studies, some of which lacked a proper control group and were limited by the disinclination to undergo an invasive liver biopsy.7,8,26,27 It is necessary to perform adequately stringent trials of dietary therapy in NAFLD with histologic analysis as the final outcome. Due to the constraints on performing liver biopsies in patients with NAFLD, our study induced NAFLD in rats with a high-fat diet and then treated these animals with a low-fat diet. The NAFLD rats on a low-fat diet exhibited approximately 6% body weight loss, a lower liver coefficient, improved dyslipidemia and increased adiponectin levels. Some studies have reported that diet-induced weight loss increases adiponectin levels.19,28–30 Certainly, low-fat diet-induced weight loss is closely related to circulating adiponectin levels. Torres, et al.29 summarized the data, which suggest that a moderate weight loss of approximately 6% via caloric restriction improved the intrahepatic lipid content, serum aminotransferase levels and hepatic histology. However, the mechanism by which dietary intervention alters hepatic histology in NAFLD remains incompletely understood. In our study, the NAFLD rats on a low-fat diet experienced an alleviation of hepatic steatosis, ballooning degeneration and inflammation, and the expression of adiponectin and its receptors (adipoR1/adipoR2) was up-regulated. Buechler, et al.31 summarized recent original articles and proposed that increasing adiponectin levels may be beneficial in the treatment of liver disease and may exert protective effects against hepatic steatosis. In our previous study, globular adiponectin ameliorated hepatic steatosis and was suggested as a potential therapy for diabetic rats with NAFLD.32 Therefore, we posited that dietary intervention could ameliorate the hepatic histological lesions associated with NAFLD by up-regulating the expression of adiponectin and its receptors in liver tissue.
ConclusionIn conclusion, an NAFLD rat model was successfully created by feeding rats an HFD. Adiponectin may play a role in the pathogenesis of NAFLD, especially during the progression from steatosis to NASH. Dietary intervention improved the hepatic histological lesions associated with NAFLD by up-regulating the expression of adiponectin and its receptors in liver tissue.


