


Livers cold preserved in University of Wisconsin (UW) solution followed by reperfusion suffer ischemia/reperfusion injuries. Microcirculation is the primary target of damage, characterized by sinusoidal perfusion failure due, mainly, to morphological changes of sinusoidal endothelial cells. Here, we demonstrated that the addition of S-nitrosoglutathione (GSNO) to the UW solution before cold storage, as a nitric oxide (NO) donor, attenuated hepatic injuries.
Wistar adult rat livers were stored in UW solution (0°C – 48 hs) and then reperfused during 60 minutes using the Isolated Perfused Rat Model (IPRL). We assayed four GSNO concentration (50, 100, 250 and 500 μM). NO concentration was estimated calculating the amount of nitrite (NO2-) generated in the UW solution. Injuries during cold preservation were established measuring lactate dehydrogenase (LDH) released to the UW solution. Meanwhile, intrahepatic resistance (IR), LDH released to the perfusate, the effluent/perfusate ratio for K+, bile flow, liver glycogen content and sinusoidal endothelial cell morphology were studied after 1 hour of reperfusion in the IPRL system.
In cold preserved livers without GSNO, glycogen content was dramatically reduced, IR increased markedly, LDH released was high, bile flow diminished and sinusoidal endothelial cells appeared rounded and detached from perisinusoidal matrix after reperfusion. The presence of 100 μM GSNO prevented the IR rise and LDH release, improved bile production and partially reduced endothelial cells damages.
In conclusion, the addition of 100 μM GSNO to UW solution improved hemodynamic and function capacity of cold preserved/reperfused livers.
Abbreviations:
UW; University of Wisconsin, NO: nitric oxide, GSNO: S-nitrosoglutathione, KH: Krebs-Henseleit bicarbonate buffer, LDH: lactate dehydrogenase, IPRL: Isolated Perfused Rat Liver, PAS: Peryodic Acid Schiff, IR: intrahepatic resistance, J.V.R and E.E.G. are members of The National Council of Research (CONICET), Argentina
IntroductionThe main objective in organ preservation is to conserve graft function after a transplant under optimal conditions. Cold storage of the liver allograft in the University of Wisconsin solution (UW) has been the reference method to preserve human livers up to 20 hours before transplantation.1 However, cold preserved livers during variable time period, suffered severe injuries that could alter hepatic tissue and function.2 Reperfusion performed after preservation, aggravates the damages induced by ischaemia, mainly because of oxygen-derived free radicals generation.1 Endothelial cells are known to be an early target of ischaemia. In such condition, swelling and disruption of the sinusoidal lining (by alterations in connections between cells and extracellular matrix) induced microcirculatory disturbances during reperfusion.3,4 Microcirculatory blood flow is modulated by vasoactive substances, such as nitric oxide (NO) and endothelins.2 S-nitrosoglutathione (GSNO) which is an S-nitrosothiol5,6 is a NO donor that exhibit endothelin derived relaxing factor-like properties7 and it has effects on vascular smooth muscle.6 Aside from its use as organic synthesis reagent, GSNO is of interest because its potent pharmacological properties and possible physiological role in smooth muscle relaxation like other NO donors such as sodium nitroprusside.5,8
Since abnormalities in microcirculation could play a primary role in the pathogenesis of the graft nonfunction,9 this could be prevented by adding vasodilators to the UW solution.
Direct effect of cold preservation/reperfusion on liver can be studied with the Isolated Perfused Rat Liver model (IPRL). This model is a valuable tool to study the response of normal vascular systems to pharmacological manipulation, since it eliminates the possible influence of systemic hemodynamic alterations. It is also suitable to assess hypoxic damage that is frequently aggravated during normothermic reperfusion, which may ultimately result in liver dysfunction or failure.10
In a previous paper we demonstrated that the addition of 100 μM GSNO to UW solution diminished hepatic morphological alteration by reducing hepatocyte cords disruption, cell vacuolation, endothelial cell detachment and collagen network disorganization on rat livers cold preserved during 48 hs and then reperfused.11
Since the addition of GSNO as a NO donor to the UW solution improved liver morphology of cold preserved/ reperfused rat livers, the purpose of this work was to furthermore examine the effect of GSNO added to the UW solution during 48 hours of cold ischemia, on the hemodynamic and functional capacity performance of livers, using the IPRL model.
Material and methodsAnimalsAdults male Wistar rats weighing 250-350 g were used for this study. Animals had free access to standard rat chow and tap water, and were not fasted before surgery. All operations were performed between 9 AM and noon. The experiments described in this report were conducted according to international regulations and approved by the National Council of Research in Argentina (CONICET).
SolutionsThe UW solution used in this study was modified for us8 based on the UW solution described by Beltzer.12 The composition of the modified UW solution was as follows: 100 mM Lactobionic Acid, 25 mM KH2PO4, 5 mM MgSO4, 30 mM Raffinose, 5 mM Adenosine, 1 mM Allopurinol, 3 mM Glutathione (GSH), 0.25 mg/mL Streptomycin and 10 UI/mL Penicillin G. GSH was added to UW solution before use, UW solution was brought to pH 7.40 at 25 °C with 5 M KOH. The final Na+ and K+ concentrations were 30 mM and 125 mM, respectively. The solution was bubbled with 100% N2 for 15 min at 4 °C before use.13 Hydroxyethyl Starch, Dexametasone and Insulin were omitted with respect to the commercial solution, because their roles are still controversial.14 GSNO was dissolved in a small volume of distillate water and added to UW solution immediately before use.
Composition of perfusate Krebs-Henseleit bicarbonate buffer (KH) - bovine serum albumin: the synthetic medium consisted in 2% bovine serum albumin in KH with the following composition: NaCl 118 mM, KCl 4.8 mM, NaHCO3 25 mM, KH2PO4 1.2 mM, MgSO4 1.2 mM, CaCl2 1.5 mM, Heparin 2 UI/mL and Glucose 5 mM. The final pH of the KH solution after equilibration with carbogen (O2:CO2, 95:5 %) was 7.40. The perfusate was filtered through a 1.5 μm glass fiber filter before use.
Hepatectomy and cold storageThe rats were anesthetized with sodium thiopental (50 mg/kg, i.p.) and their livers were prepared according to the standard technique.15 In brief, the bile duct was cannulated with a PE-50 catheter (Intramedic USA) and 0.2 mL of saline containing 500 UI of Heparin (Abbot, Argentina) was injected into the femoral vein. The portal vein was cannulated with a large catheter 14 G (2.10 mm internal diameter) and the hepatic artery was ligated. The liver was perfused with oxygenated KH buffer (37 °C) at a flow of 15 mL/min. Then, the suprahepatic inferior vena cava was cannulated with a polyethylene tubing (3 mm internal diameter) and the liver was removed without stopping the perfusion. In the control group the perfusion was performed immediately, whereas in the experimental groups the livers were flushed-out with 30 mL of cold UW solution for approximately 2 min and then transferred to a vessel containing the preservation solution maintained at 4 (C. After that, the livers were cold stored at 0 (C during 48 hours.
ChemicalsGSNO was prepared according to the method of Hart16 by incubating equimolar amounts of glutathione and sodium nitrite in acidified water at 0°C. GSNO solutions were freshly prepared before each experiment from GSNO powder conserved at 4°C under vacuum. Preparation quality and concentration of GSNO was spectrophotometrically determined at 335 nm (ϵ =826 dm3 mol-1 cm-1) and at 545 nm (ϵ =17.4 dm3 mol-1 cm-1). All the other chemical compounds were from ICN Biomedicals Inc.
NO production during cold preservationTo investigate the role of GSNO in the generation of NO during cold preservation, we analyzed the time course accumulation of NO2- in UW solution. This approach is supported by observations of Ignarro et al,9 that the principal spontaneous oxidation product of NO in aqueous solution in absence of biological contaminating substances is NO2-. Therefore, the accumulation of NO2- in the medium may represent the NO generation in situ from GSNO during hypothermic storage. The time course of NO2- production, was determined in freshly prepared UW solution bubbled with 100 % N2. The following solutions were assayed: UW+50 μM GSNO; UW+100 μM GSNO; UW+250 μM GSNO, and UW+500 μM GSNO. These solutions were maintained at 0°C during 48 hs, NO2- concentration was measured at the end of the incubation.
NO2- was assayed spectrophotometrically using a procedure based on the Griess reaction as previously described.8
The perfusion system:The livers were perfused using a recirculating system modified from Alexander et al17 as we described previously.8 The perfusion system consisted of an oxygenator and a liver perfusion circuit connected in parallel to a common reservoir; a Masterflex pump equipped with two heads that pumps the perfusate from the main reservoir into two independent circuits. In one, the perfusate was pumped first through a thermostatized water-jacketed glass coil and a plastic device with a Nylon filter, after that a to calibrated flowmeter (Cole-Parmer G-32001-32) and a bubble trap and finally to the portal cannula. In the other circuit, the perfusate was recirculated and oxygenated while passing through oxygen-permeable tubing (Silicone Tubing, I.D. 0.078"; cat. # T5715-9, Baxter Healthcare Corp., USA) inside an appropriate glass container with a 95% O2 and 5% CO2, at a constant pressure of 90 mm Hg. Air bubbles were avoided by connecting a disposable nylon filter in line between the oxygenator and the inflow. A plastic device inserted between the heat exchanger and the flow meter was used to “smooth out” the pulsatile output of the peristaltic pump.18 The isolated liver was mounted on a glass container, continuously perfused through the portal vein, and the effluent escaped through the inferior vena cava cannula to the reservoir. The perfusion pressure was monitored during reperfusion and recorded with a strain gauge pressure transducer P23ID attached to a sidearm placed just proximal to the perfusion cannula. A hydrostatic manometer was used to calibrate the transducer, with the zero placed at the level of the liver. To support bile flow, sodium taurocholate in KH-bovine serum albumin was infused into the reservoir at a rate of 0.3 μmol.min-1 with a syringe pump. The temperature close to the liver was measured using a thermocouple probe connected to an assistant infrared lamp device designed to maintain the liver at 37 (C. The recirculating perfusate volume was 180 mL. The pH was continuously monitored in the reservoir and maintained at 7.40 (0.50 with 1 M HCl or 8.4 % NaHCO3.
Perfusion of the isolated liver for assessment of liver function after preservationOnce the liver had been installed in the glass support, the perfusion with KH was performed immediately, first in a nonrecirculating system increasing the flow rate between 5 to 25 mL/min in 10 min, and then the perfusate was changed to KH-bovine serum albumin and switched to a recirculating system. The flow rate was rise to 40 mL/min in 30 min; this time was sufficient to stabilize the preparation. In all groups, the livers were then perfused for 60 min at a flow rate of 40 mL/min (3.49 ± 0.46 mL.min-1. g.liver1, n=17) the portal pressure was recorded continuously and the intrahepatic resistance was calculated. The intrinsic resistance of the system was measured (0.004 mmHg.mL-1.min.) and subtracted from the values. The bile was collected in pre-weighed tubes every 15 min and the bile flow was estimated gravimetrically assuming the bile density to be equal to water and expressed as mL.min-1.g. liver-1. Perfusate samples were taken every 15 min from the reservoir for measurement of lactate dehydrogenase (LDH) and K+ release. At the end of the perfusion, the livers were collected, and weighed. Liver glycogen was determined in biopsy specimens taken just after the liver was weighed.
Analytical methodsLDH concentration was measured in 1 mL of perfusate samples by following the rate at which NADH was converted to NAD+ at 340 nm in the presence of pyruvate.19 Potassium concentration was measured by flame photometry.
Liver glycogen was calculated from the amount of glucose released by treatment of homogenized tissue with a-amyloglucosidase following the determination of free glucose content.20
CalculationsRelease of LDH by the liver during cold storage was calculated as:
LDH (mUI. h-1. g.liver-1) = (C x V) ((Lw x hours of cold storage)
Where C was the LDH concentration in the perfusion medium after 24 or 48 hs of cold storage, V is the preservation solution volume and Lw is the liver weight.
Intrahepatic resistance during 60 min of perfusion (IR) was calculated as:
IR (mmHg. ml-1. min. g.liver) = portal pressure (mm Hg) (portal flow
(mL.min-1.g.liver-1).
Release of LDH by the liver during perfusion was calculated as:
LDH (mUI.min-1 g.liver-1) = [(Ct-C0) x V] (Lw x 60 min).
Where Ct was the LDH concentration in the perfusion medium after t min of reperfusion and CO at the end of the stabilization period, V is the perfusate volume (180 mL) and Lw is the liver weight.
Potassium release to effluent perfusate was calculated as:
[K+]effluent ÷ [K+]perfusate
Where [K+]effluent was the K+ concentration of effluent perfusate after t min and [K+]perfusat, e was the K+ concentration at the end of the stabilization period.
Histological studiesTo evaluate histological changes produced on endothelial cells (as primary target of injury during cold preservation/reperfusion)21 and hepatocytes glycogen content, liver pieces were taken from each experimental group after reperfusion. Each piece was fixed in 4% PBS buffered formalin (pH=7,40) and embedded in paraffin. Sections were cut at 5 μm thick and processed as follows:
Endothelial cells:- •
Hematoxylin-eosin stain: endothelial cells injury was examined taking into account their shape and their adhesion to perisinusoidal matrix.
- •
Rabbit anti-human Factor VIIIrelated antigen (anti human Von Willebrand Factor) was performed to identify endothelial cells in general (DAKO-A082, F3520). A Laser Scanning Microscope (LSM-410, Zeiss) was used to observe the slices using a laser 543 nm.
- •
Phase Contrast Microscopy was used to determine if there were parts of endothelial cells that had structures with different refractive indices that changed after cold preservation/reperfusion.
- •
PAS (Peryodic Acid Schiff) reaction: was performed on liver slices of 5 mm thick from each experimental group and it was used to study the content of glycogen in parenchymal cells.23
LDH released (during preservation), portal flow, liver weight and glycogen content (after reperfusion) and changes in IR, K+ release and bile flow (during reperfusion) were analyzed by Analysis of Variance (ANOVA). Bonferroni multiple range test was used for analysis of IR and bile flow followed ANOVA. LDH released during reperfusion was assessed by Kruskal-Wallis nonparametric statistical test. In all cases, significance level was considered p<0.05.
Experimental groups:Six groups were compared in this study: I) controls, in which hepatectomy was immediately followed by the organ perfusion (IC) (n= 6), II) livers cold preserved 48 hs in UW (IIP48) (n=5), III) 48 hs preservation in UW + 50 μM GSNO (IIIPGSNO50) (n= 5), IV) 48 hs preservation in UW + 100 μM GSNO (IVPGSNO100) (n= 4), V) 48 hs preservation in UW + 250 μM GSNO (VPGSNO250) (n= 4) and VI) 48 hs preservation in UW + 500 μM GSNO (VIPGSNO500) (n= 4). Groups II, III, IV, V and VI where reperfused in the IPRL system after preservation.
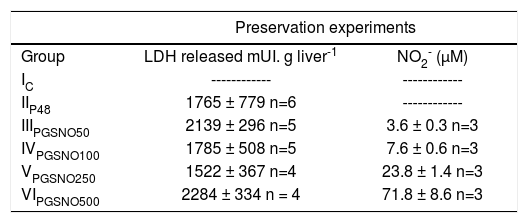
ResultsCold storageThe release of LDH to the preservation solution and NO2- production during 48 hs of cold storage in UW solution are shown in Table I. The enzymatic activity expressed as mUI/g.liver-1 was statistically similar for all groups. The GSNO concentrations assayed released small amounts of NO, which was chemically unstable and was oxidized to NO2-.
LDH released and NO2- concentration in UW solution after 48 hs of preservation (0oC).
| Preservation experiments | ||
|---|---|---|
| Group | LDH released mUI. g liver-1 | NO2- (μM) |
| IC | ------------ | ------------ |
| IIP48 | 1765 ± 779 n=6 | ------------ |
| IIIPGSNO50 | 2139 ± 296 n=5 | 3.6 ± 0.3 n=3 |
| IVPGSNO100 | 1785 ± 508 n=5 | 7.6 ± 0.6 n=3 |
| VPGSNO250 | 1522 ± 367 n=4 | 23.8 ± 1.4 n=3 |
| VIPGSNO500 | 2284 ± 334 n = 4 | 71.8 ± 8.6 n=3 |
Values are mean ± S.D. LDH release was statistically similar for all groups.
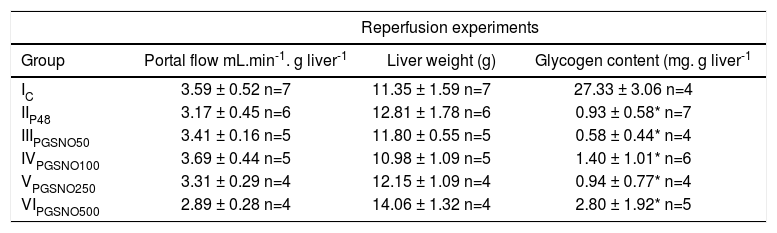
Table II shows the portal flow, final liver weight and hepatic glycogen content of controls and preserved livers after 48 hours of cold storage and reperfusion. There were no statistical differences between all the experimental groups of livers for portal flow and liver weigh. Freshly isolated rat livers without perfusion had a glycogen content of 45.25 ± 5.00 mg.g.liver-1 (n=6). After cold preservation/reperfusion liver glycogen content, diminished dramatically.
Portal flow, liver weight and glycogen content after 60 minutes of reperfusion.
| Reperfusion experiments | |||
|---|---|---|---|
| Group | Portal flow mL.min-1. g liver-1 | Liver weight (g) | Glycogen content (mg. g liver-1 |
| IC | 3.59 ± 0.52 n=7 | 11.35 ± 1.59 n=7 | 27.33 ± 3.06 n=4 |
| IIP48 | 3.17 ± 0.45 n=6 | 12.81 ± 1.78 n=6 | 0.93 ± 0.58* n=7 |
| IIIPGSNO50 | 3.41 ± 0.16 n=5 | 11.80 ± 0.55 n=5 | 0.58 ± 0.44* n=4 |
| IVPGSNO100 | 3.69 ± 0.44 n=5 | 10.98 ± 1.09 n=5 | 1.40 ± 1.01* n=6 |
| VPGSNO250 | 3.31 ± 0.29 n=4 | 12.15 ± 1.09 n=4 | 0.94 ± 0.77* n=4 |
| VIPGSNO500 | 2.89 ± 0.28 n=4 | 14.06 ± 1.32 n=4 | 2.80 ± 1.92* n=5 |
All livers were perfused at constant flow, thus measured pressure values were directly related to vascular resistance. IR obtained during 60 min. of reperfusion at 37 °C from the different groups (I to VI) is shown in Figure 1A. IR of group IC was the lowest among groups. group IIP48 showed a significant increment of IR compared with controls and preserved groups, except with group IVPGS-NO100. The highest values for IR were obtained for groups IIIPGSNO50, VPGSNO250 and VIPGSNO500.
, LDH release (B) and potassium release to perfusate (C) of control and preserved livers, reperfused during 60 min. Values are means ± SD of group IC (n = 6), group IIP48 (n = 6), group IIIPGSNO50 (n = 5) < group IVPGSNO100 (n= 5), group VPGSNO250 (n= 4) and group VIPGSNO500 (n= 4). # significant higher than all groups, p ± 0.05; * significant higher than controls and group IVPGSNO100, p < 0.05; + significant lower than all groups, except group IVPGSNO100, p < 0.05. * significant lower than groups IIP48, IIIPGSNO50 and VPGSNO250, p < 0.05.")
Time course of changes in intrahepatic resistance (A), LDH release (B) and potassium release to perfusate (C) of control and preserved livers, reperfused during 60 min. Values are means ± SD of group IC (n = 6), group IIP48 (n = 6), group IIIPGSNO50 (n = 5) < group IVPGSNO100 (n= 5), group VPGSNO250 (n= 4) and group VIPGSNO500 (n= 4). # significant higher than all groups, p ± 0.05; * significant higher than controls and group IVPGSNO100, p < 0.05; + significant lower than all groups, except group IVPGSNO100, p < 0.05. * significant lower than groups IIP48, IIIPGSNO50 and VPGSNO250, p < 0.05.
Viability parameters recorded during the reperfusion period are shown in Figure 1Band1C.
Figure 1B shows levels of LDH released into the perfusate during 60 min of reperfusion. groups IC, IVPGSN0100 and VIPGSNO500 released the lowest amount of LDH to the perfusato and there were no statistical differences among these groups. LDH released increased significantly in groups IIp48, IIIpGSN050 and VPGSN0250.
Figure 1C shows the effluent/perfusate ratio for K+. There were no statistical differences between groups and the value of this parameter remained close to 1.0 during the reperfusion period.
Bile flow during 1 hour of reperfusion following preservationLivers from group IC started producing bile immediately after initiation of normothermic reperfusion, while in the preserved groups; bile production was initiated 1012 min later. Figure 2 shows bile flow in the six groups of livers during reperfusion. bile flow was consistently and significantly decreased throughout the perfusion period in group IIP48. Within preserved groups, group IVPGS N0100 produced the highest amount of bile, while group IIIPGSN050 produced the lowest one.
, group IIP48 (n = 6) group IIIPGSNO50 (n= 5), group IVPGSNO100 (n = 5) gμp VPGSNO250 (n = 4) and group VIPGSN0500 (n = 4) <. # significant different from all groups, p < 0.05; + significant different from the other treated groups, p < 0.05; * significant lower that all groups, p < 0.05.")
Time course of changes in bile flow of control and preserved livers, reperfused during 60 min. Values are means ± SD of group IC (n= 6), group IIP48 (n = 6) group IIIPGSNO50 (n= 5), group IVPGSNO100 (n = 5) gμp VPGSNO250 (n = 4) and group VIPGSN0500 (n = 4) <. # significant different from all groups, p < 0.05; + significant different from the other treated groups, p < 0.05; * significant lower that all groups, p < 0.05.
Analyzing hematoxilin-eosin stain all groups showed rounded endothelial cells. In all groups some endothelial cells appeared attached to perisinusoidal matrix and the rest seemed to be free into sinusoidal lumen. Endothelial cells were still connected to the perisinusoidal matrix through thin citoplasmatic extensions, showing that these cells not remained free inside sinusoids (Figure 3A).
 and hepatocyte cord. EC are rounded and it is inside sinusoidal lumen (SL). Magnification: 1000x. B) Rabbit anti-human Factor VIII related antigen. group IIP48, arrow shows polarized spots of fluorescent mark concentrated on one side of endothelial cell surface. EC are rounded but attached to hepatocyte cord. Magnification: 1000x. C) Hematoxilin-eosin stain. Dark arrows show rounded endothelial cells either attached to hapatocyte cords or inside sinusoidal lumen. Light arrow show an endothelial cell with normal shape. Magnification: 1000x. D) Phase Contrast Microscopy. The same liver area than photo 3C. Rounded endothelial cells show a light perinu-clear halo (dark arrows) not seen in the ones that conserved their normal shape (light arrow). Magnification: 1000x.")
Hematoxilin-eosin stain. Arrow shows a thin cytoplasmatic connection between endothelial cell (EC) and hepatocyte cord. EC are rounded and it is inside sinusoidal lumen (SL). Magnification: 1000x. B) Rabbit anti-human Factor VIII related antigen. group IIP48, arrow shows polarized spots of fluorescent mark concentrated on one side of endothelial cell surface. EC are rounded but attached to hepatocyte cord. Magnification: 1000x. C) Hematoxilin-eosin stain. Dark arrows show rounded endothelial cells either attached to hapatocyte cords or inside sinusoidal lumen. Light arrow show an endothelial cell with normal shape. Magnification: 1000x. D) Phase Contrast Microscopy. The same liver area than photo 3C. Rounded endothelial cells show a light perinu-clear halo (dark arrows) not seen in the ones that conserved their normal shape (light arrow). Magnification: 1000x.
Rabbit anti-human Factor VIII related antigen identified hepatic endothelial cells and vascular endothelial cells around hepatic vein and vessels of portal areas. Hepatic endothelial cells attached to perisinusoidal matrix conserving their normal shape, showed little spots of fluorescent mark homogeneously distributed on their surfaces. The ones that became rounded and were attached to perisinusoidal matrix had the marks concentrated on one side of the their surfaces (Figure 3B). Endothelial cells inside sinusoidal lumen not showed fluorescent marks. All endothelial vessels cells had fluorescent marks as this was used as a positive control for the immunohistological reaction.
Phase contrast microscopy showed that rounded endothelial cells had a light perinuclear halo not seen in the ones that conserved their normal shape. These halos were observed in all rounded endothelial cells attached either to perisinusoidal matrix or inside sinusoidal lumen (Figures 3Cand3D).
PAS reaction:PAS reaction was negative for hepatocytes of preserved/reperfused groups. Only Kupffer cell were stained with PAS. Group IC showed some areas of hepatocyte that were PAS positive (Figure 4).
 group IC, arrow shows hepatocytes glycogen storages (G). Glycogen is heterogeneously distributed throughout the liver parenchyma. B) group IIP48, C) group IIIPGSNO50, D) group IVPGSNO100, and E) group VPGSNO250, where only Kupffer cells (KC, arrow) were positive for PAS reaction. Magnification: 172x.")
PAS reaction. A) group IC, arrow shows hepatocytes glycogen storages (G). Glycogen is heterogeneously distributed throughout the liver parenchyma. B) group IIP48, C) group IIIPGSNO50, D) group IVPGSNO100, and E) group VPGSNO250, where only Kupffer cells (KC, arrow) were positive for PAS reaction. Magnification: 172x.
The present study was designed to evaluate the effects of GSNO added to the UW solution during cold preservation of rat livers and to analyze its effect during normothermic reperfusion in an IPRL model, so as to establish a relationship between cold storage and graft failure. To this end, cold storage of the liver was performed in UW solution at 0°C up to 48 hours and hepatic hemodynamics and function were studied during reperfusion in the IPRL model. This technique was applied to control and preserved livers with or without GSNO addition.
The constant flow perfusion model was used, because with this system, changes in IR could be evaluated. It also allows studying normal hepatic architecture, microcirculation, and bile production.10
Our work shows that following a cold preservation-reperfusion period, the mean concentration of liver glycogen for all groups was dramatically reduced. Glycogen loss was more pronounced during reperfusion after 48 hs of cold preservation, with or without the addition of GSNO, than controls. As was described by Boudgema et al23the liver glycogen storage is an important metabolite for successful preservation. Glycogen may be the source for ATP and antioxidant synthesis during the reperfusion period. As indicated by the glycogen data, any GSNO concentration did not improve the capacity of UW to maintain adequate glycogen levels.
Looking into a hemodynamic function, it is possible to appreciate a significant increment on IR after 48 hs of hypothermic preservation8 (See Figure 1 for details). When the storage was made with the addition of GSNO to the UW solution, 100μM GSNO was the most effective concentration in preventing the rise on IR. The increment in portal resistance following cold ischemia is thought to reflect and impaired hepatic microcirculation.
LDH released was increased in groups IIP48, IIIPGSNO50 and VPGSNO250. The difference in IIP48 represented cold preservation/reperfusion injury. Livers from group IC released the lowest amount of LDH. Groups IVPGSNO100 and VIPGSNO500 had no statistical differences with group IC. There was no correlation between LDH released in group VIPGSNO500 and other parameters measured in the same group. On the other hand, group IVPGSNO100 not only released small amounts of LDH, but also showed the best bile production. Bile flow is a sensitive index of ischemic injury24 and may be an important predictor of success of liver transplantation.25 LDH released, an index of leakiness of cell membrane, was similar to controls in group IVPGSNO100. The results obtained for both parameters in group IVPGSNO100 let us to think that this group may be in the best functional condition for transplant.
Histological studies shown that damages on endothelial cells were less evident in group IVpgsno100 than in other groups. This group showed less endothelial cells detached from perisinusoidal matrix and so that, they were in less amount inside sinusoidal lumen. Endothelial cells damages were markedly in groups IIIPGSNO50 and VPGSNO250. The presences of a light halo surrounding the endothelial cells nucleus seen with phase contrast microscopy confirm the existence of structures with different refractive indices that changed after cold preservation/reperfusion. These halos were not seen in endothelial cells with normal shape. This could let to suppose that during cold preservation/reperfusion there were changes in the architecture of endothelial cells that involved citoskeleton. This alterations plus cellular detachment from perisinusoidal matrix, led endothelial cells to take into rounded shape. The changes in cellular shape, altered too the expression of factor VIII-related antigen, which appeared on one side of the plasmatic membrane when cells are rounded, but still atached to perisinusoidal matrix. Meanwhile, fluorescent marks disappeared when endothelial cells were inside sinusoidal lumen. The expression of factor VIII could show the loose of endothelial cell viability when adopted a rounded-form inside sinusoid lumen and probably its represented a reversible damage of the ones that showed their fluorescent marks on one side of their plasmatic membranes. Beside, the presence of endothelial cells inside sinusoidal lumen may contribute to increase IR. In groups where hepatocytes exhibit the most altered hemodinamics parameters, endothelial cells appeared with the major morphological alterations.
PAS reaction was negative for liver glycogen content from preserved/reperfused groups. Figure 4 shows areas of hepatocyte from group IC, that are PAS positive and they are not homogeneously distributed within the hepatic parenchyma. However, the amount of glycogen could be quantified in all groups (see table II). An explanation of this results, maybe that the dosage of glucose is a more sensitive technique to determinate liver glycogen content, when this one is in small amounts, than PAS reaction.
Groups VPGSNO250 and VIPGSNO500 produced the highest amount of N02-, and group IIIPGSN050 the lowest one. Since group IIIPGSNO50 showed the worst alteration in all parameters measured, it could be possible that NO concentration produced in this group was not adequate to avoid preservation/reperfusion injuries. Group VIPGSNO100 produced an amount of NO2- nearer to group IIIPGSNO50 than to groups VPGSNO250 and VIPGSNO500 showing an improvement in the results of all parameters studied so, this let us to conclude that the amount of NO produced in this group was enough to protect livers from damages. In relation with groups VPGSNO250 and VIPGSNO500 we could not establish if the amount of NO generated in UW solution might be responsible for hemodynamic and functional alterations seen in group VPGSNO250 or was the fact that group VIPGS-NO500 showed an ambiguous response among the parameters measured.
Taking into account all this findings together we can conclude that, the addition of 100 μM GSNO to UW solution improved hemodynamic and function capacity of cold preserved and then reperfused livers, by preventing the IR rise and LDH release, improving bile production and reducing endothelial cells damages, which could enhance livers graft qualities for transplant.
AcknowledgmentsThe authors acknowledge Histotechnologist Alejandra Inés Martinez and Biologist Luzia Fátima Gonçalvez Caputo for their excellent technical assistance.


