


Background and aims. We conducted an individual participant data (IPD) pooled analysis on the diagnostic accuracy of magnetic resonance elastography (MRE) to detect fibrosis stage in liver transplant recipients.
Material and methods. Through a systematic literature search, we identified studies on diagnostic performance of MRE for staging liver fibrosis, using liver biopsy as gold standard. We contacted study authors for published and unpublished IPD on age, sex, body mass index, liver stiffness, fibrosis stage, degree of inflammation and interval between MRE and biopsy; from these we limited analysis to patients who had undergone liver transplantation. Through pooled analysis using nonparametric two-stage receiver-operating curve (ROC) regression models, we calculated the cluster-adjusted AUROC, sensitivity and specificity of MRE for any (≥ stage 1), significant (≥ stage 2) and advanced fibrosis (≥ stage 3) and cirrhosis (stage 4).
Results. We included 6 cohorts (4 published and 2 unpublished series) reporting on 141 liver transplant recipients (mean age, 57 years; 75.2% male; mean BMI, 27.1 kg/m2). Fibrosis stage distribution stage 0, 1, 2, 3, or 4, was 37.6%, 23.4%, 24.8%, 12% and 2.2%, respectively. Mean AUROC values (and 95% confidence intervals) for diagnosis of any (≥ stage 1), significant (≥ stage 2), or advanced fibrosis (≥ stage 3) and cirrhosis were 0.73 (0.66-0.81), 0.69 (0.62-0.74), 0.83 (0.61-0.88) and 0.96 (0.93-0.98), respectively. Similar diagnostic performance was observed in stratified analysis based on sex, obesity and inflammation grade.
Conclusions. In conclusion, MRE has high diagnostic accuracy for detection of advanced fibrosis and cirrhosis in liver transplant recipients, independent of BMI and degree of inflammation.
Outcomes after orthotopic liver transplant (OLT) have continued to improve with advances in surgical techniques, careful selection of donors and recipients, and improvements in medical management of the recipient. The current 1-year, 5-year, and 10-year survival rates of OLT recipients are 84%, 68%, and 54%, respectively.1 However, recurrence of primary disease, including hepatitis C, non-alcoholic fatty liver disease, autoimmune and cholestatic liver diseases, etc. is not uncommon.2 Hence, transplant recipients continue to be at high risk for development of fibrosis in the allograft, and may be responsible for graft failure in a proportion of patients.
The current gold standard for staging of fibrosis in patients post-transplant is liver biopsy. However, this procedure is invasive, prone to sampling error, with considerable intra- and inter-observer variability in inter-pretation of histology.3 Several non-invasive ultrasound-based imaging tests have been developed, including transient elastography (TE) and acoustic radiation force impulse imaging (ARFI).4 TE has moderate sensitivity and specificity to diagnose advanced fibrosis in transplant recipients; however, these tests evaluate only a limited portion of the liver, have low applicability in obese patients, and findings may be influenced by inflammatory activity, hepatic congestion, cholestasis and fasting status.4
Magnetic resonance elastography (MRE), using a modified phase-contrast imaging sequence to detect propagating shear waves within the liver, provides a highly accurate, non-invasive measure of liver stiffness, evaluating a larger portion of the liver with the option of choosing the region of interest, and overcomes limitations in interpretations due to obesity or ascites.5 In a recent pooled analysis of 697 patients with chronic liver diseases with native livers, we observed high diagnostic accuracy of MRE for diagnosis of significant or advanced fibrosis and cirrhosis, independent of BMI and etiology of chronic liver diseases.6 The overall failure rate of MRE is 4.3%, with the majority of failures due to iron overload. There is limited data on diagnostic performance of MRE for detection and staging fibrosis in liver allografts.
Hence, in this systematic review, we sought to comprehensively evaluate the diagnostic performance of MRE for staging liver fibrosis in patients after OLT, through a pooled analysis of individual participant data (IPD). We performed a priori stratified analysis to assess whether sex, obesity and degree of inflammation influence the diagnostic performance of MRE. Through IPD, we were able to obtain published and unpublished data from multiple collaborators globally.
Material and MethodsThis IPD pooled analysis was conducted and reported according to the Preferred Reporting Items for Systematic Reviews and Meta-Analyses (PRISMA) guidelines and recommendations from Riley, et at.7 The process followed an a priori established protocol. This was exempt from ethical approval as the analysis involved only de-identified data, and all individual studies had received local ethics approval.
Selection criteria and search strategyWe included all studies that met the following inclusion criteria:
- •
Evaluated the diagnostic performance of MRE as the index test.
- •
Using liver biopsy as the gold standard.
- •
Both performed within 1 year of each other.
- •
Reported fibrosis using a comparable liver biopsy staging system (Brunt, NASH CRN Histologic Scoring System, Metavir, NAS fibrosis score, Desmet).
- •
In adult patients who had undergone liver transplantation, and
- •
Investigators were able to share IPD.
Inclusion was not otherwise restricted by study size, language or publication type. We excluded studies (and patients from individual studies) in which MRE was not the diagnostic test, liver biopsy was not the gold standard, the interval between MRE and liver biopsy was > 1 year, or sufficient IPD could not be obtained despite two attempts to contact study investigators. Besides published reports, we also sought data from collaborators on unpublished experience with MRE in the post-OLT setting. Details of the search strategy and method of obtained IPD are reported in the supplementary appendix.
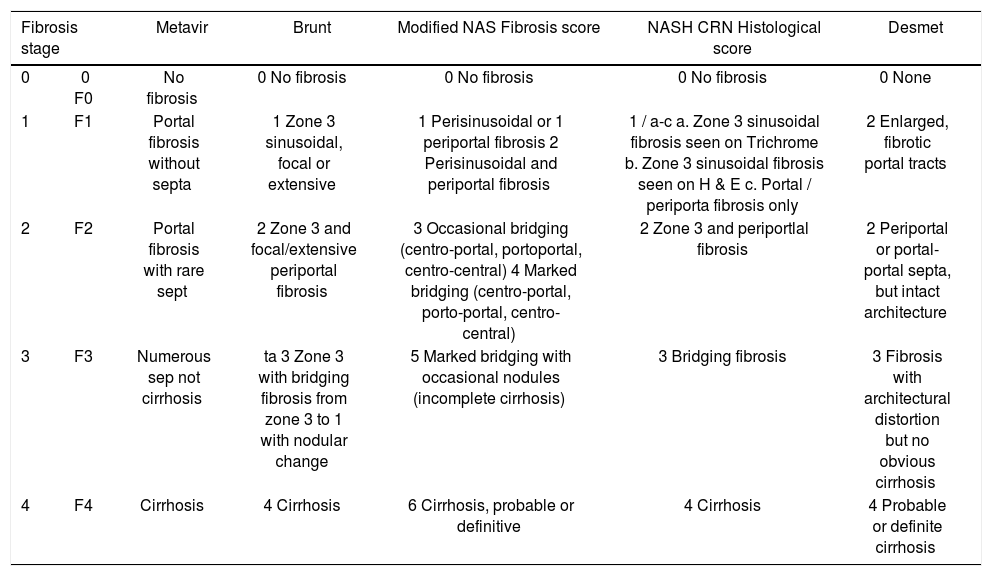
Data abstraction and quality assessmentThe following IPD from each study was requested on patients who had undergone OLT - age at time of MRE, sex, body mass index (BMI), technique and reported liver stiffness on MRE, fibrosis stage on liver biopsy (and classification system used) and degree of inflammation on liver biopsy (0: no active inflammation; 1: minimal inflammation; 2: moderate inflammation; 3: severe inflammation).8 To allow homogeneous comparison of liver fibrosis staging, we asked all groups to transform their reporting of fibrosis stage in accordance with a simplified 5-stage fibrosis scoring system, as reported in appendix 1.
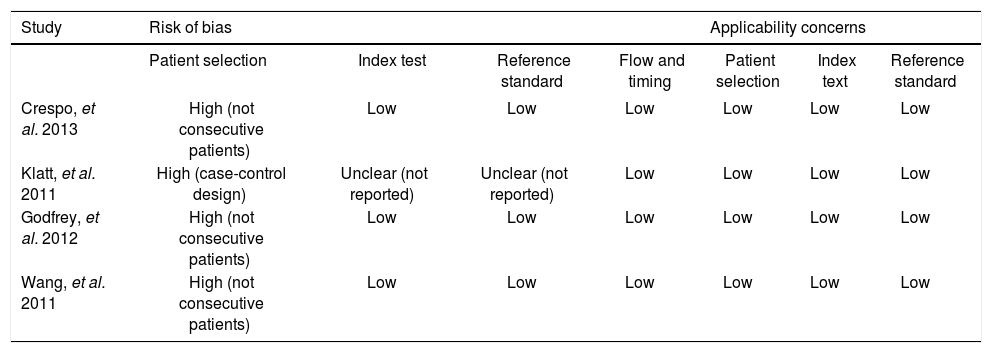
Quality of included studies was assessed using the Quality Assessment of Diagnostic Accuracy Studies 2 (QUADAS 2) tool, in which studies were rated based on risk of bias in patient selection, index test, reference standard and patient flow and timing, and on applicability to clinical practice in terms of patient selection, index test and reference standard.9
Outcomes assessedThe primary outcome of interest was the diagnostic performance of MRE for the diagnosis of any (≥ stage 1), significant (≥ stage 2) and advanced fibrosis (≥ stage 3) and cirrhosis (stage 4) in post-OLT patients, compared with the reference standard of liver biopsy. Results were reported as sensitivity, specificity, area under receiver-operating curve (AUROC) with corresponding MRE stiffness cut-offs.
We performed several pre-planned subgroup and stratified analysis based on sex (males vs. females), presence of obesity (BMI ≥ 30kg/m2vs. < 30kg/m2) and degree of inflammatory activity (none-mild [0-1] vs. moderate-severe [2-3]).
Statistical analysisWe performed descriptive analyses, reporting mean (standard deviation) or median (interquartile range) for continuous variables. We then calculated the AUROC by pooling IPD across the included studies using the non-parametric two-stage model proposed by Pepe, et at.10 The correlation within each study was adjusted through clustering. We estimated the 95% confidence interval (95% CI) using bootstrapping with replacement in 10,000 replications. Sensitivity and specificity of MRE and corresponding cut-offs were estimated using Youden index.11 From pooled sensitivity and specificity, we estimated the positive and negative likelihood ratios (LR), with a positive LR > 5 and a negative LR < 0.2 suggesting strong diagnostic evidence.12 To compare the difference of AUROCs between subgroups, we used the interaction test proposed by Altman and Bland for comparisons with two estimates and one-way ANOVA for comparisons with more than two estimates.13
All statistical analyses were conducted using STATA version 12.1 (StataCorp LP, College Station, TX).
ResultsFrom 549 unique studies identified using our search strategy, we identified four published studies reporting on diagnostic performance of MRE in post-OLT patients.14–17 Additionally, we were able to obtain data on two unpublished cohorts of Mayo Clinic at Rochester and at Scottsdale (personal communication with Alvin Silva). Figure 1 shows the study identification and selection flowchart.
Characteristics of included studies
We analyzed IPD from 6 cohorts, with 141 unique post-OLT patients. Four studies were conducted in USA, and 2 studies were conducted in Europe. All the studies used 1.5T MRI scanners, with shear waves generated at 60-62.5Hz.Overall, these studies were at low risk of bias, except for patient selection, which was not consecutive or random (see Appendix, supplementary table 3).
The mean age of the pooled cohort was 57±9 years and 75.2% were males. Mean BMI was 27.1±5.7 kg/m2 (n = 129 patients), with 29.4% classified as obese. The distribution of fibrosis in the pooled cohort was: stage 0 37.6%, stage 1 23.4%, stage 2 24.8%, stage 3 12.0% and stage 4 2.2%; accordingly, 62.4% had any fibrosis (≥ stage 1), 39.0% had significant fibrosis (≥ stage 2), 14.2% had advanced fibrosis (≥ stage 3) and 2.2% had cirrhosis. Distribution of histological inflammatory activity grade was as follows: 18.4% had no active inflammation, 38.3% had minimal inflammation, 31.9% had moderate inflammation and 11.4% had severe inflammation. 138had hepatitis C (including 33 patients with associated hepatocellular cancer) and 3 patients had alcoholic liver disease. Appendix, supplementary table 1 includes details on all individual participants.
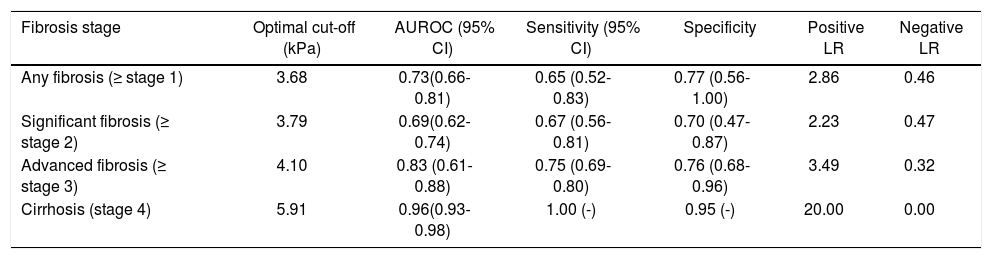
Diagnostic accuracy of MREThe mean liver stiffness across the entire cohort was 3.86±1.45kPa, ranging from 1.6-9.3 kPa. On cluster-adjusted pooled analysis, the AUROC of MRE for diagnosis of any (≥ stage 1), significant (≥ stage 2) or advanced fibrosis (≥ stage 3) and cirrhosis was 0.73, 0.69, 0.83 and 0.96, respectively, suggesting good to excellent discriminative ability for detection of advanced fibrosis and cirrhosis, and fair discriminative ability for detection of any fibrosis (Table 1). The corresponding MRE liver stiffness cut-offs were 3.68, 3.71, 4.10 and 5.91 kPa, respectively. We were unable to estimate a positive and negative predictive value due to variability of prevalence depending on clinical setting in which MRE is used.
Pooled analysis of the diagnostic performance of magnetic resonance elastography for diagnosis and staging of liver fibrosis, based on 141 patients from 6 independent cohorts.
| Fibrosis stage | Optimal cut-off (kPa) | AUROC (95% CI) | Sensitivity (95% CI) | Specificity | Positive LR | Negative LR |
|---|---|---|---|---|---|---|
| Any fibrosis (≥ stage 1) | 3.68 | 0.73(0.66-0.81) | 0.65 (0.52-0.83) | 0.77 (0.56-1.00) | 2.86 | 0.46 |
| Significant fibrosis (≥ stage 2) | 3.79 | 0.69(0.62-0.74) | 0.67 (0.56-0.81) | 0.70 (0.47-0.87) | 2.23 | 0.47 |
| Advanced fibrosis (≥ stage 3) | 4.10 | 0.83 (0.61-0.88) | 0.75 (0.69-0.80) | 0.76 (0.68-0.96) | 3.49 | 0.32 |
| Cirrhosis (stage 4) | 5.91 | 0.96(0.93-0.98) | 1.00 (-) | 0.95 (-) | 20.00 | 0.00 |
AUROC: area under receiver-operating curve. CI: confidence intervals. LR: likelihiood ratio.
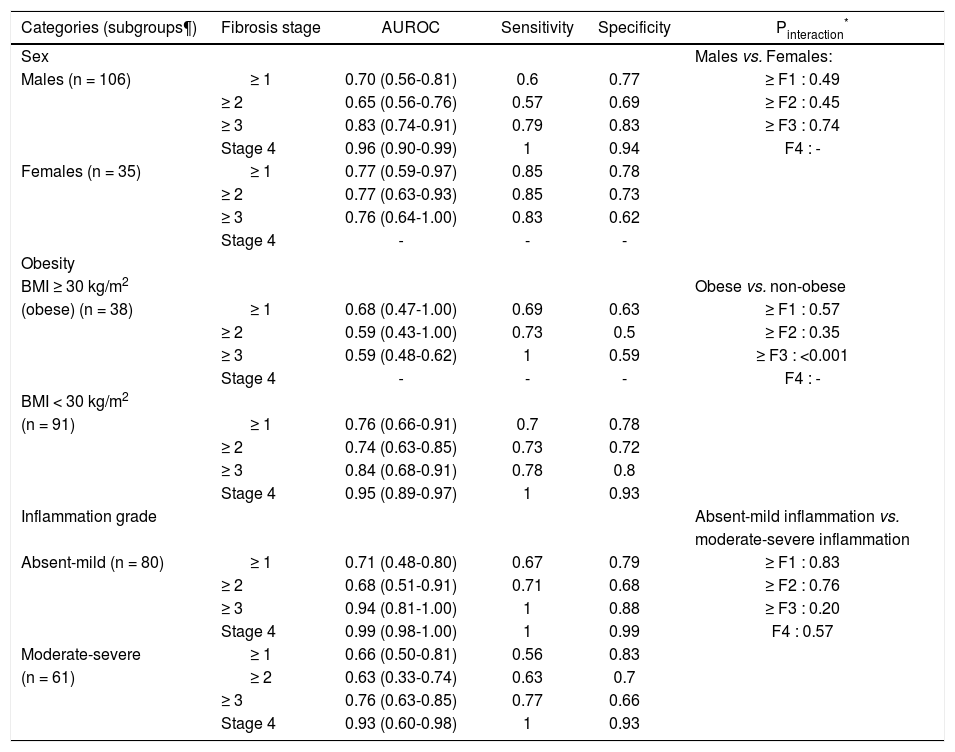
On subgroup analysis, the diagnostic performance of MRE was comparable in males and females (Table 2). The presence or absence of obesity also did not significantly influence the diagnostic accuracy for MRE, except a higher diagnostic accuracy for detection of advanced fibrosis in non-obese as compared to obese. Likewise, the degree of inflammatory activity on liver biopsy did not significantly influence the diagnostic accuracy of MRE for detection of any fibrosis stage.
Subgroup analyses. Diagnostic performance of MRE, stratified by sex, presence or absence of obesity and degree of inflammatory activity.
| Categories (subgroups¶) | Fibrosis stage | AUROC | Sensitivity | Specificity | Pinteraction* |
|---|---|---|---|---|---|
| Sex | Males vs. Females: | ||||
| Males (n = 106) | ≥ 1 | 0.70 (0.56-0.81) | 0.6 | 0.77 | ≥ F1 : 0.49 |
| ≥ 2 | 0.65 (0.56-0.76) | 0.57 | 0.69 | ≥ F2 : 0.45 | |
| ≥ 3 | 0.83 (0.74-0.91) | 0.79 | 0.83 | ≥ F3 : 0.74 | |
| Stage 4 | 0.96 (0.90-0.99) | 1 | 0.94 | F4 : - | |
| Females (n = 35) | ≥ 1 | 0.77 (0.59-0.97) | 0.85 | 0.78 | |
| ≥ 2 | 0.77 (0.63-0.93) | 0.85 | 0.73 | ||
| ≥ 3 | 0.76 (0.64-1.00) | 0.83 | 0.62 | ||
| Stage 4 | - | - | - | ||
| Obesity | |||||
| BMI ≥ 30 kg/m2 | Obese vs. non-obese | ||||
| (obese) (n = 38) | ≥ 1 | 0.68 (0.47-1.00) | 0.69 | 0.63 | ≥ F1 : 0.57 |
| ≥ 2 | 0.59 (0.43-1.00) | 0.73 | 0.5 | ≥ F2 : 0.35 | |
| ≥ 3 | 0.59 (0.48-0.62) | 1 | 0.59 | ≥ F3 : <0.001 | |
| Stage 4 | - | - | - | F4 : - | |
| BMI < 30 kg/m2 | |||||
| (n = 91) | ≥ 1 | 0.76 (0.66-0.91) | 0.7 | 0.78 | |
| ≥ 2 | 0.74 (0.63-0.85) | 0.73 | 0.72 | ||
| ≥ 3 | 0.84 (0.68-0.91) | 0.78 | 0.8 | ||
| Stage 4 | 0.95 (0.89-0.97) | 1 | 0.93 | ||
| Inflammation grade | Absent-mild inflammation vs. | ||||
| moderate-severe inflammation | |||||
| Absent-mild (n = 80) | ≥ 1 | 0.71 (0.48-0.80) | 0.67 | 0.79 | ≥ F1 : 0.83 |
| ≥ 2 | 0.68 (0.51-0.91) | 0.71 | 0.68 | ≥ F2 : 0.76 | |
| ≥ 3 | 0.94 (0.81-1.00) | 1 | 0.88 | ≥ F3 : 0.20 | |
| Stage 4 | 0.99 (0.98-1.00) | 1 | 0.99 | F4 : 0.57 | |
| Moderate-severe | ≥ 1 | 0.66 (0.50-0.81) | 0.56 | 0.83 | |
| (n = 61) | ≥ 2 | 0.63 (0.33-0.74) | 0.63 | 0.7 | |
| ≥ 3 | 0.76 (0.63-0.85) | 0.77 | 0.66 | ||
| Stage 4 | 0.93 (0.60-0.98) | 1 | 0.93 |
AUROC: area under receiver operating curve. BMI: body mass index. MRE: magnetic resonance elastography.
Represents the comparison of diagnostic performance of MRE between subgroups (males vs. females, obese vs. non-obese, none-mild vs. moderate-severe inflammation) for each corresponding fibrosis stage (any, significant, advanced fibrosis and cirrhosis). To compare the difference of AUROCs between subgroups, we used the interaction test proposed by Altman and Bland for comparisons with two estimates.
In this systematic review and IPD pooled analysis of diagnostic performance of MRE in 6 independent cohorts with 141 post-OLT patients, we made several key observations. First, the overall diagnostic accuracy of MRE in patients after liver transplantation for discriminating advanced fibrosis (≥ stage 3) is good with an AUROC of 0.83. The optimal cut-off of MRE for diagnosis of any, significant and advanced fibrosis and cirrhosis derived from this pooled analysis of patients with CLD is 3.68, 3.71, 4.10 and 5.91 kPa, respectively. Second, the diagnostic performance of MRE is robust and stable, independent of sex and obesity. Third, in our pooled analysis, we did not observe a significant difference in the diagnostic performance of MRE in patients with increasing inflammatory activity.
As compared to the diagnostic performance of MRE in patients with chronic liver diseases with native livers, its performance in the post-transplant setting is comparable for detection of cirrhosis, but inferior for detection of any, significant and advanced fibrosis. In our previous IPD analysis on 697 patients with native livers, the mean AUROC values for the diagnosis of any (≥ stage 1), significant (≥ stage 2), advanced fibrosis (≥ stage 3), and cirrhosis, were 0.84, 0.88, 0.93 and 0.92, respectively.6 This may be related to biological differences in native and allograft livers. There is altered vascular anatomy secondary to anastomosis, which modifies blood flow to the liver. The allograft is also subject to background inflammation related to rejection, which may account for variability in stiffness. Finally, immunosuppression may modify the dynamics of deposition of fibrosis, and introduce variability in fibrosis progression rate.
There are no head-to-head comparisons of MRE and ultrasound-based methods of fibrosis assessment, TE and ARFI for liver transplants. In a study-level meta-analysis of TE studies in the post-transplant setting, our group had previously observed pooled sensitivity and specificity of 98 and 84%, respectively for detection of cirrhosis; the corresponding numbers in our IPD analysis of MRE are 100 and 95%, respectively.18 Study-level diagnostic accuracy meta-analysis of aggregate data have several limitations including:
- •
Overestimation of diagnostic performance due to spectrum bias.
- •
Selective reporting bias in individual studies (and inability to account for those at an aggregate level).
- •
Potential overlap of patients across studies which results in double-counting.
- •
Inability to identify an optimal diagnostic threshold.
- •
High degree of heterogeneity (due to differences in patient characteristics, diagnostic thresholds in individual studies, etc.) and
- •
Limited subgroup analyses to examine stability of association and sources of heterogeneity.
Failure rate of TE is significantly higher than MRE, especially in obese patients. In a single center prospective study of over 13,000 TE exams, the rate of failed or unreliable TE measurements in obese patients was 16.9 and 35.4%;(19) similarly, the rate of unreliable ARFI exams in obese patients was 17.6%.20 Obesity, in particular high waist circumference, has also been associated with higher discordance with biopsy findings with both over- and underestimation of fibrosis stage.21,22 With the use of XL probe for TE, this failure rate is lower but still continues to be higher than that observed for MRE.23 We observed that the diagnostic performance of MRE was largely unaffected by obesity, with comparable AUROCs in obese and non-obese patients, except in detection of advanced fibrosis. The failure rate of MRE is < 5% and usually related to iron overload; newer improved sequences are available to perform MRE in patients with iron overload, and it is anticipated that the failure rate would decrease to < 1%. Studies on transplant livers in obese recipients are lacking and a future study with direct comparison of TE and MRE and other elastography techniques in obese subjects may be useful to determine clinical utility.
Recent studies have suggested that chronic inflammatory activity may influence TE-measured liver stiffness in patients at all stages of fibrosis and is a strong confounding variable.24 In our pooled analysis, the diagnostic accuracy of MRE for detection of fibrosis was not significantly influenced by presence of severe inflammation. However, in a recent study, Ichikawa et al have observed that hepatitis activity grade may also influence liver stiffness measured using MRE.25 Large, prospective studies are needed to study the influence of inflammation on MRE-measured liver stiffness.
Strengths and limitationsUsing participant level data, through collaboration with multiple research groups, we were able to overcome limitations of study-level meta-analysis by:
- •
Being able to abstract data only on patients post-LT including unpublished reports from centers.
- •
Using standardized statistical analysis across studies.
- •
Adjusting for baseline potential confounding factors (like sex, obesity, inflammatory activity etc.).
- •
Accounting for missing data and minimizing overlapping data in different studies.
- •
Decreasing selective reporting bias.
- •
Minimizing spectrum bias and
- •
Assessing robustness of association and sources of heterogeneity using stratified analysis.
Hence, AUROC derived from this IPD pooled analysis represents a more reliable, accurate and real-world diagnostic performance of MRE for staging hepatic fibrosis.
There were several limitations in our study. First, our analysis was only able to evaluate the diagnostic performance of MRE performed at 60-62.5 Hz, and not at 50 Hz as is practiced in certain parts of Europe. Studies using MRE performed at 50 Hz have suggested a similar high diagnostic accuracy for detection of significant and advanced fibrosis.26,27 Second, while IPD pooled analysis was able to alleviate several of the limitations of a conventional aggregate data meta-analysis, ours was still a retrospective analysis with several inherent variations due to lack of standardized performance of index test and lack of centralized reading of biopsies. Variable liver fibrosis staging systems were used in individual studies. We tried to improve comparability by a priori requesting investigators to transform fibrosis stages into a simplified 5-stage fibrosis scoring system; however, such a transformation may result in misclassification. Our study group mainly comprised of chronic hepatitis C patients resulting in OLT (138/141 = 98%) whether MRE has similar diagnostic performance in patients who undergo OLT for other indications is unknown. In our previous pooled analysis of diagnostic performance of MRE in patients with native liver, we did not observe any significant difference in the diagnostic performance based on underlying etiology of chronic liver disease. Third, despite pooling data from 6 cohorts, we had a relatively small sample size, limiting inferences from subgroup analyses. Fourth, though we were able to identify optimal diagnostic thresholds, these should be interpreted cautiously and require prospective validation in a well-defined population; these thresholds are likely to vary depending on practice where MRE is applied. Fifth, the gold standard in these included studies was liver biopsy. Liver biopsy itself is not a perfect gold standard, since it samples only 1/50,000 of total liver mass and significant discrepancy in fibrosis stage as high as 33% can be observed depending on site of liver biopsy.3 It is conceivable that the diagnostic accuracy of MRE may in fact be higher given its ability to globally evaluate the liver. Further studies are needed to systematically reassess the mis-classified patients to further calibrate the true diagnostic accuracy of MRE.
ConclusionIn conclusion, through a systematic review and IPD pooled analysis, we observed that MRE is an accurate, non-invasive technique for detection of advanced liver fibrosis in patients after liver transplantation, which is not significantly influenced by sex, obesity and degree of inflammation. Longitudinal studies are needed to assess whether changes in MRE-derived liver stiffness predict long-term allograft outcomes. Comparative prospective studies of ultrasound-based elastographic techniques like TE and ARFI, and MRE are warranted.
DisclosuresThis work is supported in part by National Institute of Health (NIH) grant EB001981 to MY, JC and RLE. MY, JC, RLE and the Mayo Clinic have intellectual property relating to the subject and may be eligible for royalties from licensing. RLE is CEO of Resoundant, Inc. This research has been reviewed by the Mayo Clinic Conflict of Interest Review Board and is being conducted in compliance with Mayo Clinic Conflict of Interest policies. None of the other authors have any disclosures.
Author Contributions- •
Study concept and design: SS, SKV.
- •
Acquisition of data: SS, SKV, AK, FHM, AS, PA, EMG, ACS.
- •
Statistical analysis: ZW, MHM, SS, SKV.
- •
Interpretation of results: SS, SKV.
- •
Drafting of the manuscript: SS.
- •
Critical revision of the manuscript for important intellectual content: SKV, AK, FHM, AS, PA, EMG, ACS, ZW, MHM, JAT, RLE.
- •
Approval of the final manuscript: SS, SKV, AK, FHM, AS, PA, EMG, ACS, ZW, MHM, JAT, RLE.
- •
Study supervision: SKV.
We wish to thank Ms. Patricia Erwin, M.L.S., Senior Medical Librarian at the Mayo Clinic Library for helping in the literature search for this systematic review and meta-analysis.
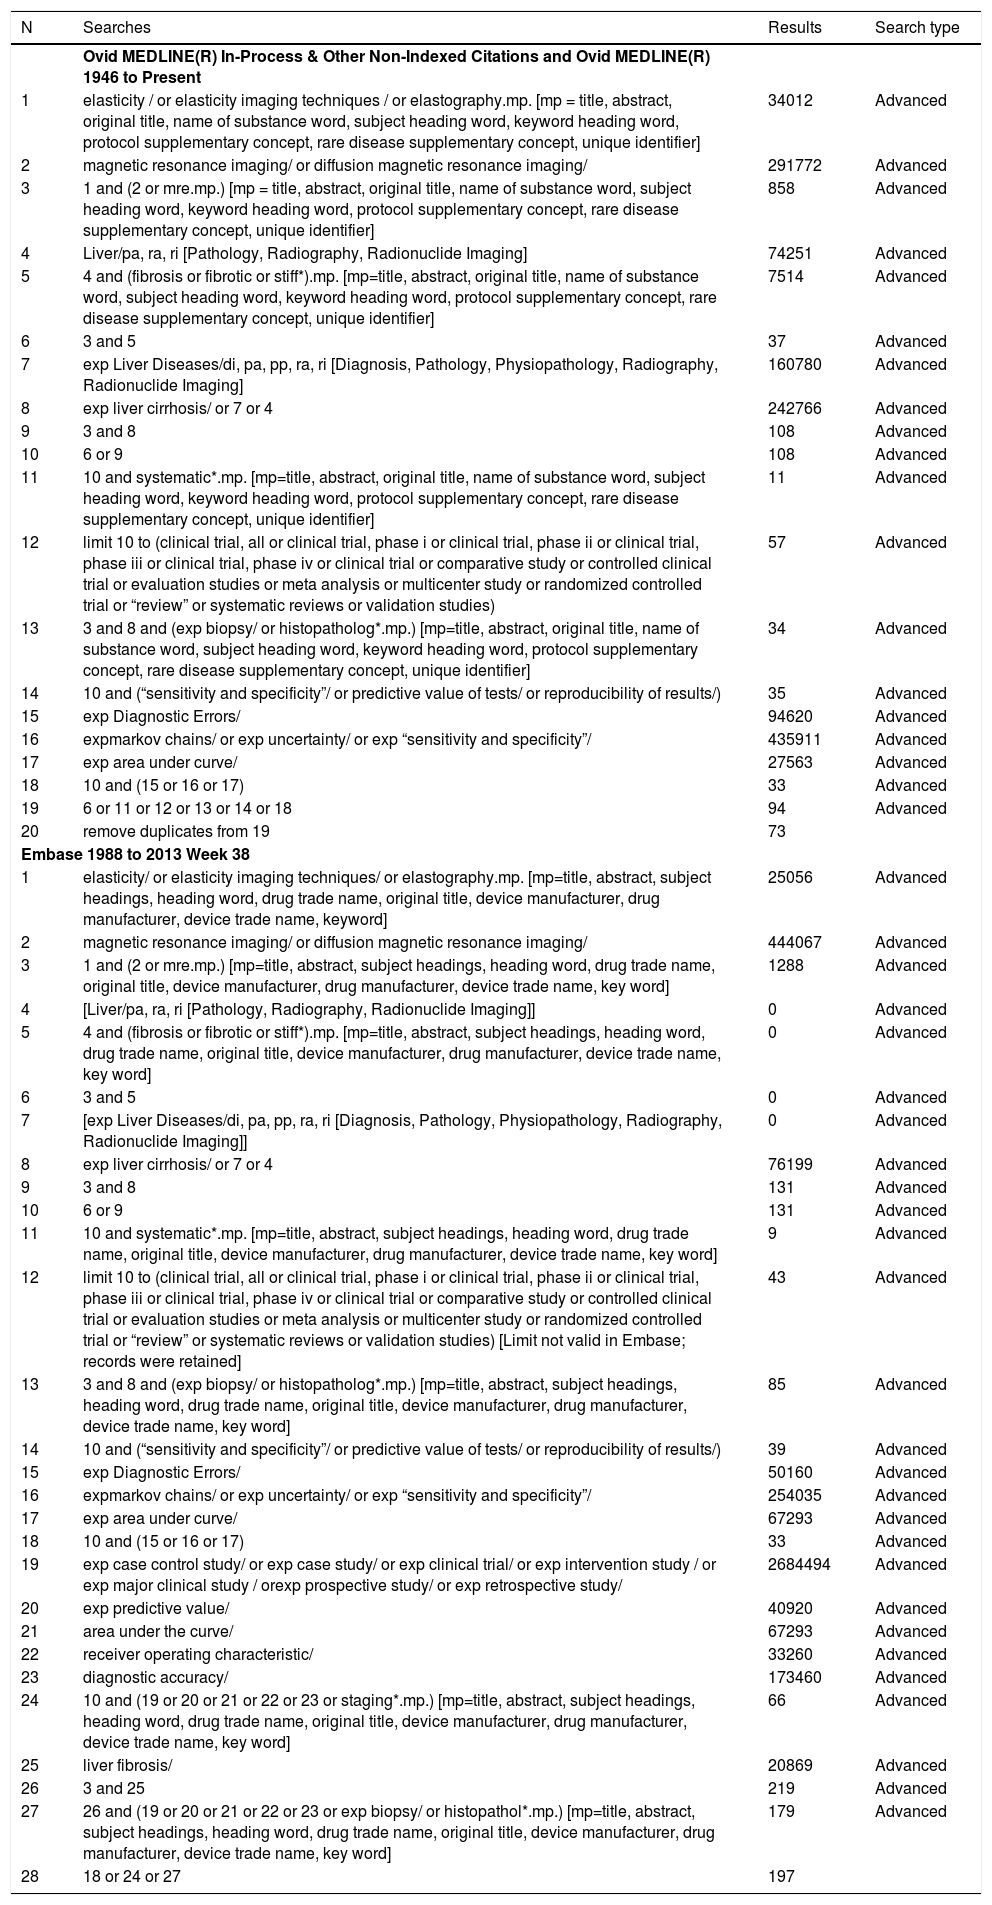
AppendixMethodsSearch strategyFirst, we conducted a computer-aided systematic literature search of Medline, Embase, Web of Science and Scopus, from January 1, 2003 through September 22, 2013, with the help of an expert medical librarian, to identify all relevant articles on MRE in staging liver fibrosis. We updated this search on September 30, 2014, and did not identify any new unique studies. Details of the search strategy are available in the supplementary appendix. Briefly, a combination of key words and medical subject heading (MeSH) terms were used including (mr OR “magnetic resonance”) AND (elastography OR elasticity OR MRE) AND (liver OR hepatic OR fibrosis) AND (Sensitiv* OR value* OR performance OR accura* OR compar* OR predict*). This search was updated on October 31, 2014 to identify additional studies published in the interval since the last search. Subsequently, two investigators (SS, SKV) independently reviewed the title and abstract of studies identified in the search to exclude studies that did not answer the research question of interest, based on pre-specified inclusion and exclusion criteria. The full text of the remaining articles was reviewed, to determine whether it contained relevant information with regards to diagnostic accuracy of MRE in patients after liver transplantation. Next, we manually searched the bibliographies of the selected articles, as well as review articles on the topic for additional studies that may have been missed. Third, we performed a manual search of conference proceedings from major gastroenterology and hepatology meetings (American Association for the Study of the Liver, European Association for the Study of the Liver, Digestive Diseases Week, from 2010 to 2013) for additional abstracts on the topic.
Scheme for reconciling all fibrosis stages (for different etiologies of chronic liver disease) into a comparable 5-stage system used in our pooled analysis.
| Fibrosis stage | Metavir | Brunt | Modified NAS Fibrosis score | NASH CRN Histological score | Desmet | |
|---|---|---|---|---|---|---|
| 0 | 0 F0 | No fibrosis | 0 No fibrosis | 0 No fibrosis | 0 No fibrosis | 0 None |
| 1 | F1 | Portal fibrosis without septa | 1 Zone 3 sinusoidal, focal or extensive | 1 Perisinusoidal or 1 periportal fibrosis 2 Perisinusoidal and periportal fibrosis | 1 / a-c a. Zone 3 sinusoidal fibrosis seen on Trichrome b. Zone 3 sinusoidal fibrosis seen on H & E c. Portal / periporta fibrosis only | 2 Enlarged, fibrotic portal tracts |
| 2 | F2 | Portal fibrosis with rare sept | 2 Zone 3 and focal/extensive periportal fibrosis | 3 Occasional bridging (centro-portal, portoportal, centro-central) 4 Marked bridging (centro-portal, porto-portal, centro-central) | 2 Zone 3 and periportlal fibrosis | 2 Periportal or portal-portal septa, but intact architecture |
| 3 | F3 | Numerous sep not cirrhosis | ta 3 Zone 3 with bridging fibrosis from zone 3 to 1 with nodular change | 5 Marked bridging with occasional nodules (incomplete cirrhosis) | 3 Bridging fibrosis | 3 Fibrosis with architectural distortion but no obvious cirrhosis |
| 4 | F4 | Cirrhosis | 4 Cirrhosis | 6 Cirrhosis, probable or definitive | 4 Cirrhosis | 4 Probable or definite cirrhosis |
Once relevant studies were identified, we contacted the corresponding author of eligible studies using electronic mail including a cover letter detailing the objectives of the collaborative pooled analysis, background information on IPD pooled analysis, and a Microsoft Excel document containing a data collection file for input of individual patient results for the project. In case of non-response, we sent another reminder email 2-4 weeks after the first; if there was no response to the 2nd email, then the study was excluded from our analysis. For investigators that responded, we obtained information on any potential overlap of patients in case of multiple related publications, and also sought unpublished data that may be eligible for inclusion in the pooled analysis if the inclusion criteria were met.
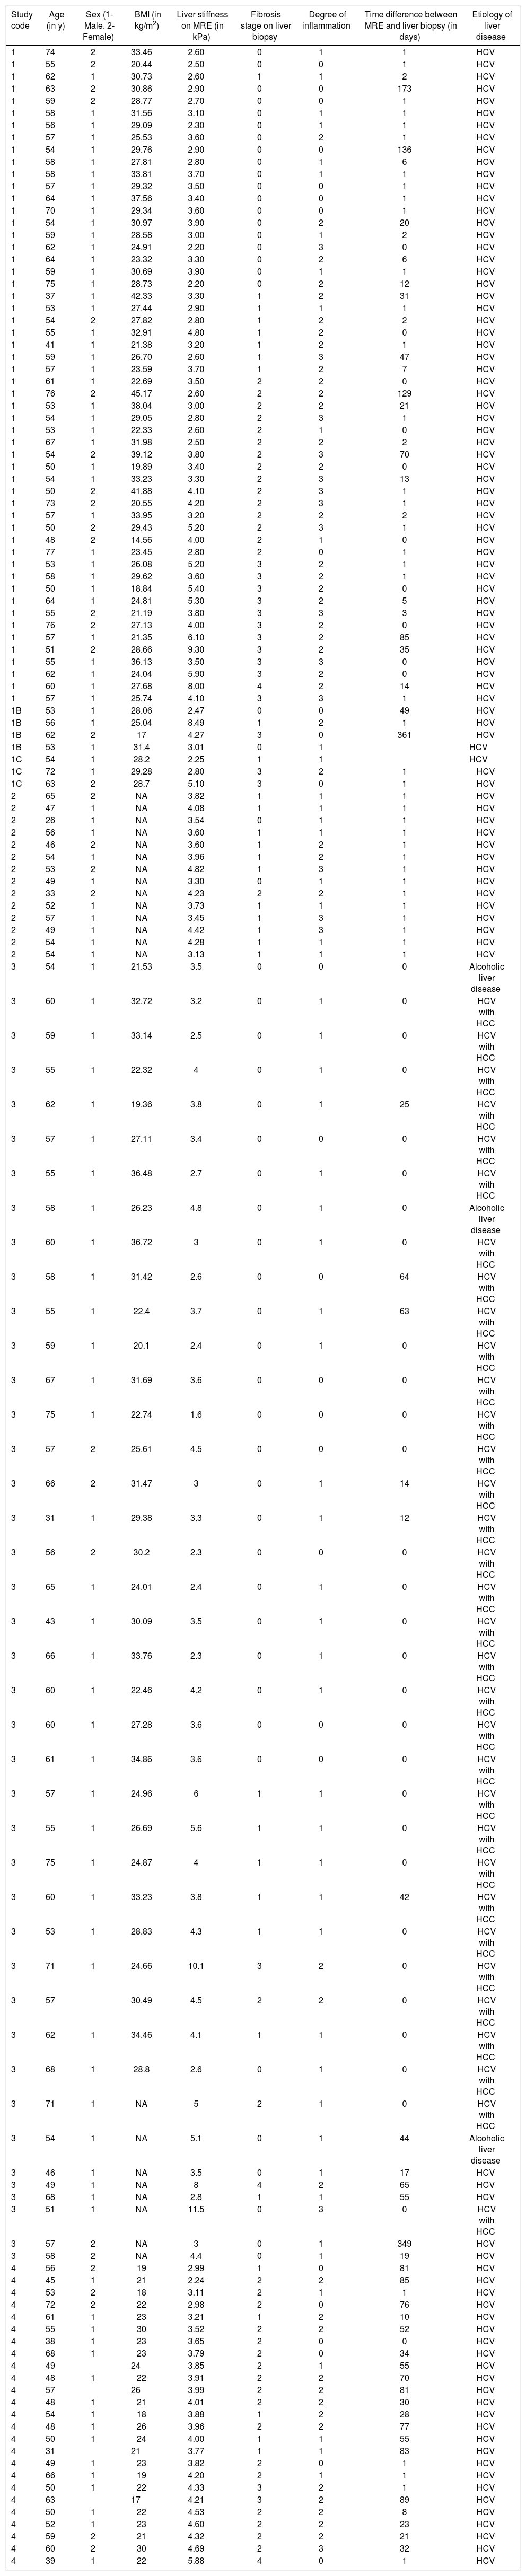
Characteristics of individual participants in the pooled analysis.
| Study code | Age (in y) | Sex (1-Male, 2-Female) | BMI (in kg/m2) | Liver stiffness on MRE (in kPa) | Fibrosis stage on liver biopsy | Degree of inflammation | Time difference between MRE and liver biopsy (in days) | Etiology of liver disease |
|---|---|---|---|---|---|---|---|---|
| 1 | 74 | 2 | 33.46 | 2.60 | 0 | 1 | 1 | HCV |
| 1 | 55 | 2 | 20.44 | 2.50 | 0 | 0 | 1 | HCV |
| 1 | 62 | 1 | 30.73 | 2.60 | 1 | 1 | 2 | HCV |
| 1 | 63 | 2 | 30.86 | 2.90 | 0 | 0 | 173 | HCV |
| 1 | 59 | 2 | 28.77 | 2.70 | 0 | 0 | 1 | HCV |
| 1 | 58 | 1 | 31.56 | 3.10 | 0 | 1 | 1 | HCV |
| 1 | 56 | 1 | 29.09 | 2.30 | 0 | 1 | 1 | HCV |
| 1 | 57 | 1 | 25.53 | 3.60 | 0 | 2 | 1 | HCV |
| 1 | 54 | 1 | 29.76 | 2.90 | 0 | 0 | 136 | HCV |
| 1 | 58 | 1 | 27.81 | 2.80 | 0 | 1 | 6 | HCV |
| 1 | 58 | 1 | 33.81 | 3.70 | 0 | 1 | 1 | HCV |
| 1 | 57 | 1 | 29.32 | 3.50 | 0 | 0 | 1 | HCV |
| 1 | 64 | 1 | 37.56 | 3.40 | 0 | 0 | 1 | HCV |
| 1 | 70 | 1 | 29.34 | 3.60 | 0 | 0 | 1 | HCV |
| 1 | 54 | 1 | 30.97 | 3.90 | 0 | 2 | 20 | HCV |
| 1 | 59 | 1 | 28.58 | 3.00 | 0 | 1 | 2 | HCV |
| 1 | 62 | 1 | 24.91 | 2.20 | 0 | 3 | 0 | HCV |
| 1 | 64 | 1 | 23.32 | 3.30 | 0 | 2 | 6 | HCV |
| 1 | 59 | 1 | 30.69 | 3.90 | 0 | 1 | 1 | HCV |
| 1 | 75 | 1 | 28.73 | 2.20 | 0 | 2 | 12 | HCV |
| 1 | 37 | 1 | 42.33 | 3.30 | 1 | 2 | 31 | HCV |
| 1 | 53 | 1 | 27.44 | 2.90 | 1 | 1 | 1 | HCV |
| 1 | 54 | 2 | 27.82 | 2.80 | 1 | 2 | 2 | HCV |
| 1 | 55 | 1 | 32.91 | 4.80 | 1 | 2 | 0 | HCV |
| 1 | 41 | 1 | 21.38 | 3.20 | 1 | 2 | 1 | HCV |
| 1 | 59 | 1 | 26.70 | 2.60 | 1 | 3 | 47 | HCV |
| 1 | 57 | 1 | 23.59 | 3.70 | 1 | 2 | 7 | HCV |
| 1 | 61 | 1 | 22.69 | 3.50 | 2 | 2 | 0 | HCV |
| 1 | 76 | 2 | 45.17 | 2.60 | 2 | 2 | 129 | HCV |
| 1 | 53 | 1 | 38.04 | 3.00 | 2 | 2 | 21 | HCV |
| 1 | 54 | 1 | 29.05 | 2.80 | 2 | 3 | 1 | HCV |
| 1 | 53 | 1 | 22.33 | 2.60 | 2 | 1 | 0 | HCV |
| 1 | 67 | 1 | 31.98 | 2.50 | 2 | 2 | 2 | HCV |
| 1 | 54 | 2 | 39.12 | 3.80 | 2 | 3 | 70 | HCV |
| 1 | 50 | 1 | 19.89 | 3.40 | 2 | 2 | 0 | HCV |
| 1 | 54 | 1 | 33.23 | 3.30 | 2 | 3 | 13 | HCV |
| 1 | 50 | 2 | 41.88 | 4.10 | 2 | 3 | 1 | HCV |
| 1 | 73 | 2 | 20.55 | 4.20 | 2 | 3 | 1 | HCV |
| 1 | 57 | 1 | 33.95 | 3.20 | 2 | 2 | 2 | HCV |
| 1 | 50 | 2 | 29.43 | 5.20 | 2 | 3 | 1 | HCV |
| 1 | 48 | 2 | 14.56 | 4.00 | 2 | 1 | 0 | HCV |
| 1 | 77 | 1 | 23.45 | 2.80 | 2 | 0 | 1 | HCV |
| 1 | 53 | 1 | 26.08 | 5.20 | 3 | 2 | 1 | HCV |
| 1 | 58 | 1 | 29.62 | 3.60 | 3 | 2 | 1 | HCV |
| 1 | 50 | 1 | 18.84 | 5.40 | 3 | 2 | 0 | HCV |
| 1 | 64 | 1 | 24.81 | 5.30 | 3 | 2 | 5 | HCV |
| 1 | 55 | 2 | 21.19 | 3.80 | 3 | 3 | 3 | HCV |
| 1 | 76 | 2 | 27.13 | 4.00 | 3 | 2 | 0 | HCV |
| 1 | 57 | 1 | 21.35 | 6.10 | 3 | 2 | 85 | HCV |
| 1 | 51 | 2 | 28.66 | 9.30 | 3 | 2 | 35 | HCV |
| 1 | 55 | 1 | 36.13 | 3.50 | 3 | 3 | 0 | HCV |
| 1 | 62 | 1 | 24.04 | 5.90 | 3 | 2 | 0 | HCV |
| 1 | 60 | 1 | 27.68 | 8.00 | 4 | 2 | 14 | HCV |
| 1 | 57 | 1 | 25.74 | 4.10 | 3 | 3 | 1 | HCV |
| 1B | 53 | 1 | 28.06 | 2.47 | 0 | 0 | 49 | HCV |
| 1B | 56 | 1 | 25.04 | 8.49 | 1 | 2 | 1 | HCV |
| 1B | 62 | 2 | 17 | 4.27 | 3 | 0 | 361 | HCV |
| 1B | 53 | 1 | 31.4 | 3.01 | 0 | 1 | HCV | |
| 1C | 54 | 1 | 28.2 | 2.25 | 1 | 1 | HCV | |
| 1C | 72 | 1 | 29.28 | 2.80 | 3 | 2 | 1 | HCV |
| 1C | 63 | 2 | 28.7 | 5.10 | 3 | 0 | 1 | HCV |
| 2 | 65 | 2 | NA | 3.82 | 1 | 1 | 1 | HCV |
| 2 | 47 | 1 | NA | 4.08 | 1 | 1 | 1 | HCV |
| 2 | 26 | 1 | NA | 3.54 | 0 | 1 | 1 | HCV |
| 2 | 56 | 1 | NA | 3.60 | 1 | 1 | 1 | HCV |
| 2 | 46 | 2 | NA | 3.60 | 1 | 2 | 1 | HCV |
| 2 | 54 | 1 | NA | 3.96 | 1 | 2 | 1 | HCV |
| 2 | 53 | 2 | NA | 4.82 | 1 | 3 | 1 | HCV |
| 2 | 49 | 1 | NA | 3.30 | 0 | 1 | 1 | HCV |
| 2 | 33 | 2 | NA | 4.23 | 2 | 2 | 1 | HCV |
| 2 | 52 | 1 | NA | 3.73 | 1 | 1 | 1 | HCV |
| 2 | 57 | 1 | NA | 3.45 | 1 | 3 | 1 | HCV |
| 2 | 49 | 1 | NA | 4.42 | 1 | 3 | 1 | HCV |
| 2 | 54 | 1 | NA | 4.28 | 1 | 1 | 1 | HCV |
| 2 | 54 | 1 | NA | 3.13 | 1 | 1 | 1 | HCV |
| 3 | 54 | 1 | 21.53 | 3.5 | 0 | 0 | 0 | Alcoholic liver disease |
| 3 | 60 | 1 | 32.72 | 3.2 | 0 | 1 | 0 | HCV with HCC |
| 3 | 59 | 1 | 33.14 | 2.5 | 0 | 1 | 0 | HCV with HCC |
| 3 | 55 | 1 | 22.32 | 4 | 0 | 1 | 0 | HCV with HCC |
| 3 | 62 | 1 | 19.36 | 3.8 | 0 | 1 | 25 | HCV with HCC |
| 3 | 57 | 1 | 27.11 | 3.4 | 0 | 0 | 0 | HCV with HCC |
| 3 | 55 | 1 | 36.48 | 2.7 | 0 | 1 | 0 | HCV with HCC |
| 3 | 58 | 1 | 26.23 | 4.8 | 0 | 1 | 0 | Alcoholic liver disease |
| 3 | 60 | 1 | 36.72 | 3 | 0 | 1 | 0 | HCV with HCC |
| 3 | 58 | 1 | 31.42 | 2.6 | 0 | 0 | 64 | HCV with HCC |
| 3 | 55 | 1 | 22.4 | 3.7 | 0 | 1 | 63 | HCV with HCC |
| 3 | 59 | 1 | 20.1 | 2.4 | 0 | 1 | 0 | HCV with HCC |
| 3 | 67 | 1 | 31.69 | 3.6 | 0 | 0 | 0 | HCV with HCC |
| 3 | 75 | 1 | 22.74 | 1.6 | 0 | 0 | 0 | HCV with HCC |
| 3 | 57 | 2 | 25.61 | 4.5 | 0 | 0 | 0 | HCV with HCC |
| 3 | 66 | 2 | 31.47 | 3 | 0 | 1 | 14 | HCV with HCC |
| 3 | 31 | 1 | 29.38 | 3.3 | 0 | 1 | 12 | HCV with HCC |
| 3 | 56 | 2 | 30.2 | 2.3 | 0 | 0 | 0 | HCV with HCC |
| 3 | 65 | 1 | 24.01 | 2.4 | 0 | 1 | 0 | HCV with HCC |
| 3 | 43 | 1 | 30.09 | 3.5 | 0 | 1 | 0 | HCV with HCC |
| 3 | 66 | 1 | 33.76 | 2.3 | 0 | 1 | 0 | HCV with HCC |
| 3 | 60 | 1 | 22.46 | 4.2 | 0 | 1 | 0 | HCV with HCC |
| 3 | 60 | 1 | 27.28 | 3.6 | 0 | 0 | 0 | HCV with HCC |
| 3 | 61 | 1 | 34.86 | 3.6 | 0 | 0 | 0 | HCV with HCC |
| 3 | 57 | 1 | 24.96 | 6 | 1 | 1 | 0 | HCV with HCC |
| 3 | 55 | 1 | 26.69 | 5.6 | 1 | 1 | 0 | HCV with HCC |
| 3 | 75 | 1 | 24.87 | 4 | 1 | 1 | 0 | HCV with HCC |
| 3 | 60 | 1 | 33.23 | 3.8 | 1 | 1 | 42 | HCV with HCC |
| 3 | 53 | 1 | 28.83 | 4.3 | 1 | 1 | 0 | HCV with HCC |
| 3 | 71 | 1 | 24.66 | 10.1 | 3 | 2 | 0 | HCV with HCC |
| 3 | 57 | 30.49 | 4.5 | 2 | 2 | 0 | HCV with HCC | |
| 3 | 62 | 1 | 34.46 | 4.1 | 1 | 1 | 0 | HCV with HCC |
| 3 | 68 | 1 | 28.8 | 2.6 | 0 | 1 | 0 | HCV with HCC |
| 3 | 71 | 1 | NA | 5 | 2 | 1 | 0 | HCV with HCC |
| 3 | 54 | 1 | NA | 5.1 | 0 | 1 | 44 | Alcoholic liver disease |
| 3 | 46 | 1 | NA | 3.5 | 0 | 1 | 17 | HCV |
| 3 | 49 | 1 | NA | 8 | 4 | 2 | 65 | HCV |
| 3 | 68 | 1 | NA | 2.8 | 1 | 1 | 55 | HCV |
| 3 | 51 | 1 | NA | 11.5 | 0 | 3 | 0 | HCV with HCC |
| 3 | 57 | 2 | NA | 3 | 0 | 1 | 349 | HCV |
| 3 | 58 | 2 | NA | 4.4 | 0 | 1 | 19 | HCV |
| 4 | 56 | 2 | 19 | 2.99 | 1 | 0 | 81 | HCV |
| 4 | 45 | 1 | 21 | 2.24 | 2 | 2 | 85 | HCV |
| 4 | 53 | 2 | 18 | 3.11 | 2 | 1 | 1 | HCV |
| 4 | 72 | 2 | 22 | 2.98 | 2 | 0 | 76 | HCV |
| 4 | 61 | 1 | 23 | 3.21 | 1 | 2 | 10 | HCV |
| 4 | 55 | 1 | 30 | 3.52 | 2 | 2 | 52 | HCV |
| 4 | 38 | 1 | 23 | 3.65 | 2 | 0 | 0 | HCV |
| 4 | 68 | 1 | 23 | 3.79 | 2 | 0 | 34 | HCV |
| 4 | 49 | 24 | 3.85 | 2 | 1 | 55 | HCV | |
| 4 | 48 | 1 | 22 | 3.91 | 2 | 2 | 70 | HCV |
| 4 | 57 | 26 | 3.99 | 2 | 2 | 81 | HCV | |
| 4 | 48 | 1 | 21 | 4.01 | 2 | 2 | 30 | HCV |
| 4 | 54 | 1 | 18 | 3.88 | 1 | 2 | 28 | HCV |
| 4 | 48 | 1 | 26 | 3.96 | 2 | 2 | 77 | HCV |
| 4 | 50 | 1 | 24 | 4.00 | 1 | 1 | 55 | HCV |
| 4 | 31 | 21 | 3.77 | 1 | 1 | 83 | HCV | |
| 4 | 49 | 1 | 23 | 3.82 | 2 | 0 | 1 | HCV |
| 4 | 66 | 1 | 19 | 4.20 | 2 | 1 | 1 | HCV |
| 4 | 50 | 1 | 22 | 4.33 | 3 | 2 | 1 | HCV |
| 4 | 63 | 17 | 4.21 | 3 | 2 | 89 | HCV | |
| 4 | 50 | 1 | 22 | 4.53 | 2 | 2 | 8 | HCV |
| 4 | 52 | 1 | 23 | 4.60 | 2 | 2 | 23 | HCV |
| 4 | 59 | 2 | 21 | 4.32 | 2 | 2 | 21 | HCV |
| 4 | 60 | 2 | 30 | 4.69 | 2 | 3 | 32 | HCV |
| 4 | 39 | 1 | 22 | 5.88 | 4 | 0 | 1 | HCV |
Interpretation of codes. Study ID:1-Mayo Clinic, Florida; 1B-Mayo Clinic, Arizona; 1C-Mayo Clinic, Minnesota; 2-Cambridge, U.K.; 3-Chicago, IL; 4-Berlin, Germany.Degree of Inflammation: 0, no active inflammation; 1, minimal inflammation; 2, moderate inflammation; 3, severe inflammation. BMI: body mass index. kPa: kilo Pascals. MRE: magnetic resonance elastography. NA: not available. y: years.
Quality assessment of published studies using QUADAS-2 tool. Please note, quality assessment was only performed for the four published studies, but could not performed for 2 cohorts in which unpublished individual participant data was obtained.
| Study | Risk of bias | Applicability concerns | |||||
|---|---|---|---|---|---|---|---|
| Patient selection | Index test | Reference standard | Flow and timing | Patient selection | Index text | Reference standard | |
| Crespo, et al. 2013 | High (not consecutive patients) | Low | Low | Low | Low | Low | Low |
| Klatt, et al. 2011 | High (case-control design) | Unclear (not reported) | Unclear (not reported) | Low | Low | Low | Low |
| Godfrey, et al. 2012 | High (not consecutive patients) | Low | Low | Low | Low | Low | Low |
| Wang, et al. 2011 | High (not consecutive patients) | Low | Low | Low | Low | Low | Low |
Search strategy.
| N | Searches | Results | Search type |
|---|---|---|---|
| Ovid MEDLINE(R) In-Process & Other Non-Indexed Citations and Ovid MEDLINE(R) 1946 to Present | |||
| 1 | elasticity / or elasticity imaging techniques / or elastography.mp. [mp = title, abstract, original title, name of substance word, subject heading word, keyword heading word, protocol supplementary concept, rare disease supplementary concept, unique identifier] | 34012 | Advanced |
| 2 | magnetic resonance imaging/ or diffusion magnetic resonance imaging/ | 291772 | Advanced |
| 3 | 1 and (2 or mre.mp.) [mp = title, abstract, original title, name of substance word, subject heading word, keyword heading word, protocol supplementary concept, rare disease supplementary concept, unique identifier] | 858 | Advanced |
| 4 | Liver/pa, ra, ri [Pathology, Radiography, Radionuclide Imaging] | 74251 | Advanced |
| 5 | 4 and (fibrosis or fibrotic or stiff*).mp. [mp=title, abstract, original title, name of substance word, subject heading word, keyword heading word, protocol supplementary concept, rare disease supplementary concept, unique identifier] | 7514 | Advanced |
| 6 | 3 and 5 | 37 | Advanced |
| 7 | exp Liver Diseases/di, pa, pp, ra, ri [Diagnosis, Pathology, Physiopathology, Radiography, Radionuclide Imaging] | 160780 | Advanced |
| 8 | exp liver cirrhosis/ or 7 or 4 | 242766 | Advanced |
| 9 | 3 and 8 | 108 | Advanced |
| 10 | 6 or 9 | 108 | Advanced |
| 11 | 10 and systematic*.mp. [mp=title, abstract, original title, name of substance word, subject heading word, keyword heading word, protocol supplementary concept, rare disease supplementary concept, unique identifier] | 11 | Advanced |
| 12 | limit 10 to (clinical trial, all or clinical trial, phase i or clinical trial, phase ii or clinical trial, phase iii or clinical trial, phase iv or clinical trial or comparative study or controlled clinical trial or evaluation studies or meta analysis or multicenter study or randomized controlled trial or “review” or systematic reviews or validation studies) | 57 | Advanced |
| 13 | 3 and 8 and (exp biopsy/ or histopatholog*.mp.) [mp=title, abstract, original title, name of substance word, subject heading word, keyword heading word, protocol supplementary concept, rare disease supplementary concept, unique identifier] | 34 | Advanced |
| 14 | 10 and (“sensitivity and specificity”/ or predictive value of tests/ or reproducibility of results/) | 35 | Advanced |
| 15 | exp Diagnostic Errors/ | 94620 | Advanced |
| 16 | expmarkov chains/ or exp uncertainty/ or exp “sensitivity and specificity”/ | 435911 | Advanced |
| 17 | exp area under curve/ | 27563 | Advanced |
| 18 | 10 and (15 or 16 or 17) | 33 | Advanced |
| 19 | 6 or 11 or 12 or 13 or 14 or 18 | 94 | Advanced |
| 20 | remove duplicates from 19 | 73 | |
| Embase 1988 to 2013 Week 38 | |||
| 1 | elasticity/ or elasticity imaging techniques/ or elastography.mp. [mp=title, abstract, subject headings, heading word, drug trade name, original title, device manufacturer, drug manufacturer, device trade name, keyword] | 25056 | Advanced |
| 2 | magnetic resonance imaging/ or diffusion magnetic resonance imaging/ | 444067 | Advanced |
| 3 | 1 and (2 or mre.mp.) [mp=title, abstract, subject headings, heading word, drug trade name, original title, device manufacturer, drug manufacturer, device trade name, key word] | 1288 | Advanced |
| 4 | [Liver/pa, ra, ri [Pathology, Radiography, Radionuclide Imaging]] | 0 | Advanced |
| 5 | 4 and (fibrosis or fibrotic or stiff*).mp. [mp=title, abstract, subject headings, heading word, drug trade name, original title, device manufacturer, drug manufacturer, device trade name, key word] | 0 | Advanced |
| 6 | 3 and 5 | 0 | Advanced |
| 7 | [exp Liver Diseases/di, pa, pp, ra, ri [Diagnosis, Pathology, Physiopathology, Radiography, Radionuclide Imaging]] | 0 | Advanced |
| 8 | exp liver cirrhosis/ or 7 or 4 | 76199 | Advanced |
| 9 | 3 and 8 | 131 | Advanced |
| 10 | 6 or 9 | 131 | Advanced |
| 11 | 10 and systematic*.mp. [mp=title, abstract, subject headings, heading word, drug trade name, original title, device manufacturer, drug manufacturer, device trade name, key word] | 9 | Advanced |
| 12 | limit 10 to (clinical trial, all or clinical trial, phase i or clinical trial, phase ii or clinical trial, phase iii or clinical trial, phase iv or clinical trial or comparative study or controlled clinical trial or evaluation studies or meta analysis or multicenter study or randomized controlled trial or “review” or systematic reviews or validation studies) [Limit not valid in Embase; records were retained] | 43 | Advanced |
| 13 | 3 and 8 and (exp biopsy/ or histopatholog*.mp.) [mp=title, abstract, subject headings, heading word, drug trade name, original title, device manufacturer, drug manufacturer, device trade name, key word] | 85 | Advanced |
| 14 | 10 and (“sensitivity and specificity”/ or predictive value of tests/ or reproducibility of results/) | 39 | Advanced |
| 15 | exp Diagnostic Errors/ | 50160 | Advanced |
| 16 | expmarkov chains/ or exp uncertainty/ or exp “sensitivity and specificity”/ | 254035 | Advanced |
| 17 | exp area under curve/ | 67293 | Advanced |
| 18 | 10 and (15 or 16 or 17) | 33 | Advanced |
| 19 | exp case control study/ or exp case study/ or exp clinical trial/ or exp intervention study / or exp major clinical study / orexp prospective study/ or exp retrospective study/ | 2684494 | Advanced |
| 20 | exp predictive value/ | 40920 | Advanced |
| 21 | area under the curve/ | 67293 | Advanced |
| 22 | receiver operating characteristic/ | 33260 | Advanced |
| 23 | diagnostic accuracy/ | 173460 | Advanced |
| 24 | 10 and (19 or 20 or 21 or 22 or 23 or staging*.mp.) [mp=title, abstract, subject headings, heading word, drug trade name, original title, device manufacturer, drug manufacturer, device trade name, key word] | 66 | Advanced |
| 25 | liver fibrosis/ | 20869 | Advanced |
| 26 | 3 and 25 | 219 | Advanced |
| 27 | 26 and (19 or 20 or 21 or 22 or 23 or exp biopsy/ or histopathol*.mp.) [mp=title, abstract, subject headings, heading word, drug trade name, original title, device manufacturer, drug manufacturer, device trade name, key word] | 179 | Advanced |
| 28 | 18 or 24 or 27 | 197 | |
Web of science. Topic = [(elasticity OR elastography OR viscoelasticity OR stiffness) AND (mre OR mr OR “magnetic resonance”]) AND Topic = ([cirrhosis OR cirrhotic OR fibrosis OR fibrotic] OR liver OR hepat*) AND Topic = (“area under” OR roc OR reproducib* OR accura* OR predictive OR value OR sensitiv* OR compar* OR biops* OR histopathol* OR “systematic review” OR meta-analysis) 293
Scopus. TITLE-ABS-KEY ([elasticity OR elastography OR viscoelasticity OR stiffness] AND [mre OR mr OR “magnetic resonance”]) AND TITLE-ABS-KEY ([cirrhosis OR cirrhotic OR fibrosis OR fibrotic OR liver OR hepat*]) AND TITLE-ABS-KEY ([staging OR “area under” OR roc OR reproducib* OR accura* OR predictive OR value OR sensitiv* OR compar* OR biops* OR histopathol* OR “systematic review” OR meta-analysis]) 426


