


Edited by: Sonia Roman
Last update: January 2023
More info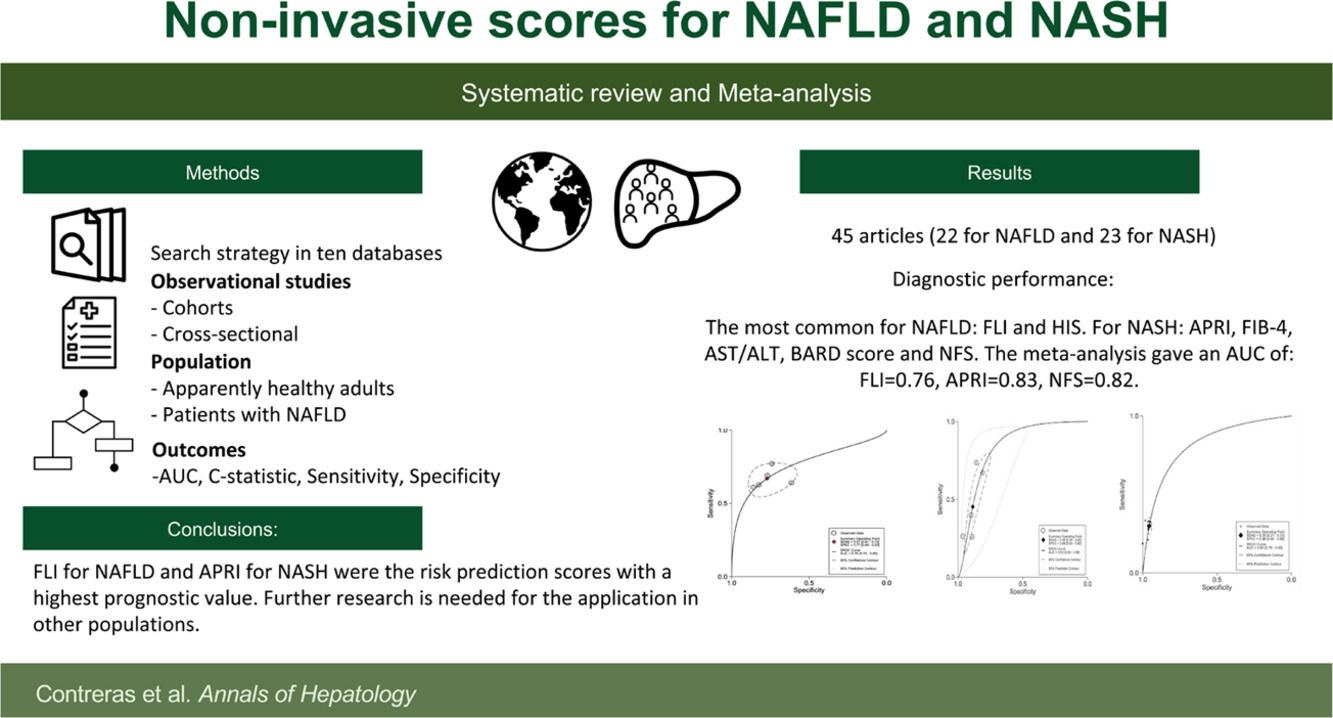
Fatty liver disease (FLD) is defined as the accumulation of liver fat (hepatic steatosis) in >5% of hepatocytes with or without inflammation and fibrosis [1]. The spectrum of FLD has been evolving; for example, NAFLD encompasses two subtypes, simple fatty liver and NASH, both with an absence of a coexisting etiology of chronic liver disease or secondary cause of steatosis, including drug use, significant alcohol consumption (>20g daily in females or >30 g in males), viral hepatitis, inherited or acquired metabolic states [2–4]. Recently, the term metabolic associated fatty liver disease (MAFLD) has emerged, which includes hepatic steatosis in combination with one criterion for metabolic dysfunction (i.e., overweight or obesity, type 2 diabetes (T2D) or evidence of metabolic dysregulation) [5]. Metabolic syndrome continues to be one of the strongest risk factors for NAFLD [6]. Patients with NAFLD have a disease progression that could include liver fibrosis, cirrhosis, and hepatocellular carcinoma [7].
NAFLD is a significant public health problem, as it is prevalent in about a quarter of the world's adult population [2,5]. According to the Global Burden of Disease Study 2019, NAFLD is accountable for 4.36 million Years of Life Lost (95% uncertainty interval [UI]: 3.30, 5.59) and 4.42 million Global Disability-Adjusted Life-Years (95% UI: 3.35, 5.67) [8]. Early diagnosis of individuals with a high risk for developing NAFLD is critical to diminish its rate of progression to irreversible and terminal stages; and to allow effective management of its comorbidities to address its poor health-related quality of life and the economic burden to the patients and their families [9].
Currently, the assessment of NAFLD can either be done by liver histology, imaging techniques, blood biomarkers, or non-invasive prediction scores [4]. Liver histology is the gold standard to diagnose and stage its severity; however, its use has been associated with potential complications and interobserver variability of individual pathological features. In addition, imaging techniques, such as ultrasound or magnetic resonance imaging, are costly and usually unavailable in primary care settings [2,10]. Blood biomarkers or non-invasive prediction scores using biochemical and clinical parameters offer a cost-effective approach for NAFLD or NASH diagnosis [10]. Also, the uneven distribution of steatosis, inflammation, or fibrosis throughout the liver indicates that scoring systems could accurately reflect the risk for liver disease; highlighting the need to evaluate their efficacy in the affected population [11]. Previous studies described well known predictive scores; for example: Nonalcoholic Fatty Liver Disease Fibrosis Score (NFS) developed in a cohort of patients with NAFLD and could be used to predict the presence of advanced fibrosis [10], and the Fatty Liver index (FLI) to detect the presence of steatosis. The European Association for the Study of the Liver (EASL), European Association for the Study of Diabetes (EASD) and European Association for the Study of Obesity (EASO) recommend the use of non-invasive scores whenever imaging tools are not available or feasible [12]. Nevertheless, new models have been introduced and the validation of other models has progressed.
Therefore, the purpose of this paper is to identify and evaluate the diagnostic accuracy of blood biomarkers and non-invasive scores, for the diagnosis of NAFLD or NASH in adults, compared to image studies or liver biopsy, by performing a systematic review and meta-analysis.
2MethodsThe present study was performed following the Cochrane Handbook for Systematic Reviews of Diagnostic Test Accuracy (DTA) methodology [13] and Preferred Reporting Items for Systematic Review and Meta-Analysis of Diagnostic Test Accuracy (PRISMA-DTA) statement [14]. PROSPERO:CRD42021254842 (https://www.crd.york.ac.uk/prospero/display_record.php?ID=CRD42021254842).
2.1Inclusion criteria2.1.1Types of studies and participantsCohort and cross-sectional studies published between January 2010 and January 2022 were included. A range of 11 years was established considering previous reviews to provide new evidence. The population included were apparently healthy adults (>18 years) and adults diagnosed with NAFLD, without any prior diagnosis of any other acute or chronic disease or intervention.
2.1.2Risk scoresStudies with risk scores suggested by previous guidelines [12] as FLI and NFS, were included. Also, every study that reported the development or the validation of a non-invasive risk score for NAFLD or NASH. Risk scores may consist of one or more variables; all of those developed or analyzed in each article were included.
2.1.3Reference standardStudies reporting abdominal ultrasound and/or liver biopsy to diagnose NAFLD or NASH were included.
2.1.4Types of outcomesStudies that include the area under the receiver operating characteristic curve (AUC) or C-Statistic, sensitivity (Se) and specificity (Sp) were included.
2.2Exclusion criteriaStudies in which the participants had a known coexisting chronic condition, such as liver disease or cirrhosis, without enough data about diagnostic accuracy estimates and letters, posters, reviews, commentaries, predictive scores for mortality and machine learning were also excluded.
2.3Electronic searchThe search was conducted in 10 databases: Pubmed/Medline, CINAHL, Cochrane central library, Embase, Epistemonikos, LILACS/ IBECS, OVID, PsycINFO, TripDatabase, and ScienceDirect on October 2021 and updated on January 2022, with a search strategy previously designed, and adjusted per database using MeSH terms and others determined by consensus between the authors (Supplementary Table 1).
2.3.1Other sourcesThe reference list of previous reviews and of the included studies were screened to identify additional studies.
2.4Data collection and analysis2.4.1Selection of studiesAll the duplicated studies were removed. Titles, abstracts, and full text studies were independently screened by duplicate (AGR/DC). A third reviewer (ED-G) was reached for disagreement (Fig. 1).
2.4.2Data extraction
Data were extracted and organized by the characteristics of the risk scores. The data set included country, population, mean age, score and reference tests features, accuracy values, and study design.
2.4.3Assessment of methodological qualityTwo reviewers (AGR/DC) independently assessed the methodological quality using the QUADAS-2 tool [15] with RevMan 5.4 [16]. The QUADAS-2 tool analyzes four domains in terms of their risk of bias: (1) Patient Selection, (2) Index test, (3) Reference Standard, and 4) Flow and timing. Regarding applicability concerns, it evaluates three domains: (1) Patient selection, (2) Index test, and (3) Reference Standard. Each potential bias and concern were graded as high, low or unclear risk.
2.5Statistical analysis and data synthesisThe meta-analysis included scores validated in four or more populations and provided complete data for sensitivity, specificity, and AUC with their respective 95% confidence intervals (95% CI), also identified with similar cut-off points for the outcomes and similar diagnostic objective. The cut-off values used for the classification and data synthesis for advanced fibrosis were aspartate aminotransferase (AST) to Platelet Ratio Index (APRI) ≥1, AST/ALT ratio (AAR) ≥0.8, NAFLD Fibrosis Score (NFS) ≥0.676, BARD score ≥2, and Fibrosis-4 Index (FIB-4) ≥3.25 [17]. Studies with high applicability concerns or risk of bias were not included in the meta-analysis. Then, the two-by-two table to identify the True Positive (TP), True Negative (TN), False Positive (FP) and False Negative (FN), was calculated using the formula proposed by Kim et al. [18], where P was defined as the number of patients, and S as the number of all subjects (TP= Se * P, TN=Sp * (S-P), FP= (S-P)-TN, FN=P-TP). The sensitivity, specificity, and AUC summary were carried out by bivariate mixed-effects binary regression modeling framework. The publication bias was evaluated by a funnel plot asymmetry, and a linear regression of log odds ratios on the inverse root of effective sample sizes was performed.
All the analyses were carried out with Stata 17.0 and the forest plots with RevMan 5.4.
2.5.1Certainty of the evidenceThe certainty of the evidence from the meta-analysis was performed according to the guidelines of the Grading of Recommendation Assessment, Development and Evaluation (GRADE) Working group [19]. For the imprecision domain, it was classified using the standards published by Okeh and Okoro [20] to identify the relationship between AUC and diagnostic accuracy. Heterogeneity was calculated with Galbraith (radial) plots of standardized logit transformed proportion. The GRADE system classifies the evidence into four categories, from high to very low. All the analyses were carried out with the online software GRADEpro GDT Version 3.67 [21].
3Results3.1Search resultsA total of 5,972 studies were identified: 5,084 from databases and 888 from citation searching. After removing duplicates, 4,649 titles and abstracts were screened. Then, 4,591 studies were eliminated, 102 studies were analyzed in full-text, and 57 excluded. Finally, 45 studies were included [22–66]; 22 studies that evaluated diagnostic risk scores for NAFLD [22–43] and 23 that evaluated NASH [44–66]. Of those, 55 different diagnostic risk scores were extracted; their main characteristics are summarized in Supplementary Table 2.
3.2Target populationThe data included participants from 19 countries (China [25,27,36,39–43,56,57,59,65], the United States [32,35,46,45,54,63], and Japan [26,51,58,62,64]). Participants in the included studies had a mean age of 49 years which ranged from 35 to 76 years. For NAFLD, 19 of the studies included enrolled individuals who apparently were healthy [20–31,33–36,38–42], and three studies included patients with a previous NAFLD diagnosis [32,37,43]. Of the included studies for NAFLD diagnosis, 18 used as reference standard abdominal ultrasounds [22–31,33–36,38–42], four used liver biopsy [32,36,37,43], and for NASH diagnosis, all the studies included liver biopsy.
3.3Risk scores for non-alcoholic fatty liver disease predictionIn the 22 studies for NAFLD diagnosis [22–43], 23 different risk scores were found (Supplementary Table 2). The most common were Fatty Liver Index (FLI) [28–30,32,34,35,37] and Hepatic Steatosis Index (HSI) [22,28,40]. The most common variables were body mass index (BMI) found in 17, triglycerides in 15, ALT in 14; and AST and fasting glucose in eight.
The AUCs ranged from 0.66 to 0.93. The highest AUC was for the New Diagnostic formula of controlled attenuation parameter by Feng et al. [43] and the lowest by de Lédinghen et al. [37]. The risk score with the highest sensitivity was HSI by Perazzo et al. [28], with 0.94 and a specificity of 0.45. The highest specificity was Liver Fat Score (LFS) by Cheung et al. [30], with 0.96 and a sensitivity of 0.26 (Table 1).
Analysis of sensitivity, specificity, statistic-c or AUC of models.
| Author & Year | Model Name | AUC (95% CI) | Sensitivity | Specificity | |
|---|---|---|---|---|---|
| Non-Alcoholic Fatty Liver Disease (NAFLD)a | |||||
| Lee et al., 2010 [22] | Hepatic Steatosis Index | 0.82 (0.81-0.83) | 0.45 | 0.93 | |
| Park et al., 2011 [23] | Index System for NAFLD | 0.80 (0.75-0.84) | 0.72 | 0.76 | |
| Miyake et al., 2012 [26] | NAFLD Index | Males | 0.87 (0.86-0.89) | 0.78 | 0.81 |
| Females | 0.87 (0.86-0.88) | 0.84 | 0.76 | ||
| Koehler et al., 2013 [29] | Fatty Liver Index | 0.81 (0.80-0.83) | 0.60 | 0.82 | |
| Lipid Accumulation Product | 0.79 (0.77–0.80) | (NA) | (NA) | ||
| Cheung et al., 2014 [30] | Fatty Liver Index | 0.76 (0.74-0.77) | 0.68 | 0.74 | |
| Hepatic Steatosis Index | 0.73 (0.71-0.75) | 0.66 | 0.69 | ||
| Lipid Accumulation Product | 0.74 (0.72-0.76) | (NA) | (NA) | ||
| Liver Fat Score | 0.77 (0.75-0.79) | 0.26 | 0.96 | ||
| Lee et al., 2014 [31] | Comprehensive model | Males | 0.85 (NA) | 0.67 | 0.85 |
| Females | 0.89 (NA) | 0.71 | 0.88 | ||
| Otgonsuren et al., 2014 [32] | New Non-Invasive Model (ION) | 0.77 (0.75-0.79) | 0.60 | 0.82 | |
| Fatty Liver Index | 0.74 (0.72–0.76) | (NA) | 0.80 | ||
| Lesmana et al., 2015 [33] | NALFD Scoring System | 0.83 (0.81-0.86) | 0.76 | 0.70 | |
| Ruhl et al., 2015 [35] | Fatty Liver Index | 0.78 (0.74-0.81) | 0.69 | 0.77 | |
| US Fatty Liver Index | 0.80 (0.77-0.83) | 0.62 | 0.88 | ||
| Wang et al., 2015 [36] | Zhejiang University Index, ZJU Index | 0.83 (0.82-0.84) | 0.42 | 0.93 | |
| Yang et al., 2015 [34] | Fatty Liver Index | Males | 0.83 (0.82-0.83) | 0.63 | 0.80 |
| Females | 0.62 | 0.86 | |||
| De Ledinghen et al., 2016 [37] | Fatty Liver Index | 0.66 (0.59-0.74) | (NA) | (NA) | |
| Xia et al., 2016 [38] | Chinese NAFLD Score | 0.74 (0.69-0.80) | 0.79 | 0.62 | |
| Lin et al., 2017 [39] | Model to Predict Onset of NAFLD in Elderly Adults | 0.68 (0.62-0.71) | 0.40 | 0.86 | |
| Zhang Q. et al, 2017 [40] | NAFLD Risk Prediction Scoring Model | 0.82 (0.78-0.85) | 0.77 | 0.75 | |
| Zhang S. et al., 2017 [41] | Triglyceride glucose-body mass index | 0.84 (0.82-0.85) | (NA) | (NA) | |
| Zhou et al., 2017 [42] | NAFL Risk Score | Males | 0.74 (0.73-0.75) | (NA) | (NA) |
| Females | 0.82 (0.81-0.84) | (NA) | (NA) | ||
| Feng et al., 2019 [43] | New Diagnostic formula of CAP (controlled attenuation parameter) | 0.93 (NA) | 0.88 | 0.90 | |
| Abd et al., 2020 [24] | NAFLD Screening Tool | 0.81 (0.75-0.87) | 0.87 | 0.62 | |
| Cai et al., 2020 [25] | NAFLD Prediction Model | 0.86 (0.84-0.88) | (NA) | (NA) | |
| Pan et al., 2020 [27] | Nomogram model for predicting the risk of NAFLD | 0.84 (0.82-0.87) | 0.55 | 0.89 | |
| Perazzo et al., 2020 [28] | Steato-ELSA | 0.83 (0.81-0.85) | 0.84 | 0.69 | |
| Fatty Liver Index | 0.82 (0.80-0.84) | 0.77 | 0.74 | ||
| Hepatic Steatosis Index | 0.80 (0.78-0.82) | 0.94 | 0.45 | ||
| NAFLD-Liver Fat Score | 0.77 (0.75-0.79) | 0.79 | 0.67 | ||
| Non-Alcoholic Steatohepatitis (NASH) | |||||
| Author & Year | Model Name | Measurement | AUC (95% CI) | Sensitivity | Specificity |
| Cales et al., 2010 [44] | NASH-CRN | Fibrosis | 0.87 (NA) | (NA) | (NA) |
| Metavir F>2 | Fibrosis | 0.94 (NA) | (NA) | (NA) | |
| McPherson et al., 2010 [45] | AST/ALT ratio | Fibrosis | 0.83 (0.74-0.91) | 0.74 | 0.78 |
| APRI | Fibrosis | 0.67 (0.54-0.80) | 0.27 | 0.89 | |
| BARD Score | Fibrosis | 0.77 (0.68-0.87) | 0.89 | 0.44 | |
| FIB-4 | Fibrosis | 0.86 (0.78-0.94) | 0.26 | 0.98 | |
| NAFLD Fibrosis Score | Fibrosis | 0.81 (0.71-0.91) | 0.33 | 0.98 | |
| Raszeja et al., 2010 [56] | BARD Score | Fibrosis | 0.82 (NA) | 0.87 | 0.73 |
| Adams et al., 2011 [60] | APRI | Fibrosis | 0.79 (0.71–0.86) | 0.72 | 0.77 |
| BARD Score | Fibrosis | 0.70 (0.62–0.78) | 0.60 | 0.72 | |
| Hepascore | Fibrosis | 0.81 (0.73–0.90) | 0.76 | 0.84 | |
| Fibrotest | Fibrosis | 0.80 (0.73–0.88) | 0.61 | 0.90 | |
| FIB-4 | Fibrosis | 0.86 (0.80–0.92) | 0.74 | 0.87 | |
| Kruger et al., 2011 [61] | APRI | Fibrosis | 0.85 (NA) | 0.75 | 0.86 |
| AST/ALT ratio | Fibrosis | 0.61 (NA) | 0.58 | 0.62 | |
| NASH fibrosis score | Fibrosis | 0.77 (NA) | 0.76 | 0.69 | |
| Sumida et al., 2011 [62] | NAFIC Score | Fibrosis | 0.80 (NA) | 0.84 | 0.82 |
| NAFLD fibrosis score | Fibrosis | 0.69 (NA) | 0.33 | 0.95 | |
| Younossi et al., 2011 [63] | Model for NASH | Steatohepatitis | 0.81 (0.70-0.89) | (NA) | (NA) |
| Model for NASH-Related Fibrosis | Fibrosis | 0.80 (0.68-0.88) | (NA) | (NA) | |
| Model for NASH-Related Advanced Fibrosis | Fibrosis | 0.81 (0.70-0.89) | NA | (NA) | |
| Sumida et al., 2012 [64] | FIB-4 | Fibrosis | 0.87 (NA) | 0.48 | 0.95 |
| AST/ALT ratio | Fibrosis | 0.79 (NA) | 0.66 | 0.76 | |
| APRI | Fibrosis | 0.82 (NA) | 0.67 | 0.81 | |
| Age-platelet index | Fibrosis | 0.81 (NA) | 0.66 | 0.78 | |
| NAFLD Fibrosis Score | Fibrosis | 0.86 (NA) | 0.33 | 0.96 | |
| BARD Score | Fibrosis | 0.77 (NA) | 0.80 | 0.65 | |
| N (Nippon) score | Fibrosis | 0.72 (NA) | 0.80 | 0.58 | |
| Cao et al., 2013 [65] | Non-invasive scoring system | Steatohepatitis | 0.92 (0.87-0.97) | 0.89 | 0.86 |
| Demir et al., 2013 [66] | NIKEI | Fibrosis | 0.97 (0.94-1.00) | 0.67 | 0.96 |
| FIB-4 | Fibrosis | 0.93 (0.87-0.99) | (NA) | (NA) | |
| AST/ALT Ratio | Fibrosis | 0.81 (0.72-0.90) | 0.64 | 0.84 | |
| NAFLD Fibrosis Score | Fibrosis | 0.96 (0.92-0.99) | 0.19 | 1.00 | |
| BARD Score | Fibrosis | 0.67 (0.55-0.78) | 0.67 | 0.54 | |
| Alkhouri et al., 2014 [46] | OxNASH Score | Fibrosis | 0.67 (0.58-0.77) | 0.75 | 0.61 |
| Cui et al., 2015 [47] | AST/ALT Ratio | Fibrosis | 0.83 (0.73-0.92) | 0.87 | 0.61 |
| APRI | Fibrosis | 0.81 (0.70-0.91) | 0.25 | 0.96 | |
| BARD Score | Fibrosis | 0.82 (0.72-0.91) | 0.87 | 0.64 | |
| FIB-4 | Fibrosis | 0.86 (0.78-0.95) | 0.84 | 0.72 | |
| NAFLD Fibrosis Score | Fibrosis | 0.82 (0.70-0.93) | 0.21 | 0.96 | |
| Bonacini Cirrhosis Discriminant Score | Fibrosis | 0.83 (0.73-0.93) | 0.05 | 1.00 | |
| Lok Index | Fibrosis | 0.84 (0.73-0.94) | 0.27 | 0.96 | |
| NASH CRN Model | Fibrosis | 0.80 (0.68-0.92) | (NA) | (NA) | |
| McPherson et al, 2015 [48] | FIB-4 | Fibrosis | 0.72 (0.62-0.82) | (NA) | (NA) |
| NAFLD Fibrosis Score | Fibrosis | 0.83 (0.74-0.92) | 0.28 | 0.98 | |
| Boursier et al., 2016 [49] | APRI | Fibrosis | 0.75 (NA) | 0.61 | 0.76 |
| BARD Score | Fibrosis | 0.70 (NA) | 0.79 | 0.51 | |
| FIB-4 | Fibrosis | 0.78 (NA) | 0.76 | 0.67 | |
| FibroMeter NAFLD | Fibrosis | 0.76 (NA) | 0.80 | 0.62 | |
| FibroMeter V2G | Fibrosis | 0.82 (NA) | 0.77 | 0.72 | |
| Fibrotest | Fibrosis | 0.74 (NA) | 0.81 | 0.57 | |
| Hepascore | Fibrosis | 0.78 (NA) | 0.67 | 0.76 | |
| NAFLD Fibrosis Score (NFS) | Fibrosis | 0.73 (NA) | 0.77 | 0.60 | |
| Loong et al., 2017 [50] | FM VCTE | Fibrosis | 0.90 (NA) | 0.18 | 0.99 |
| FibroMeter NAFLD | Fibrosis | 0.77 (NA) | 0.21 | 0.97 | |
| APRI | Fibrosis | 0.72 (NA) | (NA) | (NA) | |
| FIB-4 | Fibrosis | 0.70 (NA) | (NA) | (NA) | |
| NAFLD Fibrosis Score (NFS) | Fibrosis | 0.65 (NA) | (NA) | (NA) | |
| BARD Score | Fibrosis | 0.61 (NA) | (NA) | (NA) | |
| AST/ALT ratio | Fibrosis | 0.56 (NA) | (NA) | (NA) | |
| Tada et al., 2018 [51] | FIC-22 | Steatohepatitis | 0.82 (0.75-0.89) | 0.89 | 0.63 |
| FIB-4 | Steatohepatitis | 0.76 (0.68-0.84) | (NA) | (NA) | |
| Tasneem et al., 2018 [52] | GULAB Score | Steatohepatitis | 0.76 (NA) | 0.82 | 0.56 |
| Chuah et al., 2019 [53] | MACK-3 | Steatohepatitis | 0.81 (0.74-0.87) | 0.84 | 0.81 |
| Cytokeratin 18 | Steatohepatitis | 0.72 (0.65-0.80) | (NA) | (NA) | |
| BARD Score | Steatohepatitis | 0.63 (0.55-0.72) | (NA) | (NA) | |
| NAFLD Fibrosis Score | Steatohepatitis | 0.70 (0.63-0.78) | (NA) | (NA) | |
| FIB-4 | Steatohepatitis | 0.72 (0.65-0.79) | (NA) | (NA) | |
| Siddiqui et al, 2019 [54] | FIB-4 | Fibrosis | 0.80 (0.78-0.82) b | 0.28 | 0.97 |
| NAFLD Fibrosis Score | Fibrosis | 0.78 (0.76-0.80) b | 0.30 | 0.95 | |
| APRI | Fibrosis | 0.76 (0.74- 0.79) b | 0.40 | 0.90 | |
| AST/ALT ratio | Fibrosis | 0.68 (0.66-0.71) b | 0.26 | 0.90 | |
| Zhou et al., 2019 [55] | Novel Nomogram | Fibrosis | 0.83 (0.76-0.90) | 0.69 | 0.82 |
| APRI | Fibrosis | 0.67 (0.56-0.78) | 0.62 | 0.68 | |
| NAFLD Fibrosis Score | Fibrosis | 0.60 (0.48-0.72) | 0.76 | 0.46 | |
| FIB-4 | Fibrosis | 0.62 (0.51-0.74) | 0.66 | 0.58 | |
| BARD Score | Fibrosis | 0.58 (0.46-0.70) | 0.31 | 0.84 | |
| Gao et al., 2020 [57] | Novel diagnostic algorithm | Fibrosis | 0.81 (0.74-0.87) | (NA) | (NA) |
| MACK-3 | Fibrosis | 0.75 (0.68–0.82) | (NA) | (NA) | |
| FIB-4 | Fibrosis | 0.70 (0.62–0.76) | (NA) | (NA) | |
| NAFLD Fibrosis Score | Fibrosis | 0.63 (0.55–0.70) | (NA) | (NA) | |
| Ogawa et al., 2020 [58] | AAT-A3F | Steatohepatitis | 0.70 (NA) | 0.79 | 0.58 |
| APRI | Steatohepatitis | 0.65 (NA) | 0.51 | 0.81 | |
| Cytokeratin 18 | Steatohepatitis | 0.67 (NA) | 0.49 | 0.86 | |
| FIB-4 | Steatohepatitis | 0.62 (NA) | 0.64 | 0.67 | |
| M2BPGi | Steatohepatitis | 0.67 (NA) | 0.55 | 0.80 | |
| Zheng et al., 2020 [59] | G-NASH model | Steatohepatitis | 0.85 (0.76-0.93) | 0.82 | 0.81 |
AST/ALT ratio, aspartate aminotransferase (AST)/alanine transaminase (ALT) ratio; AAT-A3F, Tri-antennary trisialylated mono-fucosylated glycan of alpha-1 antitrypsin; APRI, AST to Platelet Ratio Index; AUC, area under the curve; CRN, Clinical research network; FIB-4, Fibrosis 4 Score; M2BPGi, Mac-2 binding protein glycosylation isomer; NA, not available; NAFLD, Non-alcoholic fatty liver disease; NASH, Non-alcoholic steatohepatitis; T2D, type 2 diabetes; VCTE, Vibration-controlled transient elastography.
In the 23 studies for NASH diagnosis, there were 32 different risk scores found. The most common were FIB-4 [45,47–51,53–55,57,58,60,64,66] NFS [45,44–50,53–55,57,61,62,64,66], BARD score [45,47,49,50,53,55,56,60,65,66], and APRI [45,47,49,50,54,55,58,60,61,64]. The most common variables were AST in 21, ALT in 17, fasting glucose in 14, and age in 11 risk scores (Supplementary Table 2). For the score outcomes, a range of AUC was observed from 0.56 to 0.97. The highest AUC was NIKEI by Demir et al. [66], and the lowest AST/ALT ratio by Loong et al. [50]. The highest sensitivity was identified for the FIC-22 model by Tada et al. [51], with 0.89 and a specificity of 0.62. The risk score with the highest specificity was NFS by Demir et al. [66], with a specificity of 1.00 and a sensitivity of 0.19 (Table 1). For the diagnostic objective, 16 risk scores were developed for steatohepatitis and 71 for fibrosis.
3.5Risk of bias and applicability concernsThe graph and summary of the risk of bias are presented in the Supplementary Fig. 1.
3.5.1Risk of bias and applicability concerns for non-alcoholic fatty liver diseaseTwo studies had a high risk for “patient selection” bias. These studies did not state whether the authors used a consecutive or random sample of the enrolled patients; also, case-control design within the cohorts was not avoided [21,41]. One study had a high risk for “reference standard” bias since it did not provide a precise NAFLD diagnosis [21]. Two studies had a high risk for “flow and timing” bias since they did not indicate an appropriate timing between the index and the reference test and because not all patients were included in the analysis [38,43]. However, high applicability concerns were not found.
3.5.2Risk of bias and applicability concerns for non-alcoholic steatohepatitisThree studies had a high risk of “patient selection” bias and high concern for applicability since cohorts associated with clinical trials were used [43,53,54]. Two studies were found with high-risk of “index test” bias; one did not define NASH [62], and another did not specify if the index test results were interpreted without knowledge of the results of the reference standard, this is also a high applicability concern [48]. In addition, two studies had a high risk for “reference test” bias and a high concern of applicability since they did not provide a NASH classification [56,63]. Finally, three studies had a high risk for “flow and timing” bias since it was unclear if there was an appropriate time interval between the index test and reference standard. Also, not all the participants were included in the analysis [51,57,66].
3.6Meta-analysis and certainty of the evidenceSix risk scores met the criteria to be included; FLI [28–30,34,35] for the analysis of the diagnosis of NAFLD and AST/ALT [45,47,54,61,64,66], FIB-4 [45,47,49,54,61,64], NFS [44,47,48,54,62,64,66], APRI [45,47,54,61,64], and BARD [45,47,49,55,56,60,64] score for NASH. The details are presented in Table 2.
Summary of the meta-analysis and certainty of the evidence.
| Outcome | Number of studies (Number of patients) | GRADE classification |
|---|---|---|
| FLI test to screen NAFLD in healthy population | ||
| Se: 0.67 (95% CI 0.61, 0.72) Sp: 0.77 (95% CI 0.69, 0.83) | ||
| True positives | 6 studies | ⨁⨁⨁○ |
| False negatives | 22146 patients | Moderate |
| True negatives | 6 studies | ⨁⨁⨁○ |
| False positives | 29278 patients | Moderate |
| AST/ALT ratio test to screen NASH | ||
| Se: 0.63 (95% CI 0.44, 0.79) Sp: 0.77 (95% CI 0.68, 0.84) | ||
| True positives | 6 studies | ⨁⨁○○ a,b,c |
| False negatives | 688 patients | Low |
| True negatives | 6 studies | ⨁⨁○○ a,b,c |
| False positives | 2416 patients | Low |
| APRI test to screen NASH | ||
| Se: 0.45 (95% CI 0.29, 0.62) Sp: 0.89 (95% CI 0.83, 0.92) | ||
| True positives | 5 studies | ⨁⨁○○ b,c |
| False negatives | 665 patients | Low |
| True negatives | 5 studies | ⨁⨁⨁○ |
| False positives | 2172 patients | Moderate |
| BARD score to screen NASH | ||
| Se: 0.72 (95% CI 0.58, 0.83) Sp: 0.65 (95% CI 0.55, 0.75) | ||
| True positives | 7 studies | ⨁⨁⨁○ |
| False negatives | 952 patients | Moderate |
| True negatives | 7 studies | ⨁⨁⨁○ |
| False positives | 2736 patients | Moderate |
| FIB -4 score to screen NASH | ||
| Se: 0.57 (95% CI 0.39, 0.74) Sp: 0.89 (95% CI 0.77, 0.95) | ||
| True positives | 6 studies | ⨁⨁○○ b,c |
| False negatives | 927 patients | Low |
| True negatives | 6 studies | ⨁⨁⨁○ |
| False positives | 2630 patients | Moderate |
| NFS score to screen NASH | ||
| Se: 0.30 (95% CI 0.27, 0.33) Sp: 0.96 (95% CI 0.95,0.96) | ||
| True positives | 7 studies | ⨁○○○a,b |
| False negatives | 795 patients | Very low |
| True negatives | 7 studies | ⨁⨁⨁⨁ |
| False positives | 2749 patients | High |
APRI, AST to platelet ratio index; AST/ALT ratio, aspartate aminotransferase (AST)/alanine transaminase (ALT) ratio; FLI, fatty liver index; FIB-4, fibrosis 4 score; NAFLD, non-alcoholic fatty liver disease; NASH, non-alcoholic steatohepatitis; NFS, NAFLD fibrosis score; Se, sensitivity; Sp, specificity.
The data for FLI was analyzed in five studies which provided a summary point AUC of 0.76 (95% CI: 0.73, 0.80) with a sensitivity of 0.67 (95% CI: 0.62, 0.72) and low certainty; a specificity of 0.78 (95% CI: 0.74, 0.83) and moderate certainty, this risk score was validated in a total of 49,468 subjects (Fig. 2). The data for APRI was obtained from five studies with a summary point AUC of 0.83 (95% CI: 0.80, 0.86), a sensitivity of 0.45 (95% CI: 0.29, 0.62) with low certainty, and specificity of 0.89 (95% CI: 0.83, 0.92) with moderate certainty, in a total of 2,837 subjects (Fig. 3a). The BARD score was analyzed in seven studies with a total of 1,964 subjects with a summary point AUC of 0.74 (95% CI: 0.70, 0.77), sensitivity of 0.72 (95% CI: 0.58, 0.83), and specificity of 0.65 (95% CI: 0.55, 0.75) both with moderate certainty (Fig. 3b). The analysis conducted for AST/ALT ratio in six studies with a total of 3,104 subjects had a summary point AUC of 0.78 (95% CI: 0.74, 0.81) with a sensitivity of 0.63 (95% CI: 0.44, 0.79) and moderate certainty, also, specificity of 0.77 (95% CI: 0.68, 0.84) and low certainty (Fig. 3c). The NFS presented a summary point AUC of 0.82 (95% CI: 0.78, 0.85) in seven studies with a sensitivity of 0.30 (95% CI: 0.27, 0.33) in 795 patients and low certainty, and specificity of 0.96 (95% CI: 0.95, 0.96) in 2,749 patients with high certainty (Fig. 3d). The FIB-4 meta-analysis of six studies for the risk of fibrosis, with a total of 3,557 subjects, reported a summary point AUC of 0.81 (95% CI: 0.77, 0.84), sensitivity of 0.57 (95% CI: 0.39, 0.74) classified as low certainty because of reduced discriminatory performance and high inconsistency, and specificity of 0.89 (95% CI: 0.77, 0.95) with moderate certainty (Fig. 4).

, classified for advance fibrosis: (a) AST to platelet ratio index (APRI); (b) BARD score; (c)aspartate aminotransferase (AST)/alanine transaminase (ALT) ratio; (d) NAFLD Fibrosis score (NFS).")
Forest plots and graphs for the meta-analysis of five predictive models for non-alcoholic steatohepatitis (NASH), classified for advance fibrosis: (a) AST to platelet ratio index (APRI); (b) BARD score; (c)aspartate aminotransferase (AST)/alanine transaminase (ALT) ratio; (d) NAFLD Fibrosis score (NFS).

There was no publication bias identified in the meta-analysis, with exception of the AST/ALT analysis that suggested a small publication bias (Supplementary Fig. 2).
4DiscussionThis study performed a comprehensive search strategy to minimize selection bias. It reviewed a total of 45 publications, from January 2010 to January 2022, in 19 countries, and assessed the spectrum of FLD using non-invasive risk scores; 23 scores for NAFLD diagnosis and 32 scores for NASH diagnosis were summarized. The most commonly risk scores identified were FLI [28–30,32,34,35,37] for NAFLD, and FIB-4 [45,47–51,53–58,61,64,66], NFS [45,47–50,53–55,57,61,62,64,66], APRI [45,47,49,50,54,55,58,60,61,64], and BARD Score [45,47,49,50,53,55,56,60,64,66] for NASH. The risk scores with the highest diagnostic accuracy were FLI (AUC 0.76) for NAFLD, classified as a good accuracy diagnostic and APRI (AUC 0.83) for NASH, classified as a very good diagnostic accuracy. Along with a moderate-moderate and low-moderate certainty of the evidence, respectively.
Previous studies performed systematic reviews of established NAFLD and NASH diagnosis [11,67–70]. Similarities with these studies are that there are a lot of different risk scores with limited performance, also the need for further research to validate the existing scores in similar worldwide populations to reduce heterogeneity and produce better analysis for a solid recommendation. In this review, the outcomes were organized to reduce heterogeneity excluding population with comorbidities, and studies that focused on mortality and complications. This review is analyzing only observational studies and focuses on the diagnostic accuracy of risk scores, intending to study which have a higher sensibility and specificity in the general population, to help in primary care attention to a first prediction of the diagnostic. Previous studies do not validated tools that evaluate the risk of bias or publication bias, which is a cornerstone in clinical decision making.
Our study agrees that further research is needed to apply new diagnostic risk scores for NAFLD, which can eventually validate serum biomarkers of steatosis and advanced stages of FLD and effectively replace imaging methods. Providing aid for timely treatment and referral to specialists [5,69].
Lee et al. synthesized the ability of only three risk scores (FLI, APRI, and NFS) in prognosticating NAFLD-related events and divided them into three main categories, fibrosis, liver-related events, and mortality. The review included 13 studies with the limitations of not having a standard population, cut-off values, and follow-up periods; reasons why this study did not provide a meta-analysis [70].
Limitations of this study include a wide age range with no stratification of the age of the population (35-76 years) since older age is a significant risk factor for FLD and its progression [3]. However, this data was not standardized in all the studies and therefore, we could not stratify age groups. A comprehensive search was conducted for studies with risk scores for NAFLD and NASH; though studies without a clear report of the risk score, target population, or outcome could have been omitted. However, a systematic process was followed for the search, reporting results, and interpreting the evidence. A suggested small publication bias was identified in the AST/ ALT meta-analysis, due to small sample size. Additionally, this study has some strengths. First, it compiles updated information about the different risk prediction scores for FLD (NAFLD and NASH), which provide current data to improve the diagnosis and treatment of patients with FLD and at risk of fibrosis [3]. Reviewing observational studies lets us analyze how these risk scores behave in a general population providing policymakers a public health perspective. Also, this study provides data display so that primary care centers can identify the diagnostic risk scores appropriate with their preventive measures and provide an early referral to specialists, such as FLI, to diagnose liver steatosis.
5ConclusionsThe present study adds a detailed synthesis of the existing risk prediction scores, the data synthetized in the meta-analysis bring a pool measure of the most validated scores and by the certainty of the evidence, it is useful to recognize the scores that fit with good diagnostic accuracy and met good methodology criteria.
The FLI for NAFLD and APRI for NASH were the risk scores with the highest prognostic value in the included studies. Although there are different development models in 19 countries (Mainly USA, China and Japan), future research may consider validating existing scores in different populations to improve homogeneous comparison and a robust pool analysis. The need of the health systems to absorb the global burden of disease of NAFLD and the absence of widely accepted diagnostic scores make it challenging for health care decision-makers to recommend FLD screening in the community. Including the limitations that image and histology studies have in primary health care settings.
FundingThis research did not receive any specific grant from funding agencies in the public, commercial, or not-for-profit sectors.
Supplementary Fig. 1. Risk of bias and applicability concerns graph and summary for a)NAFLD and b)NASH studies
Supplementary Fig. 2. Funnel plot for the meta-analysis of non-alcoholic steatohepatitis (NASH) using five predictive models: (a) AST to platelet ratio index (APRI); (b) Fibrosis-4 score (FIB-4); (c) aspartate aminotransferase (AST)/alanine transaminase (ALT) ratio; (d) BARD score; (e) NAFLD Fibrosis score (NFS) and NAFLD (f) FIL.
CRediT authorship contribution statementDaniela Contreras: Conceptualization, Formal analysis, Writing – original draft, Writing – review & editing. Alejandra González-Rocha: Methodology, Formal analysis, Data curation, Writing – original draft, Writing – review & editing. Patricia Clark: Conceptualization, Writing – review & editing. Simón Barquera: Conceptualization, Writing – review & editing. Edgar Denova-Gutiérrez: Conceptualization, Formal analysis, Writing – original draft, Writing – review & editing.
This work was carried out during the period 2021 to 2022. DC received a scholarship from CONACyT to obtain a Ph.D. degree (CVU 392126). Raquel Temesvari, DNP, for language and writing assistance for this study.


