


Cirrhotic patients with acute variceal hemorrhage (AVH) have high short-term mortality. Established prognostic scores are seldom applicable clinically, partially because they need external validation or contain subjective variables. We aimed to develop and validate a practical prognostic nomogram based on objective predictors to predict prognosis for cirrhotic patients with AVH.
Patients and MethodsWe enrolled 308 AVH patients with cirrhosis from our center as the derivation cohort to develop a new nomogram using logistic regression and validated it in cohorts of patients from Medical Information Mart for Intensive Care (MIMIC) III (n = 247) and IV (n = 302).
ResultsInternational normalized ratio (INR), albumin (ALB) and estimated glomerular filtration rate (eGFR) were identified as predictors for inpatient mortality and a nomogram was constructed based on them. The nomogram discriminated well in both derivation and MIMIC-III/-IV validation cohorts with the area under the receiver operating characteristic curves (AUROCs) of 0.846 and 0.859/0.833, respectively and showed a better agreement between expected and observed outcomes (Hosmer-Lemeshow tests, all comparisons, P > 0.05) than other scores in all cohorts. Our nomogram had the lowest Brier scores (0.082/0.114/0.119 in training/MIMIC-III/MIMIC-IV) and highest R2 (0.367/0.393/0.346 in training/MIMIC-III/MIMIC-IV) compared to the recalibrated model for end-stage liver disease (MELD), MELD-hepatic encephalopathy (MELD-HE) and cirrhosis acute gastrointestinal bleeding (CAGIB) scores in all cohorts.
ConclusionsWe developed a practical prognostic nomogram using easily verified indicators available in initial patient evaluation, which may serve as a reliable tool to accurately predict inpatient mortality for cirrhotic patients with AVH.
Approximately two million people worldwide die from liver disease each year, one million of whom die from complications of cirrhosis [1]. Acute variceal hemorrhage (AVH) is one of the lethal complications of portal hypertension in cirrhosis, with a high short-term mortality rate of about 20% [2]. Up to 15% of AVH patients undergo endoscopic hemostasis failure, and the mortality rate in these patients reaches 60% [3]. Consequently, guidelines highlight the importance of risk stratification of AVH patients [4].
Prognostic models of mortality risk are of great significance for identifying high-risk patients and guiding clinical decisions. Current widely used prognostic scores for patients having liver cirrhosis with AVH can be divided into two types: liver disease severity risk scores and upper gastrointestinal bleeding (UGIB) risk stratification algorithms. The liver disease severity risk scores mainly include the Child-Pugh score (CP), Model for End-Stage Liver Disease (MELD), recalibrated MELD, MELD-hepatic encephalopathy (MELD-HE) and Albumin-Bilirubin (ALBI) scores [5–8]. However, the presence or absence and the extent of hepatic encephalopathy and ascites, which are components of CP and MELD-HE, are subjective criteria resulting in an inevitable discrepancy between different persons. Furthermore, the CP and MELD scores were constructed more than 20 years ago and ALBI was developed for patients with hepatocellular carcinoma [9], so they might not apply to current AVH patients. The recalibrated MELD was designed for AVH patients, but its prognostic role in inpatient mortality is unclear. Multiple UGIB risk scoring systems have been generated (e.g., Glasgow-Blatchford (GBS), AIMS65 and Rockall scores) to assess the prognosis of upper gastrointestinal bleeding [10]. However, these scores are disappointing when predicting adverse outcomes for variceal hemorrhage patients [11]. In addition, the cirrhosis acute gastrointestinal bleeding (CAGIB) system recently developed by Bai et al. for assessing the prognosis of cirrhotic patients with gastrointestinal bleeding (GIB) is seldom used, partly because it lacks further external validation [12]. Therefore, an objective and precise death risk stratification score specific to the setting of cirrhotic variceal hemorrhage is needed.
Our study aimed to develop a novel death risk prognostic nomogram with contemporary data for cirrhotic patients with AVH using objective and initial accessible components and validate its performance in other separate cohorts among AVH subjects.
2Materials and Methods2.1Patient populationWe retrospectively screened the clinical records of all patients with the cirrhotic acute gastrointestinal hemorrhage who visited the Affiliated Hospital of Southwest Medical University from January 2019 through December 2021. Among these, patients with the sources of hemorrhage from esophageal or gastric varices were thought eligible for this study. The diagnosis of cirrhosis was based on liver biopsy and/or compatible clinical, laboratory, and radiologic evidence. Variceal hemorrhage was defined as hematemesis and/or melena, accompanied by the identification of esophageal or gastric varices during endoscopy and the absence of any other lesion that could explain the bleeding episode [13]. Exclusion criteria were liver or other organ malignant tumors, incomplete records, or missing data on admission.
2.2Data collectionWe collected the following data: age, gender, ethnicity, etiology of liver cirrhosis, diabetes, ascites, hepatic encephalopathy (HE), and laboratory data at admission, including white blood cell (WBC), hemoglobin (HB), mean corpuscular volume (MCV), mean corpuscular hemoglobin (MCH), platelet (PLT), international normalized ratio (INR), alanine aminotransferase (ALT), aspartate aminotransferase (AST), alkaline phosphatase (ALP), albumin (ALB), total bilirubin (TBil), serum creatinine (SCr), blood urea nitrogen (BUN), potassium (K), sodium (Na), and in-hospital death. Estimated glomerular filtration rate (eGFR) by the Chronic Kidney Disease Epidemiology Collaboration equation (CKD-EPI) [14], recalibrated MELD [15], MELD-HE [6], and CAGIB [12] scores were calculated (Formulas are described in supplementary material). Inpatient death was defined as all-cause death. All patients were managed with standard care, including vasoactive drugs, prophylactic antibiotics, and endoscopy. The vasoactive drugs contained terlipressin, somatostatin, and octreotide. The endoscopic therapy included ligation or tissue adhesive injection [16].
2.3Statistical analysisContinuous variables are expressed as medians with interquartile range (IQR) and categorical variables as percentages. The difference between training and validation cohorts was compared using the Kruskal-Wallis test and the chi-square test or the Fisher exact test. If the initial test reveals statistically significant differences among the groups, the Mann-Whitney U test with appropriate Bonferroni correction is used for pairwise comparisons to determine the between-groups difference. In the training cohort, logistic regression analysis was used to identify predictive factors of inpatient mortality. Variables with a P value less than 0.05 and clinically relevant variables were enrolled in stepwise logistic regression, and then the multivariate logistic regression model was fitted. All candidate variables were restricted as objective variables available for the initial assessment after admission (recalibrated MELD, MELD-HE, and CAGIB models were not enrolled in stepwise logistic regression). The variance inflation factor (VIF) was used to test the collinearity between variables included in the final model, and the VIF ≤ 2 is acceptable.
The accuracy of the prognostic scores was assessed in terms of discrimination (the ability to distinguish patients who died from patients who did not) and calibration (how well the prediction matches the actual outcome) [17]. Discrimination performance was measured using the area under the receiver operating characteristic curve (AUROC), which was compared according to the DeLong test. Calibration was analyzed by the Hosmer-Lemeshow test (P > 0.05 indicates no significant differences between expected and observed outcomes; The higher the P value indicates the better agreement between observations and predictions) and plotting predicted and observed mortalities (The closer the points are to the diagonal means the better calibration). The overall performance was evaluated with brier scores and R2 (The lower brier score and higher R2 show better performance).
External validation: The novel model was validated in two separate patient cohorts presenting with liver cirrhosis and variceal hemorrhage extracted from the Medical Information Mart for Intensive Care III/-IV (MIMIC-III/-IV) database. MIMIC-III contains data for over 58,000 admissions from 2001 to 2012 and MIMIC-IV includes more than 382,000 admissions from 2008 to 2019 to Beth Israel Deaconess Medical Center in Boston [18–20]. The validation sets adopted the same inclusion and exclusion criteria as well as the evaluation method. Access to the database for research was approved by the Institutional Review Board of the Beth Israel Deaconess Medical Center and Massachusetts Institute of Technology after completion of the NIH web-based course. Given that all patients were anonymous, informed consent was not needed.
Analyses were accomplished using R 4.1.2 (http://www.R-project.org/) with the packages ggplot2, MASS, rms, pROC, DynNom, etc., MedCalc V.19.0.4 and SPSS V.22.0 software. Statistical significance was set at P < 0.05 (2-sided).
2.4Ethical StatementThe ethical committees of Affiliated Hospital of Southwest Medical University (KY2022173) and Beth Israel Deaconess Medical Center both approved this study and individual consent was both waived because of anonymous patient information. We obtained the data in the MIMIC database after completing the online course and examination (Record ID: 46961999).
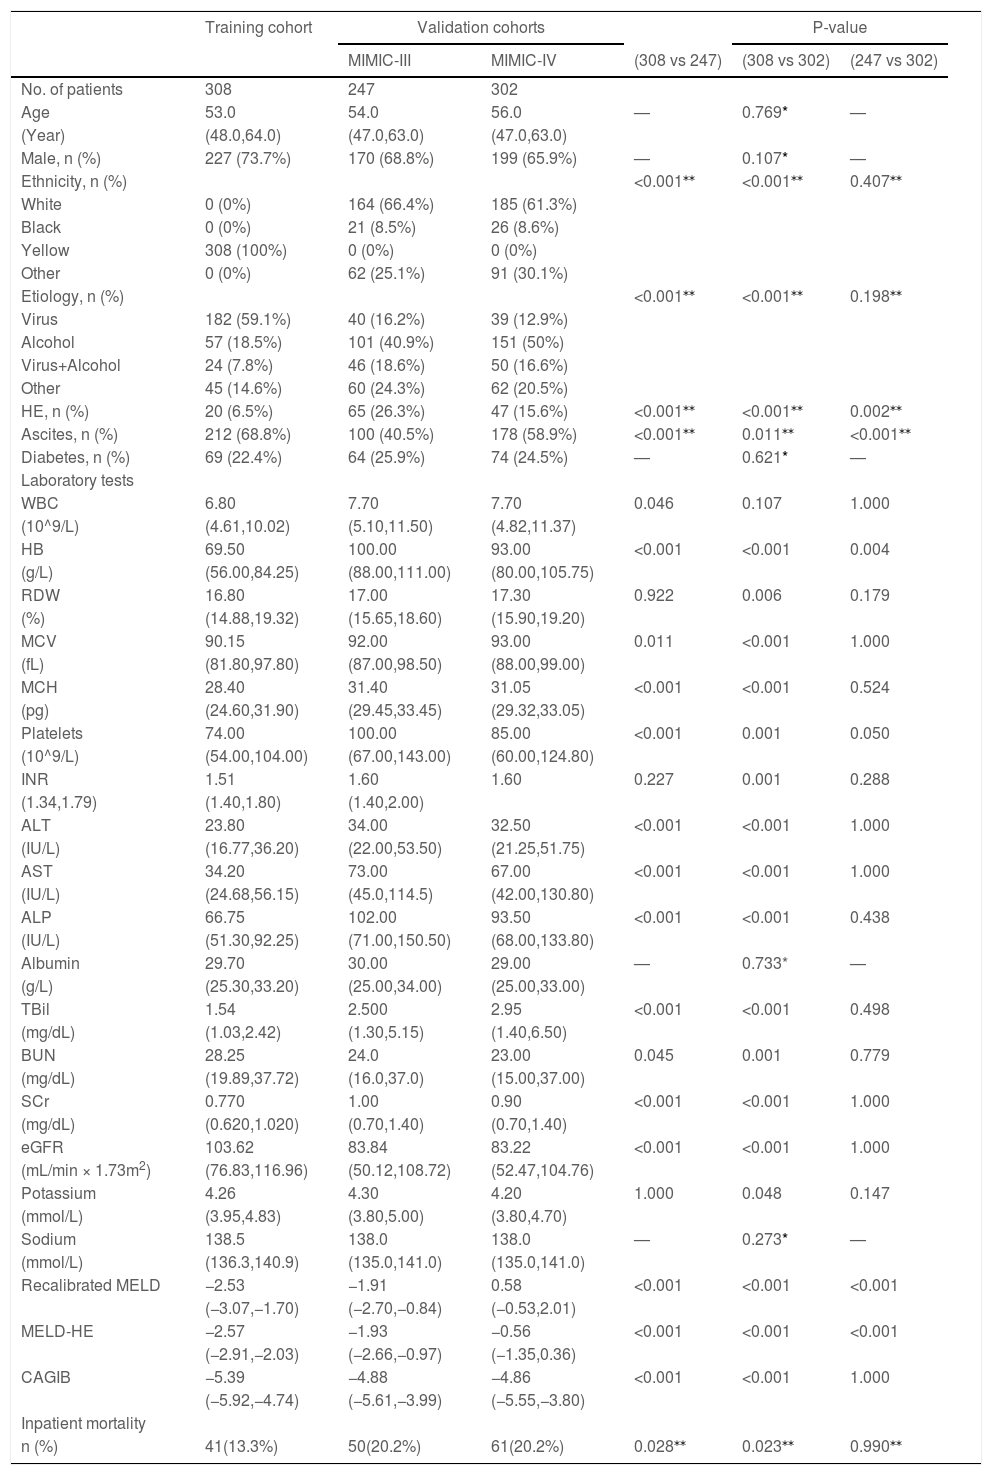
3Results3.1Patients and clinical characteristicsA total of 308 consecutive cirrhotic patients with AVH from the Affiliated Hospital of Southwest Medical University were recruited as a training cohort. There were 247 and 302 patients from the MIMIC-III and MIMIC-IV databases as validation cohorts, respectively (Fig. 1). Table 1 summarizes the baseline characteristics of the training and validation cohorts. The median age was 53 years (IQR 48–64 years) in the training set and 54 years (IQR 47–63 years)/56 years (IQR 48–62 years) in the MIMIC-III/-IV validation sets. Males make up the vast majority in both training and validation cohorts (73.7%, 68.8%, and 65.9%, respectively, in the training and MIMIC-III and MIMIC-IV validation cohorts). Viral hepatitis and alcohol were the major cause of liver cirrhosis in the training and validation cohorts, respectively. Compared with the validation cohorts, the training cohort had fewer patients complicated with hepatic encephalopathy and more patients with ascites. In terms of laboratory tests, there were significant differences between training and validation patients except for albumin and sodium. The subjects in training sets had markedly lower HB, PLT, ALT, AST, ALP, TBil and SCr but had significantly higher BUN and eGFR than patients in validation sets. The inpatient mortality rates in the training set, MIMIC-III and MIMIC-IV sets were 13.3% (41/308), 20.2% (50/247), and 20.2% (61/302), respectively.

Baseline characteristics of patients in the training and validation cohorts.
| Training cohort | Validation cohorts | P-value | ||||||||||
|---|---|---|---|---|---|---|---|---|---|---|---|---|
| MIMIC-III | MIMIC-IV | (308 vs 247) | (308 vs 302) | (247 vs 302) | ||||||||
| No. of patients | 308 | 247 | 302 | |||||||||
| Age | 53.0 | 54.0 | 56.0 | — | 0.769* | — | ||||||
| (Year) | (48.0,64.0) | (47.0,63.0) | (47.0,63.0) | |||||||||
| Male, n (%) | 227 (73.7%) | 170 (68.8%) | 199 (65.9%) | — | 0.107* | — | ||||||
| Ethnicity, n (%) | <0.001⁎⁎ | <0.001⁎⁎ | 0.407⁎⁎ | |||||||||
| White | 0 (0%) | 164 (66.4%) | 185 (61.3%) | |||||||||
| Black | 0 (0%) | 21 (8.5%) | 26 (8.6%) | |||||||||
| Yellow | 308 (100%) | 0 (0%) | 0 (0%) | |||||||||
| Other | 0 (0%) | 62 (25.1%) | 91 (30.1%) | |||||||||
| Etiology, n (%) | <0.001⁎⁎ | <0.001⁎⁎ | 0.198⁎⁎ | |||||||||
| Virus | 182 (59.1%) | 40 (16.2%) | 39 (12.9%) | |||||||||
| Alcohol | 57 (18.5%) | 101 (40.9%) | 151 (50%) | |||||||||
| Virus+Alcohol | 24 (7.8%) | 46 (18.6%) | 50 (16.6%) | |||||||||
| Other | 45 (14.6%) | 60 (24.3%) | 62 (20.5%) | |||||||||
| HE, n (%) | 20 (6.5%) | 65 (26.3%) | 47 (15.6%) | <0.001⁎⁎ | <0.001⁎⁎ | 0.002⁎⁎ | ||||||
| Ascites, n (%) | 212 (68.8%) | 100 (40.5%) | 178 (58.9%) | <0.001⁎⁎ | 0.011⁎⁎ | <0.001⁎⁎ | ||||||
| Diabetes, n (%) | 69 (22.4%) | 64 (25.9%) | 74 (24.5%) | — | 0.621* | — | ||||||
| Laboratory tests | ||||||||||||
| WBC | 6.80 | 7.70 | 7.70 | 0.046 | 0.107 | 1.000 | ||||||
| (10^9/L) | (4.61,10.02) | (5.10,11.50) | (4.82,11.37) | |||||||||
| HB | 69.50 | 100.00 | 93.00 | <0.001 | <0.001 | 0.004 | ||||||
| (g/L) | (56.00,84.25) | (88.00,111.00) | (80.00,105.75) | |||||||||
| RDW | 16.80 | 17.00 | 17.30 | 0.922 | 0.006 | 0.179 | ||||||
| (%) | (14.88,19.32) | (15.65,18.60) | (15.90,19.20) | |||||||||
| MCV | 90.15 | 92.00 | 93.00 | 0.011 | <0.001 | 1.000 | ||||||
| (fL) | (81.80,97.80) | (87.00,98.50) | (88.00,99.00) | |||||||||
| MCH | 28.40 | 31.40 | 31.05 | <0.001 | <0.001 | 0.524 | ||||||
| (pg) | (24.60,31.90) | (29.45,33.45) | (29.32,33.05) | |||||||||
| Platelets | 74.00 | 100.00 | 85.00 | <0.001 | 0.001 | 0.050 | ||||||
| (10^9/L) | (54.00,104.00) | (67.00,143.00) | (60.00,124.80) | |||||||||
| INR | 1.51 | 1.60 | 1.60 | 0.227 | 0.001 | 0.288 | ||||||
| (1.34,1.79) | (1.40,1.80) | (1.40,2.00) | ||||||||||
| ALT | 23.80 | 34.00 | 32.50 | <0.001 | <0.001 | 1.000 | ||||||
| (IU/L) | (16.77,36.20) | (22.00,53.50) | (21.25,51.75) | |||||||||
| AST | 34.20 | 73.00 | 67.00 | <0.001 | <0.001 | 1.000 | ||||||
| (IU/L) | (24.68,56.15) | (45.0,114.5) | (42.00,130.80) | |||||||||
| ALP | 66.75 | 102.00 | 93.50 | <0.001 | <0.001 | 0.438 | ||||||
| (IU/L) | (51.30,92.25) | (71.00,150.50) | (68.00,133.80) | |||||||||
| Albumin | 29.70 | 30.00 | 29.00 | — | 0.733* | — | ||||||
| (g/L) | (25.30,33.20) | (25.00,34.00) | (25.00,33.00) | |||||||||
| TBil | 1.54 | 2.500 | 2.95 | <0.001 | <0.001 | 0.498 | ||||||
| (mg/dL) | (1.03,2.42) | (1.30,5.15) | (1.40,6.50) | |||||||||
| BUN | 28.25 | 24.0 | 23.00 | 0.045 | 0.001 | 0.779 | ||||||
| (mg/dL) | (19.89,37.72) | (16.0,37.0) | (15.00,37.00) | |||||||||
| SCr | 0.770 | 1.00 | 0.90 | <0.001 | <0.001 | 1.000 | ||||||
| (mg/dL) | (0.620,1.020) | (0.70,1.40) | (0.70,1.40) | |||||||||
| eGFR | 103.62 | 83.84 | 83.22 | <0.001 | <0.001 | 1.000 | ||||||
| (mL/min × 1.73m2) | (76.83,116.96) | (50.12,108.72) | (52.47,104.76) | |||||||||
| Potassium | 4.26 | 4.30 | 4.20 | 1.000 | 0.048 | 0.147 | ||||||
| (mmol/L) | (3.95,4.83) | (3.80,5.00) | (3.80,4.70) | |||||||||
| Sodium | 138.5 | 138.0 | 138.0 | — | 0.273* | — | ||||||
| (mmol/L) | (136.3,140.9) | (135.0,141.0) | (135.0,141.0) | |||||||||
| Recalibrated MELD | −2.53 | −1.91 | 0.58 | <0.001 | <0.001 | <0.001 | ||||||
| (−3.07,−1.70) | (−2.70,−0.84) | (−0.53,2.01) | ||||||||||
| MELD-HE | −2.57 | −1.93 | −0.56 | <0.001 | <0.001 | <0.001 | ||||||
| (−2.91,−2.03) | (−2.66,−0.97) | (−1.35,0.36) | ||||||||||
| CAGIB | −5.39 | −4.88 | −4.86 | <0.001 | <0.001 | 1.000 | ||||||
| (−5.92,−4.74) | (−5.61,−3.99) | (−5.55,−3.80) | ||||||||||
| Inpatient mortality | ||||||||||||
| n (%) | 41(13.3%) | 50(20.2%) | 61(20.2%) | 0.028⁎⁎ | 0.023⁎⁎ | 0.990⁎⁎ | ||||||
Statistical significance was set at p < 0.017 (0.05 divided by 3) beacuse of multiple comparisons. HE, hepatic encephalopathy; WBC, white blood cells; HB, hemoglobin; RDW, red blood cell distribution width; MCV, mean corpuscular volume; MCH, mean corpuscular hemoglobin; INR, international normalized ratio; ALT, alanine aminotransferase; AST, aspartate aminotransferase; ALP, alkaline phosphatase; TBil, total bilirubin; BUN, blood urea nitrogen; SCr, serum creatinine; eGFR, estimated glomerular filtration rate; Recalibrated MELD, recalibrated model for end-stage liver disease; MELD-HE, model for end-stage liver disease-hepatic encephalopathy; CAGIB, cirrhosis acute gastrointestinal bleeding.
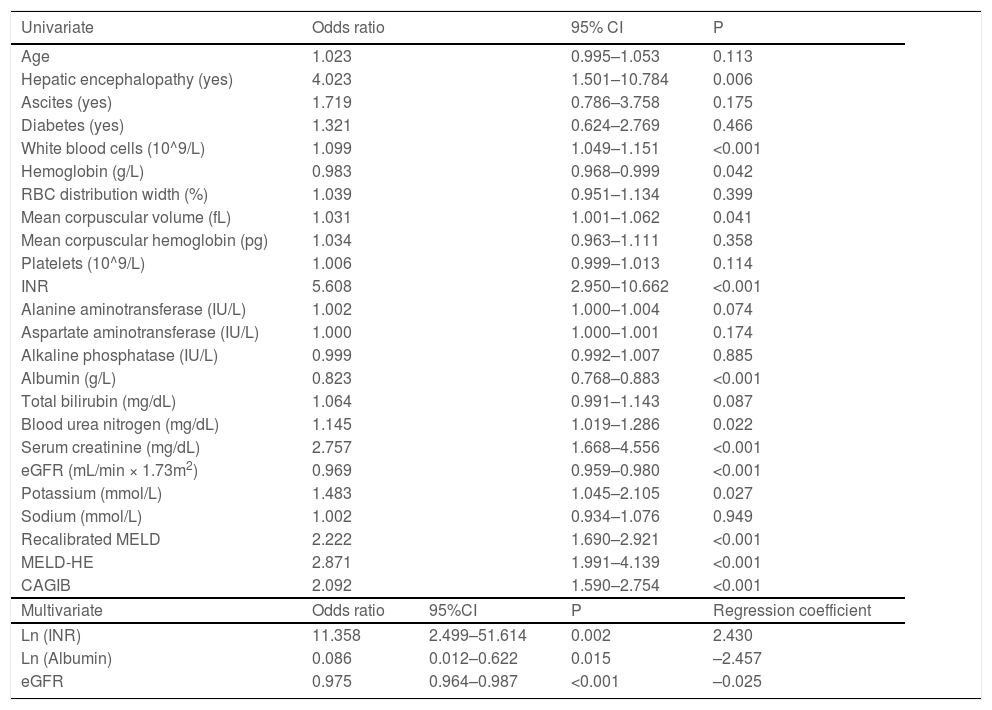
Univariate logistic regression analyses identified that HE, WBC, HB, MCV, INR, ALB, BUN, SCr, eGFR, and K were significantly associated with inpatient mortality. The above variables were log-transformed except eGFR for the stepwise logistic regression analysis. Finally, eGFR and log-transformed ALB and INR were selected. Then we fitted a logistic regression model with these factors. Multivariate logistic regression analyses showed that ln (INR) [OR, 11.358; 95% confidence interval (CI), 2.499-51.614; P = 0.002], ln (ALB) [OR, 0.086; 95% CI, 0.012-0.622; P = 0.015], and eGFR [OR, 0.975; 95% CI, 0.964-0.987; P < 0.001] were independently associated with in-hospital death (Table 2). A new nomogram called liver cirrhosis and variceal bleeding (LCVB) (Fig. 2) was constructed based on the above independent risk factors. An online calculator to estimate the predicted death rate is available on the website (https://yatou.shinyapps.io/dynnomapp/) to facilitate its application.
Univariate and multivariate analyses of factors associated with inpatient mortality in training set.
RBC, red blood cell; INR, international normalized ratio; eGFR, estimated glomerular filtration rate; Recalibrated MELD, recalibrated model for end-stage liver disease; MELD-HE, model for end-stage liver disease-hepatic encephalopathy; CAGIB, cirrhosis acute gastrointestinal bleeding.
 for assessment of the risk of in-hospital death.")
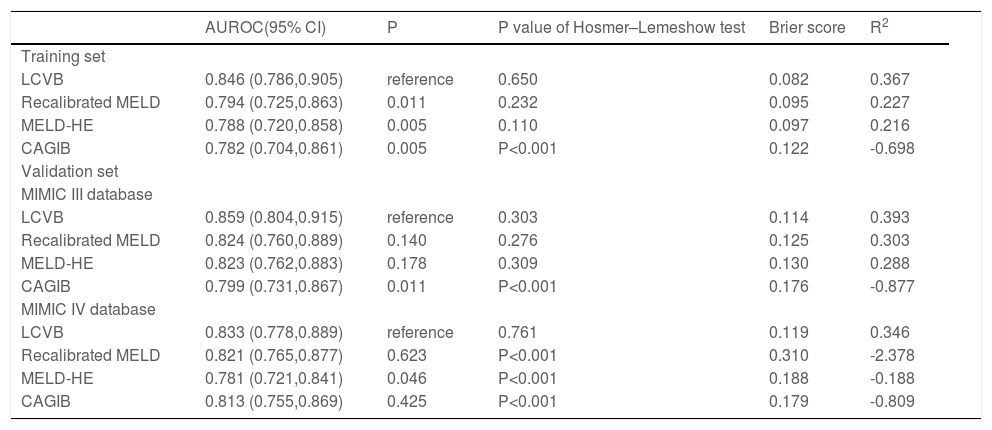
A characteristic operating curve (ROC) was conducted to evaluate the discriminatory performance of in-hospital death, and we compared the predictive power of LCVB with the recalibrated MELD, MELD-HE, and CAGIB (Fig. 3A). The AUROC value of LCVB was 0.846 (95% CI 0.786-0.905) in the training cohort, which was significantly higher than those of the other prognostic scores. Calibration of LCVB (Hosmer-Lemeshow χ² = 5.977, P = 0.650) was similar to recalibrated MELD (Hosmer-Lemeshow χ² = 10.489, P = 0.232) and MELD-HE (Hosmer-Lemeshow χ² = 13.057, P = 0.110), but better than CAGIB (Hosmer-Lemeshow χ² = 540.34, P < 0.001). The calibration plots are shown in Fig. 4 (A-D). The Brier score evaluating the discrimination and calibration performance of the LCVB was less than 0.1 (Table 3).

ROC curves. A–C came from the training, MIMIC-III, and MIMIC-IV cohorts, respectively. LCVB, liver cirrhosis and variceal bleeding; Recalibrated MELD, recalibrated model for end-stage liver disease; MELD-HE, model for end-stage liver disease-hepatic encephalopathy; CAGIB, cirrhosis acute gastrointestinal bleeding.
, MIMIC-III (E-H), and MIMIC-IV cohort (I-L). The sample was split into quintiles to construct these plots and predicted mortality was plotted against observed mortality. Triangles below the diagonal line indicate overestimated mortality for that group. Triangles above the diagonal line indicate an underestimation of mortality. LCVB, liver cirrhosis and variceal bleeding; Recalibrated MELD, recalibrated model for end-stage liver disease; MELD-HE, model for end-stage liver disease-hepatic encephalopathy; CAGIB, cirrhosis acute gastrointestinal bleeding.")
Calibration plots. The calibration plot describes the consistency of different prognostic scores between the expected and observed mortality of the training cohort (A-D), MIMIC-III (E-H), and MIMIC-IV cohort (I-L). The sample was split into quintiles to construct these plots and predicted mortality was plotted against observed mortality. Triangles below the diagonal line indicate overestimated mortality for that group. Triangles above the diagonal line indicate an underestimation of mortality. LCVB, liver cirrhosis and variceal bleeding; Recalibrated MELD, recalibrated model for end-stage liver disease; MELD-HE, model for end-stage liver disease-hepatic encephalopathy; CAGIB, cirrhosis acute gastrointestinal bleeding.
Performance of the evaluated models
NOTE: AUROC evaluates the discrimination of the model: higher values suggest better discrimination. Hosmer–Lemeshow test evaluates the calibration of the model: a higher P value suggests better calibration. Brier score and R2 provide a whole evaluation of the model (discrimination and calibration): a lower Brier score and a higher R2 suggest better performance. LCVB, liver cirrhosis and variceal bleeding; Recalibrated MELD, recalibrated model for end-stage liver disease; MELD-HE, model for end-stage liver disease-hepatic encephalopathy; CAGIB, cirrhosis acute gastrointestinal bleeding.
The external validity of our model was examined in two cohorts from another country. In the MIMIC III cohort (Fig. 3B), the AUROCs of LCVB, recalibrated MELD, MELD-HE, and CAGIB scoring systems were 0.859 (95% CI 0.804–0.915), 0.824 (95% CI 0.760-0.889), 0.823 (95% CI 0.762-0.883), and 0.799 (95% CI 0.731-0.867), respectively. The difference was statistically significant between LCVB and CAGIB scores (P = 0.011) but not between recalibrated MELD or MELD-HE. In the MIMIC-IV cohort (Fig. 3C), the AUROC values of LCVB, recalibrated MELD, MELD-HE, and CAGIB predictive models were 0.833 (95% CI 0.778-0.889), 0.821 (95% CI 0.765-0.877), 0.781 (95% CI 0.721-0.841), and 0.813 (95% CI 0.755-0.869), respectively. The difference was statistically significant between LCVB and MELD-HE scores (P = 0.046) but not between recalibrated MELD or CAGIB. Fig. 4 (E/I) showed the calibration plots for the LCVB in external datasets. The differences between expected and observed outcomes tested by Hosmer-Lemeshow were not statistically significant (χ² = 9.487/4.970 and P = 0.303/0.761 for the MIMIC-III/-IV cohorts) in two validation sets. The mortality rate was overestimated by recalibrated MELD and MELD-HE in MIMIC-IV (Fig. 4 J/K). The CAGIB scoring system is poorly calibrated in all patient cohorts (Fig. 4 D/H/L). These findings suggested that LCVB provided a better fit to the available data than other prognostic scores. The Brier scores of the LCVB (0.114/0.119 for the MIMIC-III/-IV cohorts) were the lowest compared to recalibrated MELD (0.125/0.310 for the MIMIC-III/-IV cohorts), MELD-HE (0.130/0.188 for the MIMIC-III/-IV cohorts) and CAGIB (0.176/0.179 for the MIMIC-III/-IV cohorts). The values of R2 of the LCVB (0.393/0.346 for the MIMIC-III/-IV cohorts) remained highest (0.393/0.346 for the MIMIC-III/-IV cohorts) compared to recalibrated MELD (0.303/-2.378 for the MIMIC-III/-IV cohorts), MELD-HE (0.288/-0.188 for the MIMIC-III/-IV cohorts) and CAGIB (-0.877/-0.809 for the MIMIC-III/-IV cohorts) (Table 3). The Brier score and R2 confirmed that LCVB overall discrimination and calibration evaluation was optimal.
4DiscussionThe early prognostic assessment of cirrhotic patients with AVH is beneficial in improving survival. In this study, we developed a new prognostic nomogram that includes only three objective and easily accessible clinical indicators: INR, ALB and eGFR. It performed slightly better than other models designed to predict the prognosis of AVH patients in our internal and external datasets.
In our study, INR was a risk factor and ALB and eGFR were protective factors for inpatient mortality. INR and ALB are common components in existing scores, such as MELD and CP scores, which have been reported in previous studies to be associated with mortality in patients having liver disease [21,22]. INR is an index of liver reserve and coagulation function. Coagulation factors are almost all synthesized in the liver [23]. Fewer functioning hepatocytes result in fewer coagulation factors. On the other hand, patients with cirrhosis are often accompanied by thrombocytopenia and dysfunction due to hypersplenism, which further slows down the coagulation process [24]. Therefore, the elevated INR reflected the progression and severity of the liver disease. ALB is an indicator of liver function and nutritional status and is associated with oxidative stress and systemic inflammatory response [25]. In this clinical setting, mortality seems to be more related to the severity of liver disease and complications derived from bleeding (such as infection) than to the bleeding itself [26,27]. ALB is exclusively produced by the liver and the sharply decreased serum ALB level implies deterioration of liver function [28]. Infection and malnutrition are risk factors for death in bleeding patients with liver cirrhosis [29,30] and ALB is inversely correlated with the magnitude of inflammatory and nutritional risk [31], which accounts for poor prognosis. Our study found that ALB is a protective factor for AVH patients with cirrhosis, which is supported by the finding that ALB infusion can improve the prognosis of these patients [32]. eGFR is associated with kidney function. Renal dysfunction is common in cirrhotic patients and is associated with diminished survival [33]. Bleeding is known to further aggravate renal function and reduce GFR due to reduced renal perfusion. Previous prognostic models (e.g., MELD) generally used creatinine to assess renal function. However, creatinine is influenced by age, gender, and race [34]. CKD-EPI estimated glomerular filtration rate takes into account these variables [14], so eGFR was selected rather than creatinine after multivariate analyses could be expected. The incorporation of eGFR into MELD proposed by Asiani et al. may improve the prediction of mortality [35].
The CP and recalibrated MELD scores are traditionally reliable prognostic scores in cirrhotic patients with AVH [36]. However, the CP score has subjective variables (e.g., the grade of HE) that are prone to inconsistent predictions. As for the recalibrated MELD score, the calibration of recalibrated MELD is unstable in our study, although with satisfactory discriminative ability, which is consistent with what was previously reported [37,38]. However, good calibration is critical to deriving decision thresholds to guide decision-making. There were some explanations for the results. First, the recalibrated MELD score was established nearly ten years ago and it may not apply to current AVH patients considering the improvement of therapies that alter disease prognosis. Second, the MELD score was updated for 6-week mortality in AVH patients, which means recalibrated MELD may be poor at predicting in-hospital death. Indeed, questions have been raised about whether the predictive power of MELD has decreased in the modern era [39]. The MELD-HE and CAGIB are new models recently developed for bleeding patients with cirrhosis, but their prognostic values need further validation across centers, and they still contain subjective variables [6,12,18,27]. In our study, LCVB showed better performance than CAGIB. It's worth noting that CAGIB was established based on a wider comprehensive range of patients and included hepatocellular carcinoma (HCC) as a predictor. As a result, the prognostic capacity of CAGIB had been compromised in our research. All in all, the predictive performances of the above scoring systems in variceal bleeding patients are variable and controversial, especially in predicting in-hospital outcomes, because current evidence is limited by insufficient sample sizes, selection bias, different endpoints, subjects, or uneven levels of diagnosis and treatment.[5,40,41]. We constructed a nomogram called LCVB stratified by mortality risk and generated a web calculator based on LCVB to facilitate its clinical application. Our model has the following advantages. On the one hand, the factors enrolled in our model were objective, non-invasive, inexpensive, and available on admission, so they can be applied to hospitals of different classes. On the other hand, LCVB was well validated in additional series of patients from another continent with very different demographics, etiology and even severity of the disease. Demographic differences among training and validation cohorts were noted in ethnicity and several laboratory indexes. The main etiology of liver disease was viral hepatitis in our center but it was alcohol in MIMIC cohorts. There was less hemoglobin value in the training group compared to the validation group. However, it is noted that differences in hemoglobin are common issues in different studies from different countries and regions [12,42]. We speculated that the heterogeneity might be associated with ethnicity and country. In addition, patients in the training cohort had better liver and renal function compared to validation cohorts. These data demonstrated that LCVB had a wide range of applications and inclusiveness.
We are aware that there are some limitations. LCVB was not compared with UGIB risk scores (e.g., GBS and AIMS65) and CP score because some components that existed in these scores were not available in the MIMIC database. Another limitation is the potential heterogeneity in care across medical centers. Prospective studies are needed to further validate the performance of LCVB in predicting mortality among AVH patients to confirm our results.
5ConclusionsIn summary, we developed a novel prediction nomogram adopting non-invasive and easily verified clinical indicators after admission for inpatient mortality of patients with cirrhotic variceal hemorrhage. The LCVB showed promising prognostic value in bleeding patients having cirrhosis and may be served as a useful alternative tool for prognosticating short-term outcomes in hospitals.
FundingThis research did not receive any specific grant from funding agencies in the public, commercial, or not-for-profit sectors.
Author contributionsMingming Deng and Gang Luo conceived and designed this study. Jie Chen, Sha Luo, Feng Tang, Ming Han, and Jie Zheng have the contributions of acquisition, analysis, and interpretation of all data. Jie Chen, Sha Luo, and Feng Tang drafted the manuscript. Mingming Deng and Gang Luo reviewed the manuscript.
We express our heartfelt thanks to all the participants.


