


Purpose. To explore the possible intermediary pathways through which diabetes mellitus (DM) adversely worsens hepatocellular carcinoma (HCC), focusing on cell life controllers as some transcription factors and inflammatory mediators.
Material and methods. Forty male albino rats were divided into four groups, control, cancer [given single intra-peritoneal (IP) dose of diethyl nitrosamine, NDEA, 125 mg/kg body weight], diabetic (given single dose of streptozotocin, STZ, 65 mg/kg) and cancer diabetic. HCC was initiated with NDEA, 3 weeks later, DM was induced with STZ. At 14th week, animals were sacrificed. Serum ALT, AST, GGT activities, AFP, IL-6, TNF-α levels and liver tissue Bax and Bcl2 proteins were measured. Liver sections were stained for histological examination. Both histological and AFP variations were chosen to prove cancer development.
Results. NDEA group showed significant increase in liver weight, serum ALT, AST, GGT, AFP, TNF-α, IL-6 and liver Bcl2 protein with decrease in total body weight, liver Bax protein and Bax/Bcl2 ratio. These effects were more pronounced in DENA plus STZ group. IL-6, TNF-α and Bcl2 were positively correlated while Bax and Bax/Bcl2 ratio were negatively correlated to AFP levels reflecting potential diagnostic value.
Conclusion. Co-induction of DM in the course of hepatocarcinogenesis can dramatically influence disease progression through inflammation and retarded apoptosis. The suggested apoptotic and inflammatory markers seem to be beneficial diagnostic tools for HCC and improve the diagnostic performance of AFP.
Hepatocellular carcinoma (HCC) is the third deadliest and fifth most common malignancy worldwide.1-4 It is a highly malignant tumor with high morbidity and mortality, showing poor prognosis due to its rapid infiltrating power and complicating liver cirrhosis.5,6 Hepatocarcinogenesis is a multi-factor, multi-step and complex process, which is associated with a background of chronic and persistent infection of hepatitis B or C virus, alcohol consumption or aflatoxin B1 exposure.7-9 HCCs are phenotypically (morphology and microscopy) and genetically heterogeneous tumors, possibly reflecting in part the heterogeneity of etiologic factors implicated in HCC development, the complexity of hepatocyte functions and the late stage at which HCCs usually become clinically symptomatic and detectable.10,11 Malignant transformation of hepatocytes may occur regardless the etiologic agent through a pathway of increased liver cell turnover, induced by chronic liver injury and regeneration in a context of inflammation, immune response, and oxidative DNA damage.12,13 Generally, epidemiology of HCC is characterized by marked demographic and geographic variations.14 It has been found that management of HCC is influenced not only by the tumor status and underlying liver function, but also by any other co-morbid illness. Diabetes is one of the most common co-morbid illnesses found in HCC patients that may directly influence the patient prognosis and survival.15,16
However, the pathophysiological mechanisms underlying this association is still not clear.17 Apoptosis represents a physiological way to eliminate excess cells during both liver development and regeneration.18,19 It is a highly preserved and controlled mechanism to achieve tissue homeostasis through targeted elimination of single cells without disrupting the biological functionality of the tissue. The morphological changes associated with apoptosis include nuclear condensation, cell shrinkage, and plasma membrane blobbing resulting in apoptotic bodies.20,21
Apoptotic signalling within the cell is transduced mainly via two molecular pathways; the death receptor pathway (the extrinsic pathway) and the mitochondrial pathway (the intrinsic pathway). Both of them activate a variety of proteases, mainly caspases (cysteinyl aspartate-specific proteases), and endonucleases, which finally degrade cellular components.22 The Bcl-2 family is the best characterized protein family involved in the regulation of apoptotic cell death. It includes both anti-apoptotic members (i.e. Bcl-2) and proapoptotic members (i.e. Bax), thus Bcl-2 family acts as a critical life-death decision point makers in the common pathway of apoptosis.23,24 While acute inflammation is a part of the defence response, chronic inflammation can lead to certain diseases as cancer and diabetes.25,26
Epidemiological studies have shown that chronic inflammation predisposes to certain cancers. Most precancerous and cancerous tissues show signs of inflammation; this involves the movement of innate immune cells into the tissue, the presence of specific inflammatory signalling molecules (i.e. cytokines and chemokines) changes in tissue structure (remodelling), and the formation of new blood vessels (angiogenesis). Further studies found that cancer-associated inflammation actually promotes tumour growth and progression.27,28 Several pro-inflammatory gene products (i.e. TNF-α and IL-6) play a critical role in apoptosis, proliferation, angiogenesis, invasion, and metastasis. Their expression is mainly regulated by the nuclear factor kappa-B (NF-KB), a transcription factor, which is constitutively active in most tumors and is induced by carcinogens and chemotherapeutic agents.29
This study aimed to investigate closely the possible intermediary mechanisms that might aggravate hepatocellular carcinogenesis after confounding by DM. We focused on cell life playmakers as apoptosis and inflammation mediators, to uncover the role of apoptosis and inflammation during experimental hepatocarcinogenesis through monitoring levels of apoptotic regulators (i.e. Bcl2 and Bax) and inflammatory mediators (i.e. TNF-α and IL-6) and how they contribute to morbidifying co-existence of both HCC and DM. Liver histological and AFP changes were taken as markers for developing HCC.
Material and MethodsAnimalsForty male albino rats (3 months old) weighing from (145-180 g) were used in this study. They were divided in to equal 4 experimental groups (A-D) (10 rats per group), kept under constant environmental and nutritional conditions for two weeks then placed on a standard 26% casein diet with water ad libitum during the whole period of the experiment. Individual body weights were recorded weekly.
ChemicalsDiethyl nitrosoamine (NDEA), streptozotocin (STZ) were purchased from Sigma Chemical Company, St Louis, MO, USA. All other chemicals and solvents used in the study were of analytical grade and were obtained from Sigma chemical company unless otherwise mentioned.
Experimental design- •
Normal control. Received saline only, by intraperitoneal (IP) route.
- •
Diabetic control. Acute diabetes was produced by a single IP injection of freshly prepared STZ solution, at a dose of 65 mg/kg body weight in 0.05% M citrate buffer, pH 4.5 and given within 10 min of dissolution. DM was ascertained by monitoring blood glucose levels using a standard Randox glucose kit. Blood glucose levels above 200 mg/dL.30
- •
NDEA control. Hepatic carcinogenesis was initiated by a single sub-necrogenic IP dose of DENA, 125 mg/kg body weight in 0.9% normal saline to initiate hepatocarcinogenesis.30
- •
NDEA + STZ. Rats received a single sub-necrogenic IP dose of DENA to initiate hepatocarcinogenesis, then at 3rd week, rats received a single IP dose of STZ to produce acute diabetes.
By the end of the experiment at 14th week, all rats were fasted overnight then killed by exposure to increasing concentration of CO2. Blood samples were obtained by cardiac puncture, left to clot for 1 hour at 37 °C, then centrifuged at 10,000 rpm at 4 °C to separate serum samples and kept at-80 °C for further use. Liver samples were quickly removed, washed thoroughly in ice-cold phosphate buffer solution (PBS) and desiccated. Individual liver weights were accurately recorded. Liver was divided into two portions, one for histological examination,31 the other was frozen in liquid nitrogen and kept at-80 °C for biochemical investigations.
Preparation of hepatic cytosolApproximately 100 mg of livers from each rat were pulverized separately using a pestle and mortar under liquid Nitrogen. The resulting finely ground material from each sample was re-suspended in 1 mL of ice-cold 50 mM Hepes buffer, pH 7.5, containing 150 mM NaCl and 1 mM dithiothreitol. This buffer was fortified with complete EDTA-free protease inhibitor cocktail tablets at a dose of one tablet/10 mL buffer, as recommended by Roche diagnostics Ltd. (Lewes, East Sussex, U.K.). The pulverized hepatic material was placed on ice and homogenized mechanically by three separate 30 second pulses using an Omni homogenizer. The resulting extracts were subjected to two centrifugation steps at 4 °C (15,000 g for 45 min, followed by 100,000 g for 90 min). The final 100,000 g supernatants (cytosols) were collected and retained for biochemical analyses.32
Biochemical analysisBlood glucose levels and serum ALT, AST, GGT activities were measured using Randox kits on a Daytona auto analyzer.
ELISA determinationHigh sensitivity kits were used for determinations. TNF-α was determined using rat ELISA kit from ABCAM, UK and IL-6 was determined using Endogen® rat ELISA kit from Pierce Biotechnology following the instructions of the manufacture. AFP determination,33 using rat AFP kit from USCN life company/China, following the instructions of the manufacturer.
Western blottingAfter determination of individual protein content of in liver samples,34 samples were prepared for loading, amounts of loading buffer and distilled water were calculated depending on the protein concentrations of samples to produce 2 mg/mL sample stock, then the mixture was left in a boiling water bath for 5 min. Bcl2, Bax and GAPDH (Glyceraldehyde 3-phosphate dehydrogenase) primary antibodies and secondary antibodies were obtained from Santa Cruz Technology, Inc, UK. GAPDH was used as a loading control to ensure equal loading and even transfer from the gel to the membrane across the whole gel. Electrophoresis and electroblotting were carried out in a Bio-Rad Mini-Protein II Cell apparatus (Bio-Rad Laboratories, Hemel Hempstead, UK) using a discontinuous buffer system. Aliquots of hepatic samples were routinely examined by SDS-PAGE and stained with Coomassie R250 immediately before immunoblotting to ensure equal loading of samples. Cross-reacting bands were visualized by enhanced chemiluminescence and resulting images were analyzed densitometrically.
Statistical analysisData were expressed as mean ± SD (n = 10 rats). Significant difference between groups was analysed by using GraphPad Prism 5 statistical software.
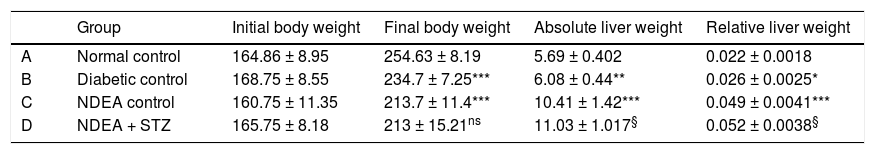
ResultsBiochemical investigationsOur initial observations were related to the general condition of the animals throughout the experiment. Initial body weights were comparable in all groups and ranged between (145-180 g), while final body weights differed significantly among groups. Cancer and/or diabetic groups showed significant decrease (p < 0.05) in their final body weights as compared to normal control combined with significant increase in relative liver weight (absolute liver weight/total body weight) (p < 0.05) compared to normal control (Table 1).
Initial and final body weight, absolute and relative liver weight for all groups.
| Group | Initial body weight | Final body weight | Absolute liver weight | Relative liver weight | |
|---|---|---|---|---|---|
| A | Normal control | 164.86 ± 8.95 | 254.63 ± 8.19 | 5.69 ± 0.402 | 0.022 ± 0.0018 |
| B | Diabetic control | 168.75 ± 8.55 | 234.7 ± 7.25*** | 6.08 ± 0.44** | 0.026 ± 0.0025* |
| C | NDEA control | 160.75 ± 11.35 | 213.7 ± 11.4*** | 10.41 ± 1.42*** | 0.049 ± 0.0041*** |
| D | NDEA + STZ | 165.75 ± 8.18 | 213 ± 15.21ns | 11.03 ± 1.017§ | 0.052 ± 0.0038§ |
Data are expressed as X ± SD of 10 rats in each group (n = 10). Significant difference between groups is analyzed by one-way ANOVA test, where: *** P < 0.001 compared to normal control, § P < 0.001 compared to NDEA control. ns: non significant.
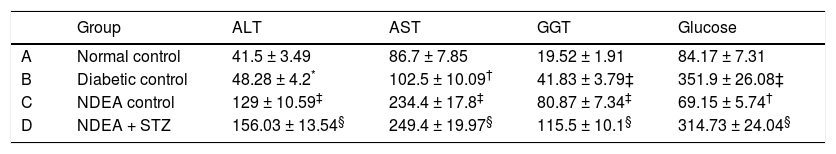
Groups treated with NDEA and or STZ showed significant increase in ALT, AST and GGT activities (P < 0.001) when compared to their corresponding controls, while diabetic groups showed non significant change in ALT activities but significant increase in AST and GGT activities (P < 0.01 and 0.001 respectively) compared to normal control. All STZ treated groups showed significant increase in blood glucose levels (P < 0.001), while NDEA control showed significant hypoglycemia (P < 0.01) as compared to normal control (Table 2).
Serum ALT, AST, GGT activities and blood glucose levels for all groups.
| Group | ALT | AST | GGT | Glucose | |
|---|---|---|---|---|---|
| A | Normal control | 41.5 ± 3.49 | 86.7 ± 7.85 | 19.52 ± 1.91 | 84.17 ± 7.31 |
| B | Diabetic control | 48.28 ± 4.2* | 102.5 ± 10.09† | 41.83 ± 3.79‡ | 351.9 ± 26.08‡ |
| C | NDEA control | 129 ± 10.59‡ | 234.4 ± 17.8‡ | 80.87 ± 7.34‡ | 69.15 ± 5.74† |
| D | NDEA + STZ | 156.03 ± 13.54§ | 249.4 ± 19.97§ | 115.5 ± 10.1§ | 314.73 ± 24.04§ |
Serum levels of AFP were significantly increased in DENA treated groups (P < 0.001) compared to normal control. This effect was more pronounced in NDEA + STZ treated groups, while diabetic control showed no significant change in AFP levels (Figure 1).
. Significant difference between groups is analyzed by one-way ANOVA test, where: * P < 0.001 compared to normal control, ** P < 0.001 compared to NDEA control. ns: non significant.")
Serum levels of TNF-α and IL-6 were significantly increased in groups treated with NDEA alone or combined with STZ (P < 0.001) compared to controls. Diabetic control also showed significant increase (P < 0.001) compared to normal control (Figures 2 and 3).
. Significant difference between groups is analyzed by one-way ANOVA test, where: * P < 0.001 compared to normal control, ** P < 0.001 compared to NDEA control.")
. Significant difference between groups is analyzed by one-way ANOVA test, where: * P < 0.001 compared to normal control, ** P < 0.001 compared to NDEA control.")
Western blotting for anti-apoptotic Bcl2 and pro-apoptotic Bax proteins in the liver of groups treated with NDEA with or without STZ demonstrated significant increase in expression of Bcl2 (P < 0.001). The same effect was also observed in NDEA + STZ treated group, compared to NDEA control, while diabetic control showed significant decrease in Bcl2 expression in the liver (P < 0.001) compared to normal control. On the contrary, Bax showed significant decrease in groups treated with NDEA alone or combined with STZ (P < 0.001) compared to their corresponding controls, while diabetic control showed significant increase (P < 0.001) when compared to normal control (Figures 4 and 5).


Bax/Bcl2 ratio was significantly decreased in groups treated with NDEA with or without STZ (P < 0.001) compared to their corresponding controls.
On the other hand, diabetic control showed significant increase in Bax/Bcl2 ratio (P < 0.001) compared to normal control (Figure 6).
. Significant difference between groups is analyzed by one-way ANOVA test, where: * P < 0.001 compared to normal control, ** P < 0.01 compared to NDEA control.")
Comparative correlation coefficients for all parameters to AFP levels depicted that, TNF-α, IL-6 and Bcl2 were positively correlated (r = 0.9738, 0.9647, 0.9305 respectively) (P < 0.05) while Bax and Bax/Bcl2 ratio were negatively correlated to AFP (r = -0.8897, -0.8632 respectively) (P < 0.05) (Figure 7).
Histological examinations
Normal control had normal hepatic lobular architecture and normal hepatocytes with granulated cytoplasm and small uniform nuclei (Figure 8A). On the other hand, diabetic control showed massive fat accumulation and inflammatory infiltration in the form of mononuclear inflammatory cells (Figure 8B). Groups treated with NDEA and/or STZ showed hydropic degeneration or cloudy swelling, focal areas of necrosis, portal inflammation in the form of infiltration with mononuclear inflammatory cells, bile stasis and proliferation of bile ducts. Hepatocytes showed partial loss of architecture, a tendency to spread by intrahepatic veins, significant hepatic and portal tumor thrombi. Tumor cells are growing in nests and thick cords that are separated from one another by thin walled sinusoids. Cytologically the tumor cells bear some resemblance to normal hepatocytes but they are slightly larger, have more irregular and prominent hyperchromatic nuclei (Figure 8C and 8D). These manifestations were more pronounced in groups treated with NDEA + STZ if compared to groups treated with NDEA alone (Figure 8E and 8F).
 control showed massive fat accumulation and inflammatory infiltration in the form of mononuclear inflammatory cells. C, D. Animals treated with NDEA only. E, F. Animals treated with NDEA+STZ. These sections showed hydropic degeneration or cloudy swelling, focal areas of necrosis, bile stasis and portal inflammation. Tumor cells showed loss of architecture, growing in nests and thick cords that are separated from one another by thin walled sinusoids. Cytologically the tumor cells bear some resemblance to normal hepatocytes but they are slightly larger, have more irregular and prominent hyperchromatic nuclei, These effects were more pronounced in groups treated with both NDEA + STZ if compared to groups treated with NDEA only (hemotoxylin and eosin, X = 200, for all photomicrographs).")
Representative photomicrographs of liver sections from different groups. A. Normal control: showed normal hepatic lobular architecture and normal hepatocytes with granulated cytoplasm and small uniform nuclei. B. Diabetic (STZ) control showed massive fat accumulation and inflammatory infiltration in the form of mononuclear inflammatory cells. C, D. Animals treated with NDEA only. E, F. Animals treated with NDEA+STZ. These sections showed hydropic degeneration or cloudy swelling, focal areas of necrosis, bile stasis and portal inflammation. Tumor cells showed loss of architecture, growing in nests and thick cords that are separated from one another by thin walled sinusoids. Cytologically the tumor cells bear some resemblance to normal hepatocytes but they are slightly larger, have more irregular and prominent hyperchromatic nuclei, These effects were more pronounced in groups treated with both NDEA + STZ if compared to groups treated with NDEA only (hemotoxylin and eosin, X = 200, for all photomicrographs).
HCC and DM have repeatedly been shown to occur together about twice as frequently as would be expected if being alone.1,9,35,36 Because of this frequent association, studying the impact of DM on the incidence and management of HCC is of considerable clinical interest.17,37,38 In this study, animals treated with NDEA alone showed definite histological, elevated AFP levels in serum, as well as, molecular changes which reflected severe hepatocellular damage and poor hepatic function. AFP is always used to assess and follow up HCC diagnostically and prognostically, although some additional markers were recommended to elevate its clinical utility.39
NDEA can cause necrotic damage and force the initiated hepatocytes to enter cell cycle, then when appropriate promoter is applied, hepatocytes undergone clonal expansion and proliferation.40 NDEA undergoes metabolic activation by cytochrome P450 enzymes forming reactive electrophiles which are cytotoxic, mutagenic and carcinogenic. It is transported through blood, induce hepatic damage with subsequent release of hepato-specific enzymes (transaminases) into circulation.41 GGT may be elevated as a response to oxidative stress accumulated during cancer progression, facilitating increased transport of GSH precursors into cells or alternatively as a result of normal cell turnover and cellular stresses possibly through increases in proteolysis, glycosylation, increased GGT synthesis and endothelial cell damage.42-44 Our observations also showed significant induction of Bcl2 expression joined with significant decrease in Bax expression in liver of rats bearing HCC, additionally significant decrease in the overall Bax/Bcl2 ratio in tumor tissues. These data give clue for disrupted apoptotic signals in tumor tissue in favour of anti-apoptotic Bcl2 over the pro-apototic Bax (carcinogenesis). This is thought to be a defence mechanism by which tumor cells can survive.23 A significant number of the molecular events described to be altered in HCC progression are compromising the balance between survival and apoptotic signals in the preneoplastic hepatocytes.45 Many cancer cells, through the up-regulation of Bcl2 gene, resist apoptosis, allowing damaged and mutated cells to survive, and ultimately proliferate. It also prolongs the lifespan of cells, and makes them more likely to develop mutations.46
Our findings also revealed that levels of TNF-α and IL-6 were significantly increased in rats bearing hepatoma which reflects an aggressive inflammatory response correlated with tumor induction. It is believed that inflammation acts as a key regulator in promotion of initiated hepatocytes, possibly by providing them with proliferating signals and by preventing apoptosis.47 Inflammatory responses produce cytokines, which may act as growth and/or angiogenic factors insulting transformed cells to proliferate and undergo promotion.48 Moreover, tumorinfiltrating lymphocytes secrete matrix-degrading proteinases, thereby promoting neoplastic proliferation, angiogenesis, and invasion.49,50 These inflammatory mediators may contribute to HCC progression through a number of mechanisms.27 It is believed that during liver inflammation, hepatocytes are exposed to increased levels of these cytokines, as well as oxidative stress and bile acids.26 Depending on the context and exposure of hepatocytes to TNF-α, it can induce signals that mediate cell death, or alternatively, survival pathways that allow hepatocytes to tolerate tissue damage, so insufficient hepatocyte apoptosis associated with failure to remove mutated cells or with unrestrained proliferation can promote development of liver cancer.25 Hepatic carcinogenesis can also arise from sustained hepatocyte cell death due to the high rate of compensatory regeneration invoked in the tissue, thus elevating the risk of mitotic errors.51 NF-KB is the master regulator of inflammation, it is a natural suspect in providing a mechanistic link between inflammation and apoptosis during carcinogenesis.52-54
Inhibition of apoptosis is perhaps the most obvious way through which NF-KB signals hepatocarcinogenesis as many NF-KB target genes prevent apoptosis (i.e. Bcl2).54,55 During late tumorigenesis, NF-KB activation protects the tumor cells against cell death. Moreover, the tumor cells are provided with essential growth factors due to NF-KB activation in non-parenchymal cells of the liver, such as Kupffer cells.56,57
When diabetes is introduced into the equation most of the observed histological and biochemical abnormalities were amplified. This may be attributed to diabetes related hyperglycaemia which may predispose the liver to relative insulin resistance. The excess free fatty acids found in the insulin-resistant state is directly toxic to hepatocytes via cell membrane disruption, mitochondrial dysfunction, toxin formation and activation or inhibition of key steps in the regulation of metabolism Other potential explanations include oxidant stress from reactive lipid peroxidation, peroxisomal beta-oxidation, and recruited inflammatory cells.58 In this study, groups treated with both NDEA and STZ showed higher levels of transaminases which may be attributed to impaired insulin signalling rather than pure hepatocyte injury.59 In addition, higher GGT activities may be a compensatory mechanism for the preservation of glutathione stores, thus increased GGT activities may be a response to oxidative stress caused by the diabetic state.60 These groups also showed higher levels of circulatory TNF-α and IL-6 and more pronounced inhibition of apoptosis. It is believed that metabolic disturbances associated with diabetes can lead to activation of the polyol pathway, high levels of the cytokines, formation of advanced glycation end-products (AGEs), activation of protein kinase C and enhanced oxidative stress.61,62 The activation of these pathways may be especially important in initiating events linked to inflammation and apoptosis.63-65
ConclusionsThe co-existence of diabetes in the course of hepatocarcinogenesis can dramatically worsen disease status. In this study, diabetes acted as a promoter for HCC, it negatively affected the general condition of the rats, prognosis and out come of the resultant hepatoma. A possible interplay between inflammation and apoptosis may be involved in mediating this promoting effect in this model of NDEA-initiated, STZ-promoted hepatocarcinogenesis. Suggested apoptotic and inflammatory markers (TNF-α, IL-6, Bcl2 and Bax) seem to be beneficial diagnostic tools that may help to improve performance of AFP since they are well correlated with AFP levels.
Conflict of Interest StatementThere are no conflicts of interest.
AcknowledgementThe histological part of the study was executed and interpreted by Prof Manal Ismail Abdel-Ghany, Ph.D., Pathology Department, College of Medicine, Minia University, Egypt. Grateful acknowledgement and appreciation to Dr. Salama Mohammed Rabie, lecturer of Biochemistry, Faculty of Medicine, Minia University for his kind cooperation in biochemical examination.


