


Introduction and Aim. TGF-β signalling is involved in pathogenesis and progress of hepatocellular carcinoma (HCC). This bioinformatics study consequently aims to determine the underlying molecular mechanism of TGF-β activation in HCC cells.
Material and methods. Dataset GSE10393 was downloaded from Gene Expression Omnibus, including 2 Huh-7 (HCC cell line) samples treated by TGF-β (100 pmol/L, 48 h) and 2 untreated samples. Differentially expressed genes (DEGs) were screened using Limma package (false discovery rate < 0.05 and |log2 fold change| > 1.5), and then enrichment analyses of function, pathway, and disease were performed. In addition, protein-protein interaction (PPI) network was constructed based on the PPI data from multiple databases including INACT, MINT, BioGRID, UniProt, BIND, BindingDB, and SPIKE databases. Transcription factor (Tf)-DEG pairs (Bonferroni adjusted p-value < 0.01) from ChEA database and DEG-DEG pairs were used to construct TF-DEG regulatory network. Furthermore, TF-pathway-DEG complex network was constructed by integrating DEG-DEG pairs, TF-DEG pairs, and DEG-pathway pairs.
Results. Totally, 209 DEGs and 30 TFs were identified. The DEGs were significantly enriched in adhesion-related functions. PPI network indicted hub genes such as CUL4Band NEDD4. According to the TF-DEG regulatory network, the two hub genes were targeted by SMAD2, SMAD3, and HNF4A. Besides, the 11 pathways in TF-pathway-DEG network were mainly enriched by UGT1Afamily and CYP3A7, which were predicted to be regulated by SMAD2, SMAD3, SOX2, TP63, and HNF4A.
Conclusions. TGF-β might influence biological processes of HCC cells via SMAD2/SMAD3-NEDD4, HNF4A-CUL4B/NEDD4, SOX2/TP63/HNF4A-CYP3A7, and SMAD2/SMAD3/SOX2/TP63/HNF4A-UGT1As regulatory pathways.
Hepatocellular carcinoma (HCC) is the primary liver cancer that mainly occurs in developing countries.1 The worldwide incidence of HCC ranks the seventh in women (226,000 cases per year, 6.5% of all cancers) and the fifth in men (523,000 cases per year, 7.9% of all cancers).2 HCC is the main form of malignant liver cancer. Due to the high occurrence of invasion to intrahepatic large vessels and stomach, the 5-year survival rate for patients with HCC remains poor after major resection.3
In recent years, many studies have surveyed the pathogenesis of HCC. For example, Wnt signaling pathway which is associated with cell differentiation, proliferation, apoptosis, motility, and homeostasis is aberrantly regulated in HCC.4 Cytokines like transforming growth factor β (TGF-β) play important roles in HCC progression and invasion. Reportedly, TGF-β is a multifunctional factor and plays bipartite roles in HCC:5,6
- •
TGF-β suppresses tumor formation at early stage of liver damage.
- •
TGF-β promotes HCC progression by inducing microenvironment changes.
Moreover, TGF-β stimulation induces epithelial-mesenchymal transitions (EMT) in malignant cancers, promoting cancer cell migration and invasion.7 Hoshida, et al. have found that TGF-β treatment (100 pmol/L, 48 h) enhances Wnt signaling via the intracellular pool of free β-catenin in HCC cell line.8 Besides, transcription factors (TFs) play crucial roles in TGF-β stimulation via regulating gene transcription. For example, the modulation of SMAD family member 7 (SMAD7) expression influences the sensitivity of HCC cell lines (Huh7, FLC-4, HLE and HLF) for cytostatic TGF-β effects, while the knockdown of TF Y-box binding protein-1 (YB-1) reduces TGF-β-induced SMAD7 expression in Huh7 cells.9 Despite these encouraging findings, the mechanism of TGF-β action in HCC cells has not been clearly illustrated.
This bioinformatics study was conducted to comprehensively determine the underlying molecular mechanism of TGF-β activation in HCC cells by using the gene expression profile up-loaded by Hoshida, et al. Consequently, differentially expressed genes (DEGs) between HCC cells with and without TGF-β treatment were identified, DEG functions were investigated, and TF-pathway-DEG complex network was constructed. The results of this study might provide novel directions for further HCC studies and therapeutic targets for HCC treatment.
Material and MethodsMicroarray dataGene expression profile of GSE10393 deposited by Hoshida, et al.8 was downloaded from Gene Expression Omnibus (GEO, http://www.ncbi.nlm.nih.gov/geo/) database. Totally, GSE10393 included 2 Huh-7 (HCC cell line) samples with TGF-β treatment (100 pmol/L, 48 h) and 2 Huh-7 samples without TGF-β treatment. The corresponding platform was GPL3921 [HT_HG-U133A] Affymetrix HT Human Genome U133A Array.
Data preprocessingBased on the R statistical programming language, Bioconductor provides 1024 open software packages for the analysis of high-throughput genomic data. Therefore, microarray data GSE10393 was preprocessed by using Bioconductor package series (version 3.0, available at: http://www.bioconductor.org/packages/3.0/bioc/),10 including affy, simpleaffy, gcrma, and genefilter. In this study, affy package was used to read the raw data of microarray, and simpleaffy package was utilized to detect and control the quality of microarray data. Then, gcrma package was used to adjust the background of different chips, normalize the data in different chips, and transfer the expression values into log2 values. The nsFilter function in genefilter package was utilized to delete the probes with no or little expression value. Moreover, we transformed the expression values at probe level into expression values at gene level based on the annotation files in platform GPL3921.
DEGs screeningLimma package has been widely used to identify the genes which are differentially expressed between two groups. Thus, DEGs between Huh-7 cells with and without TGF-β treatment were identified by using Limma package (version 3.22.7, available at: http://www.bioconductor.org/packages/3.0/bioc/html/limma.html).11 The raw p-value produced in DEGs screening was adjusted into false discovery rate (FDR) by using Benjamini-Hochberg method.12 Then, FDR < 0.05 and |log2 fold change (FC)| > 1.5 were used as the cut-off criteria (Figure 1).
Enrichment analyses
Gene Ontology (GO) terms in GO database and Kyoto Encyclopedia of Genes and Genomes (KEGG) pathways in KEGG database are usually used to describe the biological processes, molecular functions, and subcellular locations of protein.13 Functional enrichment analysis has been widely used to identify the functions that involve the genes in a gene set, while pathway enrichment analysis is generally utilized to find the pathways that include the genes in a gene set. For the identified DEGs, functional and pathway enrichment analyses were performed by using clusterProfiler package (version 2.0.1, available at: http://www.bioconductor.org/packages/3.0/bioc/html/ clusterProfiler.html)14 based on GO and KEGG databases. Besides, Disease Ontology (DO) terms can provide the biomedical community with consistent, reusable and sustainable descriptions of human disease terms, phenotype characteristics, and related medical vocabulary disease concepts.15 Similarly, DO term enrichment analysis was conducted by using DOSE package (version 2.4.0, available at: http://www.bioconductor.org/packages/3.0/ bioc/html/DOSE.html).15 For these analyses, FDR < 0.05 was used as the cut-off criterion.
Protein-protein interaction (PPI) network and its modulesProteins coded by genes often play their biological functions via interacting with other proteins. Thus, PPIs associated with the identified DEGs were extracted from the online databases, including the INDECT project Advanced Image Catalogue Tool (INACT),16 Molecular INTeraction (MINT),17 Biological General Repository for Interaction Datasets (BioGRID),18 Universal Protein (UniProt),19 Biomolecular Interaction Network Database (BIND),20 protein-ligand Binding DataBase (BindingDB)21 and Signaling Pathways Integrated Knowledge Engine (SPIKE)22 databases. Then, PPI network was conducted and visualized by using Cytoscape software (version 3.2.1, available at: http://cytoscape.org/).23 Furthermore, the algorithm GLay24 of clusterMaker plugin25 in Cytoscape was used to screen modules in the PPI network. The nodes in the PPI network and its modules included both DEGs and other non-DEGs that directly interacted with these DEGs.
TF-DEG regulatory network and its modulesChromatin Immunoprecipitation (ChIP) Enrichment Analysis (ChEA) database records huge quantities of information about TFs and their targets based on genome-wide experiments like ChIP-chip, ChIP-sequencing, ChIP coupled with pair-end ditag sequencing analysis (ChIPPET) and DNA adenine methylation identification (Dam-ID).26 In this study, ChEA database was used to search the TFs which could regulate the identified DEGs. Then, TF enrichment analysis was performed, and the raw p-values were adjusted by using Bonferroni method.27 For this analysis, the adjusted p-value < 0.01 was set as the cut-off criterion. Based on TF-DEG pairs found in this analysis and DEG-DEG pairs in PPI network, the TF-DEG regulatory network was constructed. Moreover, modules in the TF-DEG regulatory network were also screened out by using clusterMaker plugin25 in Cytoscape. The nodes in the TF-DEG regulatory network and its modules included only DEGs and TFs.
TF-pathway-DEG complex networkTF-pathway-DEG complex network was constructed by integrating the DEG-DEG pairs from PPI network, TF-DEG pairs from ChEA database, and DEG-pathway pairs from KEGG pathway enrichment analysis. The nodes in the TF-pathway-DEG complex network included TFs, KEGG pathways, and DEGs.
ResultsDEGsA total of 209 DEGs between Huh-7 cells with and without TGF-β treatment were identified, including 109 up-regulated DEGs and 100 down-regulated DEGs.
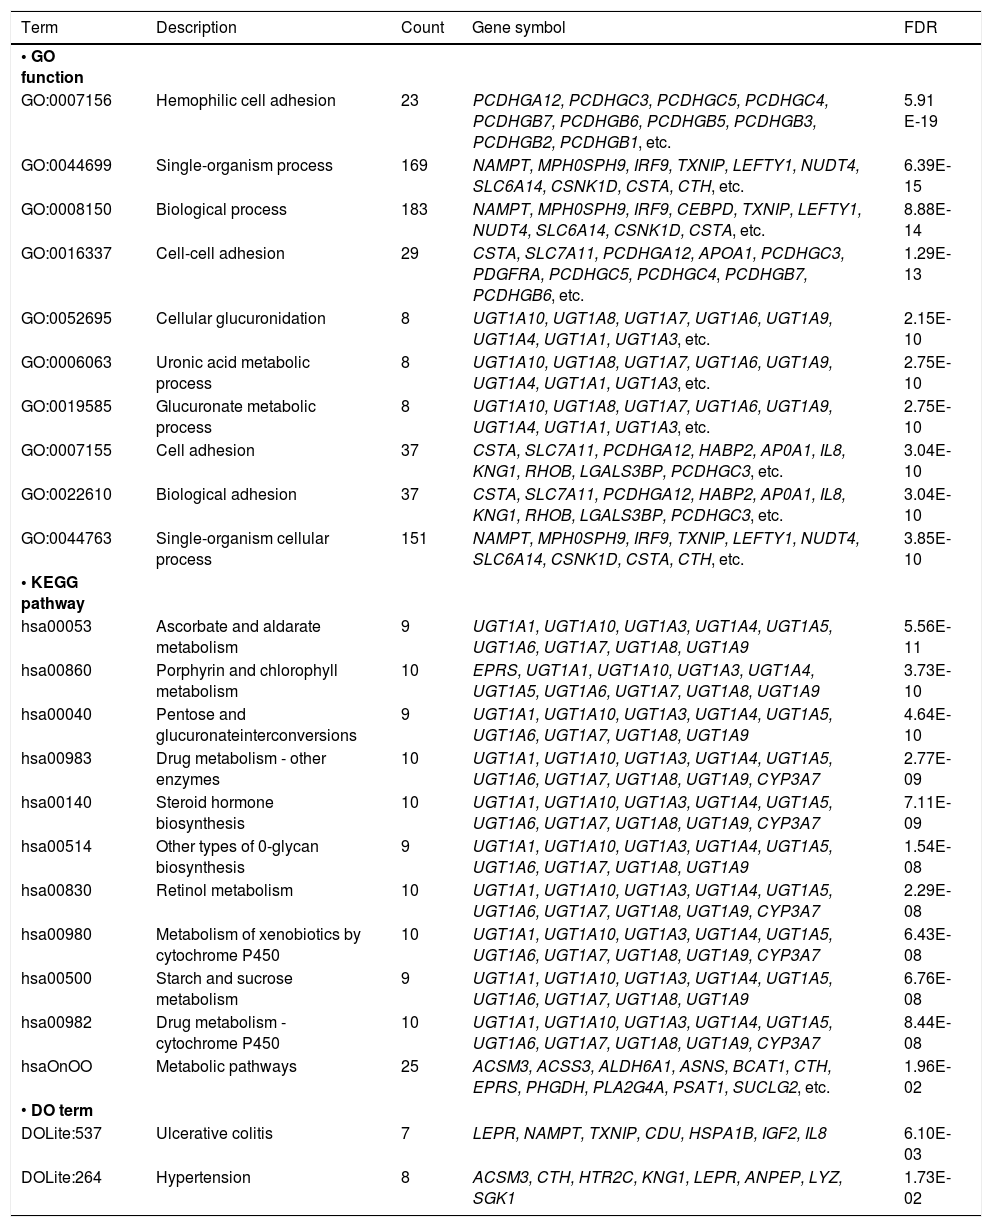
Enrichment analysesTotally, 107 GO functions, 11 KEGG pathways, and 2 DO terms were enriched by the DEGs (Table 1). The top 10 enriched functions were mainly associated with cell adhesion and glucose metabolism, while the 11 enriched pathways were mainly associated with drug, vitamin, and saccharides metabolism.
The GO functions (top 10), KEGG pathways, and DO terms enriched by DEGs.
| Term | Description | Count | Gene symbol | FDR |
|---|---|---|---|---|
| • GO function | ||||
| GO:0007156 | Hemophilic cell adhesion | 23 | PCDHGA12, PCDHGC3, PCDHGC5, PCDHGC4, PCDHGB7, PCDHGB6, PCDHGB5, PCDHGB3, PCDHGB2, PCDHGB1, etc. | 5.91 E-19 |
| GO:0044699 | Single-organism process | 169 | NAMPT, MPH0SPH9, IRF9, TXNIP, LEFTY1, NUDT4, SLC6A14, CSNK1D, CSTA, CTH, etc. | 6.39E-15 |
| GO:0008150 | Biological process | 183 | NAMPT, MPH0SPH9, IRF9, CEBPD, TXNIP, LEFTY1, NUDT4, SLC6A14, CSNK1D, CSTA, etc. | 8.88E-14 |
| GO:0016337 | Cell-cell adhesion | 29 | CSTA, SLC7A11, PCDHGA12, APOA1, PCDHGC3, PDGFRA, PCDHGC5, PCDHGC4, PCDHGB7, PCDHGB6, etc. | 1.29E-13 |
| GO:0052695 | Cellular glucuronidation | 8 | UGT1A10, UGT1A8, UGT1A7, UGT1A6, UGT1A9, UGT1A4, UGT1A1, UGT1A3, etc. | 2.15E-10 |
| GO:0006063 | Uronic acid metabolic process | 8 | UGT1A10, UGT1A8, UGT1A7, UGT1A6, UGT1A9, UGT1A4, UGT1A1, UGT1A3, etc. | 2.75E-10 |
| GO:0019585 | Glucuronate metabolic process | 8 | UGT1A10, UGT1A8, UGT1A7, UGT1A6, UGT1A9, UGT1A4, UGT1A1, UGT1A3, etc. | 2.75E-10 |
| GO:0007155 | Cell adhesion | 37 | CSTA, SLC7A11, PCDHGA12, HABP2, AP0A1, IL8, KNG1, RHOB, LGALS3BP, PCDHGC3, etc. | 3.04E-10 |
| GO:0022610 | Biological adhesion | 37 | CSTA, SLC7A11, PCDHGA12, HABP2, AP0A1, IL8, KNG1, RHOB, LGALS3BP, PCDHGC3, etc. | 3.04E-10 |
| GO:0044763 | Single-organism cellular process | 151 | NAMPT, MPH0SPH9, IRF9, TXNIP, LEFTY1, NUDT4, SLC6A14, CSNK1D, CSTA, CTH, etc. | 3.85E-10 |
| • KEGG pathway | ||||
| hsa00053 | Ascorbate and aldarate metabolism | 9 | UGT1A1, UGT1A10, UGT1A3, UGT1A4, UGT1A5, UGT1A6, UGT1A7, UGT1A8, UGT1A9 | 5.56E-11 |
| hsa00860 | Porphyrin and chlorophyll metabolism | 10 | EPRS, UGT1A1, UGT1A10, UGT1A3, UGT1A4, UGT1A5, UGT1A6, UGT1A7, UGT1A8, UGT1A9 | 3.73E-10 |
| hsa00040 | Pentose and glucuronateinterconversions | 9 | UGT1A1, UGT1A10, UGT1A3, UGT1A4, UGT1A5, UGT1A6, UGT1A7, UGT1A8, UGT1A9 | 4.64E-10 |
| hsa00983 | Drug metabolism - other enzymes | 10 | UGT1A1, UGT1A10, UGT1A3, UGT1A4, UGT1A5, UGT1A6, UGT1A7, UGT1A8, UGT1A9, CYP3A7 | 2.77E-09 |
| hsa00140 | Steroid hormone biosynthesis | 10 | UGT1A1, UGT1A10, UGT1A3, UGT1A4, UGT1A5, UGT1A6, UGT1A7, UGT1A8, UGT1A9, CYP3A7 | 7.11E-09 |
| hsa00514 | Other types of 0-glycan biosynthesis | 9 | UGT1A1, UGT1A10, UGT1A3, UGT1A4, UGT1A5, UGT1A6, UGT1A7, UGT1A8, UGT1A9 | 1.54E-08 |
| hsa00830 | Retinol metabolism | 10 | UGT1A1, UGT1A10, UGT1A3, UGT1A4, UGT1A5, UGT1A6, UGT1A7, UGT1A8, UGT1A9, CYP3A7 | 2.29E-08 |
| hsa00980 | Metabolism of xenobiotics by cytochrome P450 | 10 | UGT1A1, UGT1A10, UGT1A3, UGT1A4, UGT1A5, UGT1A6, UGT1A7, UGT1A8, UGT1A9, CYP3A7 | 6.43E-08 |
| hsa00500 | Starch and sucrose metabolism | 9 | UGT1A1, UGT1A10, UGT1A3, UGT1A4, UGT1A5, UGT1A6, UGT1A7, UGT1A8, UGT1A9 | 6.76E-08 |
| hsa00982 | Drug metabolism - cytochrome P450 | 10 | UGT1A1, UGT1A10, UGT1A3, UGT1A4, UGT1A5, UGT1A6, UGT1A7, UGT1A8, UGT1A9, CYP3A7 | 8.44E-08 |
| hsaOnOO | Metabolic pathways | 25 | ACSM3, ACSS3, ALDH6A1, ASNS, BCAT1, CTH, EPRS, PHGDH, PLA2G4A, PSAT1, SUCLG2, etc. | 1.96E-02 |
| • DO term | ||||
| DOLite:537 | Ulcerative colitis | 7 | LEPR, NAMPT, TXNIP, CDU, HSPA1B, IGF2, IL8 | 6.10E-03 |
| DOLite:264 | Hypertension | 8 | ACSM3, CTH, HTR2C, KNG1, LEPR, ANPEP, LYZ, SGK1 | 1.73E-02 |
GO: gene ontology. KEGG: Kyoto Encyclopedia of Genes and Genomes, DO: disease ontology, DEGs: differentially expressed genes, FDR: false discovery rate, namely, Benjamlnl-Hochberg adjusted p-value.
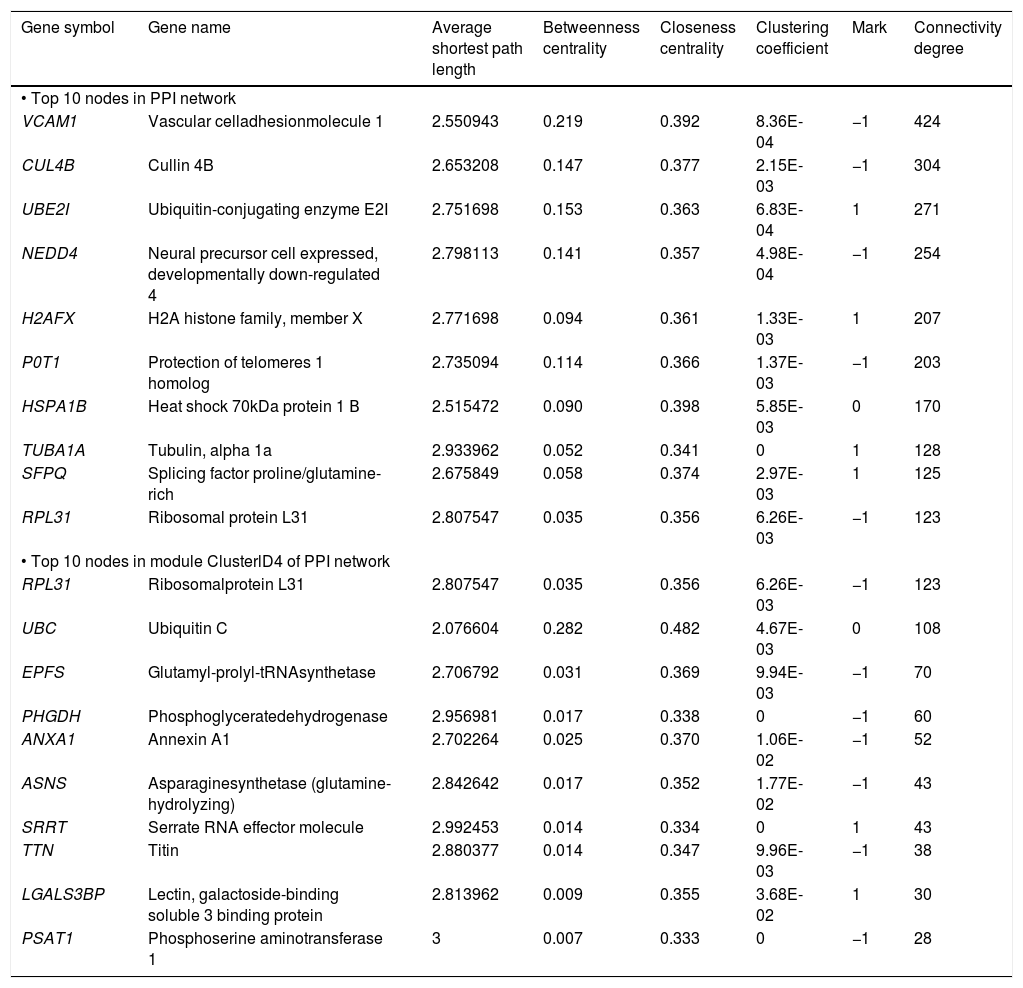
The PPI network included 2,679 nodes and 4,247 interactions, involving 166 DEGs (Figure 2A). In addition, the top 10 nodes with connectivity degree ≥ 120 in PPI network are shown in table 2. Nodes with higher degree and betweenness centrality have closer association with TGF-β activation in HCC. Therefore, the DEGs with high degree and betweenness centrality were defined as hub genes, which might relate to TGF-β stimulation closely. The hub genes included VCAM1 (vascular cell adhesion molecule 1), CUL4B (cullin 4B), UBE2I (ubiquitin-conjugating enzyme E2I), NEDD4 (neural precursor cell expressed, developmentally down-regulated 4), POT1 (protection of telomeres 1 homolog), and so on. Furthermore, a total of 35 modules were obtained from the PPI network, among which the biggest module was ClusterID4 (Figure 2B). Module ClusterID4 consisted of 349 genes (including 58 DEGs) and 561 PPIs. The top 10 nodes in module ClusterID4 are shown in table 2. Hub gene RPL31 (Ribosomal protein L31) in the PPI network was also the most significant hub gene in module ClusterID4.

Protein-protein interaction network and module ClusterlD4 of DEGs. A. Protein-protein interaction network. B. Module ClusterlD4. Red and green circles represent for the up- and down-regulated genes, respectively. Blue circles indicate the genes that interact with DEGs directly. DEGs: differentially expressed genes.
The top 10 nodes with high degree in PPI network and module ClusterlD4.
| Gene symbol | Gene name | Average shortest path length | Betweenness centrality | Closeness centrality | Clustering coefficient | Mark | Connectivity degree |
|---|---|---|---|---|---|---|---|
| • Top 10 nodes in PPI network | |||||||
| VCAM1 | Vascular celladhesionmolecule 1 | 2.550943 | 0.219 | 0.392 | 8.36E-04 | −1 | 424 |
| CUL4B | Cullin 4B | 2.653208 | 0.147 | 0.377 | 2.15E-03 | −1 | 304 |
| UBE2I | Ubiquitin-conjugating enzyme E2I | 2.751698 | 0.153 | 0.363 | 6.83E-04 | 1 | 271 |
| NEDD4 | Neural precursor cell expressed, developmentally down-regulated 4 | 2.798113 | 0.141 | 0.357 | 4.98E-04 | −1 | 254 |
| H2AFX | H2A histone family, member X | 2.771698 | 0.094 | 0.361 | 1.33E-03 | 1 | 207 |
| P0T1 | Protection of telomeres 1 homolog | 2.735094 | 0.114 | 0.366 | 1.37E-03 | −1 | 203 |
| HSPA1B | Heat shock 70kDa protein 1 Β | 2.515472 | 0.090 | 0.398 | 5.85E-03 | 0 | 170 |
| TUBA1A | Tubulin, alpha 1a | 2.933962 | 0.052 | 0.341 | 0 | 1 | 128 |
| SFPQ | Splicing factor proline/glutamine-rich | 2.675849 | 0.058 | 0.374 | 2.97E-03 | 1 | 125 |
| RPL31 | Ribosomal protein L31 | 2.807547 | 0.035 | 0.356 | 6.26E-03 | −1 | 123 |
| • Top 10 nodes in module ClusterlD4 of PPI network | |||||||
| RPL31 | Ribosomalprotein L31 | 2.807547 | 0.035 | 0.356 | 6.26E-03 | −1 | 123 |
| UBC | Ubiquitin C | 2.076604 | 0.282 | 0.482 | 4.67E-03 | 0 | 108 |
| EPFS | Glutamyl-prolyl-tRNAsynthetase | 2.706792 | 0.031 | 0.369 | 9.94E-03 | −1 | 70 |
| PHGDH | Phosphoglyceratedehydrogenase | 2.956981 | 0.017 | 0.338 | 0 | −1 | 60 |
| ANXA1 | Annexin A1 | 2.702264 | 0.025 | 0.370 | 1.06E-02 | −1 | 52 |
| ASNS | Asparaginesynthetase (glutamine-hydrolyzing) | 2.842642 | 0.017 | 0.352 | 1.77E-02 | −1 | 43 |
| SRRT | Serrate RNA effector molecule | 2.992453 | 0.014 | 0.334 | 0 | 1 | 43 |
| TTN | Titin | 2.880377 | 0.014 | 0.347 | 9.96E-03 | −1 | 38 |
| LGALS3BP | Lectin, galactoside-binding soluble 3 binding protein | 2.813962 | 0.009 | 0.355 | 3.68E-02 | 1 | 30 |
| PSAT1 | Phosphoserine aminotransferase 1 | 3 | 0.007 | 0.333 | 0 | −1 | 28 |
In column Mark, -I represents down-regulated DEG, I represents up-regulated DEG, and 0 represents other gene Interacted with DEG directly. DEG: differentially expressed gene. PPI: protein-protein Interaction.
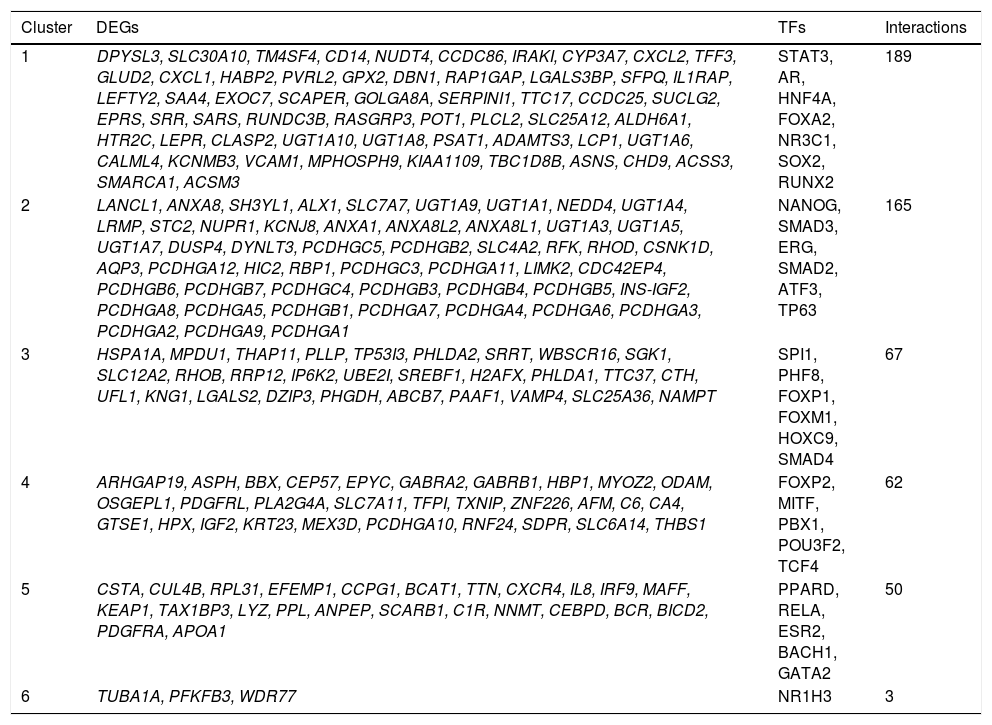
A total of 30 TFs were significantly enriched by DEGs, of which the top 10 TFs are shown in table 3. Based on the DEG-DEG pairs from the PPI network and the TF-DEG pairs, the TF-DEG regulatory network was constructed, involving 226 nodes and 1086 interactions (Figure 3). In this network, the top 5 TFs with high connectivity degree were TP63 (transcription factors tumor protein p63), SOX2 (SRY-box 2), HNF4A (hepatocyte nuclear factor 4 a), SMAD3 (SMAD family member 3), and SMAD2 (SMAD family member 2). These 5 TFs were also the top TFs significantly enriched by DEGs, and thus were defined as hub TFs. Furthermore, a total of 6 modules were extracted from the TF-DEG regulatory network (Table 4). Especially, hub gene NEDD4 was simultaneously targeted by SMAD2 and SMAD3, and hub genes CUL4B and NEDD4 were both targeted by HNF4A.
The top 10 TFs significantly enriched by DEGs.
| TFs | Bonferroni adjusted p-value | Target DEGs | Degree |
|---|---|---|---|
| SMAD2 | 3.27E-21 | ANXA1, ANXA8L2, AQP3, BCAT1, BCR, CCPG1, CEP57, CHD9, GLUD2, H2AFX, etc. | 55 |
| SMAD3 | 3.27E-21 | ANXA1, ANXA8L2, AQP3, BCAT1, BCR, CCPG1, CEP57, CHD9, GLUD2, H2AFX, etc. | 56 |
| S0X2 | 2.86E-17 | ACSM3, AQP3, ASNS, ASPH, BCR, CALML4, CCDC25, CD14, CDC42EP4, CEBPD, etc. | 90 |
| TP63 | 7.21 E-13 | ADAMTS3, ANPEP, ANXA1, ANXA8, ANXA8L1, ANXA8L2, AQP3, BBX, BICD2, C10ORF2, etc. | 91 |
| SMAD4 | 1.92E-12 | ANXA1, ANXA8L2, BCAT1, CDC42EP4, CHD9, LIMK2, PHLDA1, PVRL2, SREBF1, THBS1, etc. | 46 |
| ATF3 | 3.74E-11 | ALDH6A1, ANXA1, ASNS, CSNK1D, CSTA, CTH, DUSP4, DYNLT3, HBP1, LEFTY2, etc. | 42 |
| BAC H1 | 7.57E-11 | BCR, C1R, CCPG1, CEBPD, CSTA, CUL4B, CXCL1, CXCR4, DZIP3, EFEMP1, etc. | 33 |
| F0XA2 | 3.07E-08 | ALDH6A1, ANPEP, AP0A1, BBX, BCR, CCDC86, CD14, CHD9, CXCL2, EX0C7, etc. | 44 |
| RELA | 3.50E-07 | ASPH, BCAT1, CCDC25, CDC42EP4, CEBPD, CXCL1, CXCL2, HSPA1A, IL8, LYZ, etc. | 27 |
| HNF4A | 1.76E-06 | ACSM3, ACSS3, ALDH6A1, ANPEP, AP0A1, AQP3, ASPH, BBX, BCAT1, BCR, CCDC25, etc. | 66 |
Degree means the degree In TF-DEG regulatory network. TF(s): transcription factor(s). DEG(s): differentially expressed gene(s).
: transcription factor(s). DEG: differentially expressed gene.")
DEGs and TFs in the 6 modules of TF-DEG regulatory network.
| Cluster | DEGs | TFs | Interactions |
|---|---|---|---|
| 1 | DPYSL3, SLC30A10, TM4SF4, CD14, NUDT4, CCDC86, IRAKI, CYP3A7, CXCL2, TFF3, GLUD2, CXCL1, HABP2, PVRL2, GPX2, DBN1, RAP1GAP, LGALS3BP, SFPQ, IL1RAP, LEFTY2, SAA4, EXOC7, SCAPER, GOLGA8A, SERPINI1, TTC17, CCDC25, SUCLG2, EPRS, SRR, SARS, RUNDC3B, RASGRP3, POT1, PLCL2, SLC25A12, ALDH6A1, HTR2C, LEPR, CLASP2, UGT1A10, UGT1A8, PSAT1, ADAMTS3, LCP1, UGT1A6, CALML4, KCNMB3, VCAM1, MPHOSPH9, KIAA1109, TBC1D8B, ASNS, CHD9, ACSS3, SMARCA1, ACSM3 | STAT3, AR, HNF4A, FOXA2, NR3C1, SOX2, RUNX2 | 189 |
| 2 | LANCL1, ANXA8, SH3YL1, ALX1, SLC7A7, UGT1A9, UGT1A1, NEDD4, UGT1A4, LRMP, STC2, NUPR1, KCNJ8, ANXA1, ANXA8L2, ANXA8L1, UGT1A3, UGT1A5, UGT1A7, DUSP4, DYNLT3, PCDHGC5, PCDHGB2, SLC4A2, RFK, RHOD, CSNK1D, AQP3, PCDHGA12, HIC2, RBP1, PCDHGC3, PCDHGA11, LIMK2, CDC42EP4, PCDHGB6, PCDHGB7, PCDHGC4, PCDHGB3, PCDHGB4, PCDHGB5, INS-IGF2, PCDHGA8, PCDHGA5, PCDHGB1, PCDHGA7, PCDHGA4, PCDHGA6, PCDHGA3, PCDHGA2, PCDHGA9, PCDHGA1 | NANOG, SMAD3, ERG, SMAD2, ATF3, TP63 | 165 |
| 3 | HSPA1A, MPDU1, THAP11, PLLP, TP53I3, PHLDA2, SRRT, WBSCR16, SGK1, SLC12A2, RHOB, RRP12, IP6K2, UBE2I, SREBF1, H2AFX, PHLDA1, TTC37, CTH, UFL1, KNG1, LGALS2, DZIP3, PHGDH, ABCB7, PAAF1, VAMP4, SLC25A36, NAMPT | SPI1, PHF8, FOXP1, FOXM1, HOXC9, SMAD4 | 67 |
| 4 | ARHGAP19, ASPH, BBX, CEP57, EPYC, GABRA2, GABRB1, HBP1, MYOZ2, ODAM, OSGEPL1, PDGFRL, PLA2G4A, SLC7A11, TFPI, TXNIP, ZNF226, AFM, C6, CA4, GTSE1, HPX, IGF2, KRT23, MEX3D, PCDHGA10, RNF24, SDPR, SLC6A14, THBS1 | FOXP2, MITF, PBX1, POU3F2, TCF4 | 62 |
| 5 | CSTA, CUL4B, RPL31, EFEMP1, CCPG1, BCAT1, TTN, CXCR4, IL8, IRF9, MAFF, KEAP1, TAX1BP3, LYZ, PPL, ANPEP, SCARB1, C1R, NNMT, CEBPD, BCR, BICD2, PDGFRA, APOA1 | PPARD, RELA, ESR2, BACH1, GATA2 | 50 |
| 6 | TUBA1A, PFKFB3, WDR77 | NR1H3 | 3 |
TF(s): transcription factor(s); DEG(s): differentially expressed gene(s)
The complex network of TFs, KEGG pathways, and DEGs was constructed, involving 237 nodes (including 11 pathways, 196 DEGs, and 30 TFs) and 1207 interactions (Figure 4). Especially, the 11 pathways were mainly enriched by down-regulated UGT1A (uridine-5’-diphosphate glucuronosyltransferases subgroup family 1A) family and up-regulated CYP3A7 (cytochrome P450, family 3, subfamily A, member 7), both of which were mainly regulated by TFs SMAD2, SMAD3, SOX2, TP63, and HNF4A.

Complex network of TFs, KEGG pathways, and DEGs. Red and green circles represent for the up- and down-regulated genes, respectively Blue parallelograms indicate TFs. Yellow triangles stand for the KEGG pathways enriched by DEGs. TFs: transcription factors. KEGG: Kyoto Encyclopedia of Genes and Genomes. DEGs: differentially expressed genes.
As the main form of malignant liver cancer, HCC is the primary cause of cancer-related death worldwide.2 In this study, a total of 209 DEGs were identified between the HCC cells treated with and without TGF-β. These DEGs were significantly enriched in cell adhesion-related functions which inhibited tumor invasion and metastasis.28 This is consistent with the invasion-promoting effects of TGF-β on HCC cells.29
Then, the PPI network, TF-DEG regulatory network, and TF-pathway-DEG complex network were constructed. Especially, hub genes CUL4B and NEDD4 in the PPI network were targeted by the significant enriched TFs SMAD2, SMAD3, and HNF4A in the TF-DEG regulatory network. In addition, the 11 pathways in the TF-pathway-DEG complex network were mainly enriched by UGT1A family and CYP3A7, which were mainly regulated by TFs SMAD2, SMAD3, SOX2, TP63, and HNF4A.
NEDD4 is predicted to be targeted by hub TFs SMAD3 and SMAD2, based on the TF-DEG regulatory network. It is reported that abnormal expression of SMAD3 can reduce hepatocarcinogenesis in a murine HCC model,30 and the interaction between SMAD2/ SMAD3/SMAD4 and PKB/Akt modulates TGF-β signalling during EMT.31,32 TGF-β1 mediates cell apoptosis in HCC via interacting with SMADs proteins.33 In addition, NEDD4-2 can negatively regulate TGF-β signalling via inducing ubiquitin-mediated degradation of TGF-β type I receptor and SMAD2.34 In the present study, hub gene NEDD4 was significantly enriched in cellular response to cytokine stimuli and transmembrane transport, and NEDD4 was simultaneously targeted by SMAD2 and SMAD3. Therefore, NEDD4 might play a role in HCC cell response to TGF-β stimulation, and this process is regulated by SMAD2 and SMAD3.
As a regulatory TF targeting hub genes CUL4A and NEDD4, HNF4A also had a high connectivity degree in the TF-DEG regulatory network. HNF4A, a member of the steroid/thyroid nuclear receptor superfamily, is a key regulator of liver metabolism.35 Previous study has found that the overexpression of CUL4A is related to HCC.36 In this study, CUL4A was significantly enriched in cellular response to stimulus and stress. Therefore, CUL4B might contribute to HCC cell response to TGF-β stimulation, and this process is modulated by HNF4A.
In the TF-pathway-DEG complex network, the 11 pathways were enriched by up-regulated DEG CYP3A7, which was mainly regulated by TFs SOX2, TP63, and HNF4A. Reportedly, overexpression of SOX2 is associated with a low survival rate of HCC patients, and it promotes cancer cell invasion.37 TF TP63 is a member of the p53 family,38 which plays crucial roles in cell cycle arrest, apoptosis, and oncogenesis.1,39 In addition, CYP (cytochrome P450) family is closely associated with the pathogenesis of HCC.40 As a member of CYP family, CYP3A4 plays roles in the metabolism of many drugs and the activation of pro-carcinogens in human liver.41 In the present study, CYP3A4 was significantly enriched in cellular response to stimulus and metabolism of drug and xenobiotics. These findings suggested that CYP3A7 might participate in HCC cell response to TGF-β stimulation, and this process is regulated by SOX2, TP63, and HNF4A.
What’s more, all the pathways in the TF-pathway-DEG complex network were enriched by UGT1A family (UGT1As), which was mainly regulated by TFs SMAD2, SMAD3, SOX2, TP63, and HNF4A. UGT1A7 (uridine-5’-diphosphate glucuronosyltransferases subgroup family 1A member 7) genetic polymorphisms (UGT1A7*2 and *3 alleles) are significantly associated with HCC risk and onset age.42 In the present study, UGT1A7 was enriched in response to stimulus and metabolism of drug, vitamin, and saccharides. Therefore, it’s suggested that UGT1A might participate in HCC cell response to TGF-β stimulation, and this process is modulated by SMAD2, SMAD3, SOX2, TP63, and HNF4A.
In conclusion, we conducted a comprehensive bioinformatics analysis on the gene expression changes in HCC cells after TGF-β treatment. It’ proposed that TGF-β might affect biological processes of HCC cells via SMAD2/SMAD3-NEDD4, HNF4A-CUL4B/NEDD4, SOX2/TP63/HNF4A-CYP3A7, and SMAD2/SMAD3/ SOX2/TP63/HNF4A-UGT1AS regulatory pathways. Although further experiments are still needed to validate these hypotheses, the results of this study might provide directions for future researches on HCC invasion and drug design.
AcknowledgementsOur study was supported by Scientific Research Fund of Heilongjiang Provincial Education Department (12531357).
Conflict of InterestsAll authors declare that they have no conflict of interests to state.


