


373 black participants had elevated screening and post-screening serum ferritin (SF) (> 300 |ig/L men; > 200 |ig/L women).
Material and methodsWe retrospectively studied SF and post-screening age; sex; body mass index; transferrin saturation (TS); ALT; AST; GGT; elevated C-reactive protein; p-thalassemia; neutrophils; lymphocytes; monocytes; platelets; metacarpophalangeal joint hypertrophy; hepatomegaly; splenomegaly; diabetes; HFE H63D positivity; iron/alcohol intakes; and blood/ erythrocyte transfusion units. Liver disease was defined as elevated ALT or AST. We computed correlations of SF and TS with: age; body mass index; ALT; AST; GGT; C-reactive protein; blood cell counts; and iron/alcohol. We compared participants with SF > 1,000 and <1,000 |ig/L and performed regressions on SF.
ResultsThere were 237 men (63.5%). Mean age was 55 + 13 (SD) y. 143 participants had liver disease (62 hepatitis B or C). There were significant correlations of SF: TS, ALT, AST, GGT, and monocytes (positive); and SF and TS with platelets (negative). 22 participants with SF > 1,000 |ig/L had significantly higher median TS, ALT, and AST, and prevalences of anemia and transfusion > 10 units; and lower median platelets. Regression on SF revealed significant associations: TS; male sex; age; GGT; transfusion units (positive); and splenomegaly (negative) (p < 0.0001, 0.0016, 0.0281, 0.0025, 0.0001, and 0.0096, respectively). Five men with SF > 1,000 |ig/L and elevated TS had presumed primary iron overload (hemochromatosis). Four participants had transfusion iron overload.
ConclusionPersistent hyperferritinemia in 373 black adults was associated with male sex, age, TS, GGT, and transfusion. 2.4% had primary iron overload (hemochromatosis) or transfusion iron overload.
Mean serum ferritin (SF) of unselected black adults is significantly higher than that of unselected white adults matched for age,1,2 sex,1,2 and HFE genotype.2 In “healthy” subjects selected for absence of hepatitis C or other liver disease, mean SF in black and white adults did not differ significantly.3 Hyperferritinemia is associated with liver disease,4-6 infection, inflammation, malignancy, and other chronic diseases,4 increased apoferritin synthesis and secretion due to chronic alcoholism,7 primary and secondary iron overload disorders,4 and hereditary hyperfer-ritinemia-cataract syndrome.8 These observations suggest that liver disease and other conditions account for hyper-ferritinemia in unselected black adults.
We sought to determine clinical and laboratory associations with persistent hyperferritinemia in 373 adult black participants in the Hemochromatosis and Iron Overload Screening (HEIRS) Study. We selected participants who had both elevated SF and transferrin saturation (TS) levels at initial screening and elevated SF at a post-screening clinical examination (CE). We computed linear correlations of SF and TS at CE with age, body mass index (BMI), serum activities of alanine aminotransferase (ALT), aspartate aminotransferase (AST), and γ-glutamyl transpeptidase (GGT), C-reactive protein (CRP), complete blood count values, and estimated daily intakes of alcohol and iron. We compared characteristics of participants with SF ≤ 1,000 μg/L and SF > 1,000 μg/L at CE using univariate techniques and performed multivaria-ble regressions on SF at CE to determine significant independent variables. We discuss our observations and those of previous reports in the context of hyperferritinemia in black adults.
Material and MethodsParticipants and initial screeningThe National Heart, Lung, and Blood Institute/National Human Genome Research Institute HEIRS Study evaluated the prevalence, genetic, and environmental determinants, and potential clinical, personal, and societal impacts of hemochromatosis and iron overload in a multiethnic, primary care-based sample of 101,168 adults enrolled during the interval 2001-2003 at four Field Centers in the US and one in Canada.9 The Study was conducted in accordance with the principles of the Declaration of Helsinki. Participants, at least 25 y of age and able to give informed consent, were recruited from a health maintenance organization, diagnostic blood collection centers, and public and private primary care offices in ambulatory clinics associated with the Field Centers.9 Initial screening of participants included iron phenotyping and genotyping for the HFE C282Y and H63D alleles.9 Blacks are defined as participants who reported that they were only “black or African American” at Field Centers in the United States, or “Black (African, Haitian, Jamaican, Somal)” at the Ontario Field Center. There were HFE genotype, SF, and TS observations on 26,809 black participants (9,750 men; 17,059 women).2 Ninety-seven percent of blacks were recruited from Field Centers in Washington, D.C. and Birmingham, Alabama.2 At initial screening, SF alone was elevated in 19.2% of blacks and both SF and TS were elevated in 1.5% of blacks.2
Clinical examinationInvitations to participate in a CE were extended to all HFE C282Y homozygotes (regardless of iron phenotype) and all other participants whose initial screening SF and TS exceeded study thresholds (men: SF > 300 μg/L and TS > 50%; women SF > 200 μg/L and TS > 45%), regardless of HFE genotype (Cases).10 The median interval between initial screening and CE participation was 8 months. At the CE, eligible participants were informed of their initial screening TS, SF, and HFE genotype. The CE included a questionnaire addressing medical history and medications completed by the participant, a Multi-Ethnic Dietary Questionnaire, and a focused physical examination performed by a HEIRS Study physician.10 BMI was computed as kg/m2. The present study is limited to observations in black participants who attended CEs as Cases10 and whose SF at the CEs remained elevated.
Participant exclusionsWe excluded 54 Case participants because their SF was not elevated at the CE and 19 others because they reported having post-screening treatment for iron or ferritin abnormalities, they fasted < 8 h before the CE, they were pregnant, or some of their data were missing.
Laboratory methodsAll testing was performed at the HEIRS Study Central Laboratory (Fairview-University Medical Center Clinical Laboratory, University of Minnesota, Fairview, MN, USA). At the CE, a morning blood sample was obtained after an overnight fast ≥ 8 h to confirm HFE genotype,10 to perform complete blood counts (Beckman Coulter GenS, Beckman/Coulter, Fullerton, CA, USA), to measure serum ALT, AST, and GGT, serum CRP, serum glucose (Hitachi 9/11 Analyzer, Roche Applied Science, Madison, WI, USA), serum insulin (DPC Immulite Analyzer, Diagnostic Products, Los Angeles, CA, USA), and SF and TS (Hitachi 9/11 Analyzer, Roche Applied Science, Indianapolis, IN, USA).10 Using control specimens that represented normal ranges of SF, the total coefficient of variation for the Hitachi 9/11 Analyzer was 5.82-6.78%. For higher range SF standards, the total CV was 5.98-8.24%.10
Reflex testing for hepatitis B surface antigen and hepatitis C antibody was performed in participants with elevated ALT (Vitros ECi, Ortho-Clinical Diagnostics Incorporated, USA). Reflex Hb electrophoresis (cellulose acetate, alkaline buffer) was performed in participants with hemoglobin (Hb) levels below the lower reference limits or mean corpuscular volume (MCV) ≤ 77 fL (mi-crocytosis). Hb A2 and Hb F were quantified by high-performance liquid chromatography.
In a HEIRS substudy, DNA specimens of 74 black participants with elevated SF and TS and 75 black participants with normal SF and TS at initial screening were analyzed with denaturing high-performance liquid chromatography to detect HFE, SLC40A1, HAMP, HJV, TFR2, and FTL mutations.11
Reference rangesElevated SF and TS were defined as SF > 300 μg/L and TS > 50% (men); and SF > 200 μg/L and TS > 45% (women). Elevated activities of serum hepatic enzymes were: men ALT ≥ 41 IU/L, AST ≥ 38 IU/L, and GGT ≥ 52 IU/L; and women ALT ≥ 32 IU/L, AST ≥ 32 IU/L, and GGT ≥ 34 IU/L. Reference range for CRP was 0-0.5 mg/ dL. CRP < 0.3 mg/dL was imputed as 0.2 mg/L. CRP > 0.5 mg/dL was defined as elevated. Reference ranges for blood cell analytes included: Hb 13.3-17.7 g/dL (M) and 11.7-15.7 g/dL (F); mean corpuscular volume (MCV) 78-100 fL; neutrophils 1.6-8.3 x 10³/μL; lymphocytes 0.8-5.3 x 10³/μL; monocytes 0-1.3 x 10³/μL; and platelets 150-450 x 103/μL. Anemia was defined as Hb ≤ 13.2 g/dL (M) and ≤ 11.6 g/dL (F). Microcytosis was defined as MCV ≤ 77 fL. Reference ranges for Hb electrophoresis and Hb subtype quantification (as percent of total Hb) include: Hb A1 94.3-98.5%; Hb A2 1.5-3.7%; and Hb F 0-2.0%. Reference ranges for serum glucose and serum insulin were 60-115 mg/dL and 0-20 mIU/L, respectively.
Dietary alcohol and iron intakeAt CE, 308 participants (82.6%) completed the University of Hawaii Multi-Ethnic Dietary Questionnaire which inquires about average eating habits over the past year. The correlation of nutrient intake estimated from this questionnaire with information from 24 h recalls has been vali-dated.12 Questionnaires, analyzed at the University of Hawaii, provided daily estimates of dietary alcohol and iron intake.12
Liver diseaseLiver disease was defined as elevated ALT activity (men ≥ 41 IU/L; women ≥ 32 IU/L) or elevated AST activity (men ≥ 38 IU/L; women ≥ 32 IU/L).3 Participants with liver disease and positivity for hepatitis B surface antigen were defined to have hepatitis B. Participants with liver disease and positivity for hepatitis C virus antibody were defined to have hepatitis C.
DiabetesParticipants were classified by self-reports at initial screening and confirmed at CE by reviews of medications. At CE, we defined undiagnosed diabetes according to the criteria of the American Diabetes Association (blood glucose > 126 mg/dL after fast of ≥ 8 h).13 Participants with self-reported diabetes and undiagnosed diabetes were combined in the present diabetes classification.
Homeostasis model assessment-insulin resistanceInsulin resistance was estimated using homeostasis model assessment-insulin resistance (HOMA-IR ([serum glucose (mg/dL) x serum insulin (mIU/L)] ÷ 405).14 Participants in the fourth HOMA-IR quartile (≥ 2.96) were defined as having insulin resistance (IR).
Metabolic syndromeMetabolic syndrome (MetS) was defined as concurrence of each of these three attributes: BMI ≥ 30 kg/m2; systolic blood pressure ≥ 130 mm Hg or diastolic blood pressure ≥ 85 mm Hg; and fasting serum glucose ≥ 100 mg/dL.15 We grouped positivity for these three attributes as a dichotomous MetS variable.15
Anemia and associated abnormalitiesUndefined microcytic anemia was defined as the combination of anemia, microcytosis, normal Hb A1, Hb A2, and Hb F, and absence of abnormal Hb by electrophoretic criteria. β-thalassemia minor was defined as anemia and microcytosis in participants with Hb A2 > 3.7% and no abnormal Hb, with or without had mild elevation of Hb F.16 Laboratory characteristics of Hb S/β+-thalassemia were: preponderance of Hb S; Hb A 5-30%; and Hb A2 > 3.7%.16 Hb E syndromes were interpreted as previously de-scribed.17
Iron overloadWe defined presumed primary iron overload as persistent elevation of SF > 1,000 μg/L and persistent elevation of TS in the absence of hepatitis B, hepatitis C, anemia, thalassemia, alcohol intake > 30 g/d, and transfusion > 10 units. Participants with a history of more than 10 units of blood/packed erythrocyte transfusion were classified as having hyperferritinemia due to transfusion iron over-load.18
StatisticsThe analytic dataset consisted of observations on 373 participants (83.6% of Cases), except that Dietary Questionnaire data were available in 308 participants. SF and TS data were not normally distributed and thus we used natural log (ln) transformation to normalize SF and TS. Each mean ln-transformed datum was converted to an anti-ln [95% CI] for display. We performed multiple regressions on SF measured at CE using all independent variables. Continuous variables included: age; BMI (or MetS or HOMA-IR, as appropriate); SF; ALT; AST; GGT; CRP; Hb; monocytes, neutrophils, lymphocytes, and platelets; and daily iron and alcohol intake. Dichotomous variables included: sex; diabetes; metacarpophalangeal (MCP) joint hypertrophy; hepatomegaly; splenomegaly; hepatitis B; and hepatitis C; and HFE H63D positivity.
Analyses were performed with SAS (v. 9.1, SAS Institute Inc., Cary, NC, USA), Excel 2000® (Microsoft Corp., Redmond, WA, USA), and GB-Stat® (v. 10.0, Dynamic Microsystems, Inc., Silver Spring, MD, USA). Descriptive data are displayed as enumerations, percentages, mean ± 1 standard deviation, or mean [95% confidence interval]. Means were compared using Student's t-test (two-tailed). Medians were compared with the Mann-Whitney U test. Proportions were compared using Pearson's χ2 test or Fisher's exact test, as appropriate. We computed Pearson's r and value of p for linear correlations. Continuity corrections were applied to 95% confidence intervals of proportions. We defined nominal values of p < 0.05 to be significant. Bonferroni corrections were applied to control the type I error rate at 0.05 for multiple comparisons of continuous and dichoto-mous data, as appropriate.
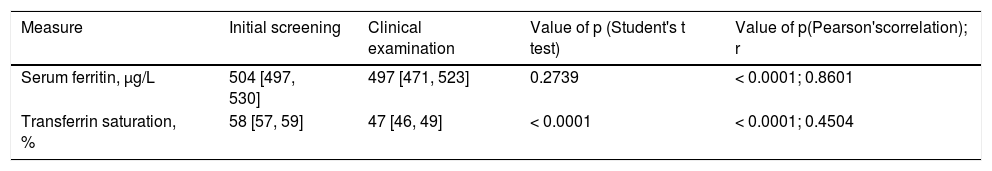
ResultsGeneral characteristics of 373 participantsThere were 237 men (63.5%). Mean age of all CE participants was 55 ± 13 (SD) y. Mean SF at initial screening and CE did not differ significantly (Table 1). Elevated TS was detected in 168 CE participants (45.0%). Mean TS was lower at CE than at initial screening (Table 1).
Iron-related measures in 373 non-Hispanic blacks with hyperferritinemia.*
| Measure | Initial screening | Clinical examination | Value of p (Student's t test) | Value of p(Pearson'scorrelation); r |
|---|---|---|---|---|
| Serum ferritin, μg/L | 504 [497, 530] | 497 [471, 523] | 0.2739 | < 0.0001; 0.8601 |
| Transferrin saturation, % | 58 [57, 59] | 47 [46, 49] | < 0.0001 | < 0.0001; 0.4504 |
Serum ferritin and transferrin saturation values are displayed as mean [95% confidence interval]. r: Pearson's correlation coefficient. Elevated serum ferritin and transferrin saturation were defined as serum ferritin > 300 μg/L and transferrin saturation > 50% (men); and serum ferritin > 200 μg/L and transferrin saturation > 45% (women). By definition, participants had elevated serum ferritin at initial screening and clinical examinations. All participants had elevated trans-ferrin saturation (> 50%) at initial screening. Elevated transferrin saturation was detected in 45.0% of CE participants.
Sixty-four participants (17.2%) had diabetes (44 (11.8%) self-reported, 20 (5.4%) undiagnosed). Mean BMI was 24.7 ± 3.6 kg/m2. Thirteen participants had MetS (3.5%). MCP joint hypertrophy was observed in 14 participants (3.8%). Hepatomegaly was detected in 31 participants (8.3%). Splenomegaly was detected in 14 participants (3.8%). Elevated GGT was detected in 167 participants (44.8%). Thirty participants (8.0%) had thrombocytopenia. Twenty-three participants had anemia (6.2%), of whom 18 (78.3%) had microcytosis.
Liver disease was detected in 143 participants (38.3%). Hepatitis B was detected in 19 participants (5.1%). Hepatitis C was detected in 43 participants (11.5%). The prevalence of hepatomegaly was greater in participants with than without liver disease (14.4% vs. 5.2%; p = 0.0061). The prevalence of splenomegaly was greater in participants with than without liver disease (6.3% vs. 2.2%, respectively; p < 0.0001). The prevalence of elevated GGT was greater in participants with than without liver disease (70.6% vs. 28.7%, respectively; p < 0.0001). The prevalence of thrombocytopenia was greater in participants with than without liver disease (17.5% vs. 2.2%, respectively; p < 0.0001).
Mean estimated daily alcohol intake in 308 participants was 7.3 g [5.2, 9.5]. Twenty-one of 308 participants (6.8%) reported that they consumed ≥ 30 g of ethanol daily. Mean estimated daily iron intake in 308 participants was 13.6 mg [14.5, 15.5]. No participant reported taking supplemental iron. HFE H63D heterozygosity was detected in 45 participants (12.1%). Two participants (0.5%) were H63D ho-mozygotes. HFE C282Y was not detected in any participant.
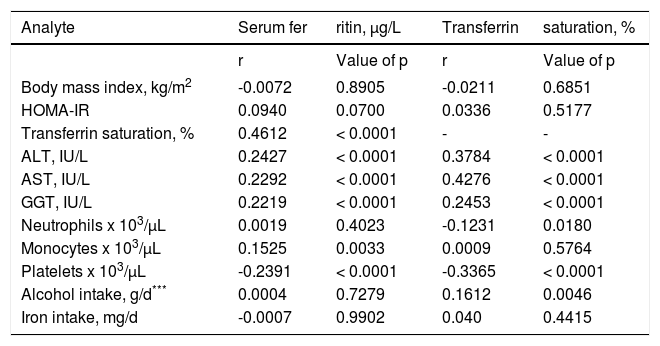
Correlation of serum ferritin with other analytesThere were significant positive correlations of SF with TS, ALT, AST, GGT, and monocytes after Bonferroni correction. There were significant negative correlations of SF and TS with platelets (Table 2). Correlations of SF and TS with BMI, HOMA-IR, neutrophils, monocytes, daily intakes of alcohol and iron, and other analytes were not significant (Table 2).
Correlations of analytes in 373 blacks with hyperferritinemia.*,**,***
| Analyte | Serum fer | ritin, μg/L | Transferrin | saturation, % |
|---|---|---|---|---|
| r | Value of p | r | Value of p | |
| Body mass index, kg/m2 | -0.0072 | 0.8905 | -0.0211 | 0.6851 |
| HOMA-IR | 0.0940 | 0.0700 | 0.0336 | 0.5177 |
| Transferrin saturation, % | 0.4612 | < 0.0001 | - | - |
| ALT, IU/L | 0.2427 | < 0.0001 | 0.3784 | < 0.0001 |
| AST, IU/L | 0.2292 | < 0.0001 | 0.4276 | < 0.0001 |
| GGT, IU/L | 0.2219 | < 0.0001 | 0.2453 | < 0.0001 |
| Neutrophils x 103/μL | 0.0019 | 0.4023 | -0.1231 | 0.0180 |
| Monocytes x 103/μL | 0.1525 | 0.0033 | 0.0009 | 0.5764 |
| Platelets x 103/μL | -0.2391 | < 0.0001 | -0.3365 | < 0.0001 |
| Alcohol intake, g/d*** | 0.0004 | 0.7279 | 0.1612 | 0.0046 |
| Iron intake, mg/d | -0.0007 | 0.9902 | 0.040 | 0.4415 |
These observations are based on serum ferritin and transferrin saturation values measured at clinical examination. These are nominal values of p. Bonferroni correction for 21 comparisons yielded a revised p for significance of < 0.0024.
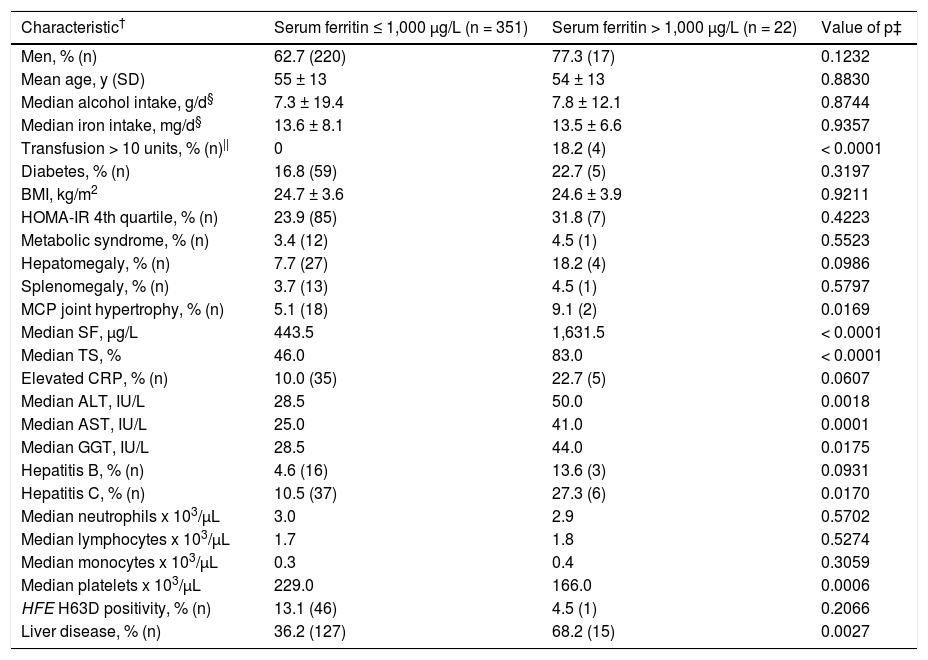
These non-anemia characteristics were significantly greater in participants with SF > 1,000 μg/L after Bonfer-roni correction: median SF (by definition); median TS; median ALT; median AST; and prevalence of anemia (Table 3). Median platelet level was significantly lower in participants with SF > 1,000 μg/L (Table 3).
Characteristics of 373 blacks with hyperferritinemia.*
| Characteristic† | Serum ferritin ≤ 1,000 μg/L (n = 351) | Serum ferritin > 1,000 μg/L (n = 22) | Value of p‡ |
|---|---|---|---|
| Men, % (n) | 62.7 (220) | 77.3 (17) | 0.1232 |
| Mean age, y (SD) | 55 ± 13 | 54 ± 13 | 0.8830 |
| Median alcohol intake, g/d§ | 7.3 ± 19.4 | 7.8 ± 12.1 | 0.8744 |
| Median iron intake, mg/d§ | 13.6 ± 8.1 | 13.5 ± 6.6 | 0.9357 |
| Transfusion > 10 units, % (n)|| | 0 | 18.2 (4) | < 0.0001 |
| Diabetes, % (n) | 16.8 (59) | 22.7 (5) | 0.3197 |
| BMI, kg/m2 | 24.7 ± 3.6 | 24.6 ± 3.9 | 0.9211 |
| HOMA-IR 4th quartile, % (n) | 23.9 (85) | 31.8 (7) | 0.4223 |
| Metabolic syndrome, % (n) | 3.4 (12) | 4.5 (1) | 0.5523 |
| Hepatomegaly, % (n) | 7.7 (27) | 18.2 (4) | 0.0986 |
| Splenomegaly, % (n) | 3.7 (13) | 4.5 (1) | 0.5797 |
| MCP joint hypertrophy, % (n) | 5.1 (18) | 9.1 (2) | 0.0169 |
| Median SF, μg/L | 443.5 | 1,631.5 | < 0.0001 |
| Median TS, % | 46.0 | 83.0 | < 0.0001 |
| Elevated CRP, % (n) | 10.0 (35) | 22.7 (5) | 0.0607 |
| Median ALT, IU/L | 28.5 | 50.0 | 0.0018 |
| Median AST, IU/L | 25.0 | 41.0 | 0.0001 |
| Median GGT, IU/L | 28.5 | 44.0 | 0.0175 |
| Hepatitis B, % (n) | 4.6 (16) | 13.6 (3) | 0.0931 |
| Hepatitis C, % (n) | 10.5 (37) | 27.3 (6) | 0.0170 |
| Median neutrophils x 103/μL | 3.0 | 2.9 | 0.5702 |
| Median lymphocytes x 103/μL | 1.7 | 1.8 | 0.5274 |
| Median monocytes x 103/μL | 0.3 | 0.4 | 0.3059 |
| Median platelets x 103/μL | 229.0 | 166.0 | 0.0006 |
| HFE H63D positivity, % (n) | 13.1 (46) | 4.5 (1) | 0.2066 |
| Liver disease, % (n) | 36.2 (127) | 68.2 (15) | 0.0027 |
By definition, all participants had elevated serum ferritin at initial screening and clinical examination [> 300 fig/L (M); > 200 fig/L (F)]. † Levels are expressed as mean (1 SD) or median (range). Comparisons were made with Student's t test (two-tailed), Mann-Whitney U test, Pearson's x2 test, or Fisher's exact test, as appropriate. ‡ These are nominal values of p. Bonferroni correction for 26 comparisons yielded a revised p for significance of < 0.0019. §Daily dietary iron and alcohol intake estimates were available for 308 participants. || Whole blood or packed erythrocyte units received in lifetime. ALT: alanine aminotransferase. AST: aspartate aminotransferase. BMI: body mass index. CRP: C-reactive protein. GGT: y-glutamyl transpeptidase. HOMA-IR: homeostasis model assessment-insulin resistance. MCP: metacarpophalangeal. SD: standard deviation.
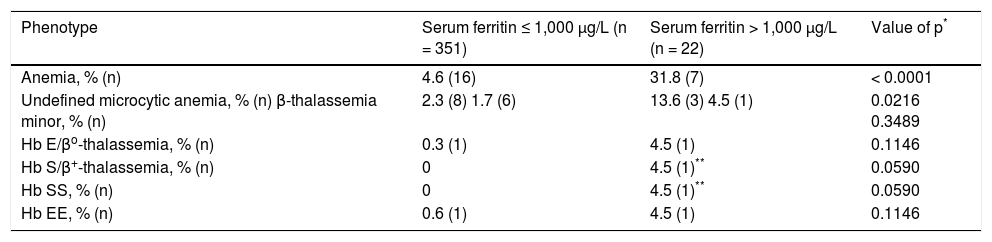
The prevalence of anemia was significantly greater in participants with SF > 1,000 μg/L (Table 4). The prevalence of β-thalassemia phenotypes was greater in participants with SF > 1,000 μg/L (13.6% vs. 2.0%; p = 0.0164). By definition, each participant who had received > 10 units of blood/ packed erythrocyte transfusion had hyperferritinemia due to transfusion iron overload. All participants with transfusion iron overload had SF > 1,000 μg/L (Table 3).
Anemia phenotypes in 373 non-Hispanic African Americans with hyperferritinemia.
| Phenotype | Serum ferritin ≤ 1,000 μg/L (n = 351) | Serum ferritin > 1,000 μg/L (n = 22) | Value of p* |
|---|---|---|---|
| Anemia, % (n) | 4.6 (16) | 31.8 (7) | < 0.0001 |
| Undefined microcytic anemia, % (n) β-thalassemia minor, % (n) | 2.3 (8) 1.7 (6) | 13.6 (3) 4.5 (1) | 0.0216 0.3489 |
| Hb E/βo-thalassemia, % (n) | 0.3 (1) | 4.5 (1) | 0.1146 |
| Hb S/β+-thalassemia, % (n) | 0 | 4.5 (1)** | 0.0590 |
| Hb SS, % (n) | 0 | 4.5 (1)** | 0.0590 |
| Hb EE, % (n) | 0.6 (1) | 4.5 (1) | 0.1146 |
We performed backward stepwise regression on SF using these independent variables: age; sex; BMI; TS; ALT; AST; GGT; elevated CRP; β-thalassemia; neutrophils; lymphocytes; monocytes; platelets; enlarged MCP joints; hepatomegaly; splenomegaly; diabetes; H63D positivity; daily iron intake; daily ethanol intake; and transfusion units. Positive associations included: TS (p < 0.0001); male sex (p = 0.0016); age (p = 0.0281); GGT (p = 0.0025); and transfusion units (p = 0.0001). There was one negative association: splenomegaly (p = 0.0096). This regression explained 52.5% of the variance in SF (ANOVA p of regression < 0.0001).
A regression on SF using liver disease, hepatitis B, or hepatitis C as an independent variable instead of ALT and ALT yielded similar results. Regressions on SF using MetS or IR instead of BMI yielded similar results.
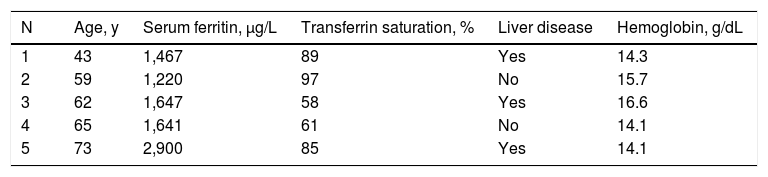
Iron overloadFive men had presumed primary iron overload (hemo-chromatosis) phenotypes (Table 5). The prevalence of presumed primary iron overload in the present 237 men is 0.0211 [0.0078, 0.0513]. The prevalence of presumed primary iron overload in the present 373 participants is 0.0134 [0.0049, 0.0328]. The prevalence of presumed primary iron overload in among 26,809 HEIRS Study black participants is 0.0002 [0.0001, 0.0005]. Four other participants (1.1%) had transfusion iron overload (Table 3).
Characteristics of five black men with presumed primary iron overload.*
| N | Age, y | Serum ferritin, μg/L | Transferrin saturation, % | Liver disease | Hemoglobin, g/dL |
|---|---|---|---|---|---|
| 1 | 43 | 1,467 | 89 | Yes | 14.3 |
| 2 | 59 | 1,220 | 97 | No | 15.7 |
| 3 | 62 | 1,647 | 58 | Yes | 16.6 |
| 4 | 65 | 1,641 | 61 | No | 14.1 |
| 5 | 73 | 2,900 | 85 | Yes | 14.1 |
Presumed primary iron overload was defined as persistent elevation of serum ferritin > 1,000 )ig/L and persistent elevation of transferrin saturation in the absence of hepatitis B, hepatitis C, anemia, thalassemia, alcohol intake > 30 g/d, and transfusion > 10 units. Liver disease was defined as elevated alanine aminotransferase or aspartate aminotransferase. Participant 3 had y-glutamyl transpeptidase 101 IU/mL; the four other men had y-glutamyl transpeptidase < 51 IU/mL. None of these five men had elevated C-reactive protein.
We studied 373 black HEIRS Study participants with elevated SF and TS at initial screening and elevated SF at CE who were otherwise unselected. Sixty-three percent were men and male sex was independently associated with SF after adjustment for other independent variables. In the HEIRS Study screening cohort of 26,809 black participants, mean SF was significantly higher in unselected black men than unselected black women.2 In inner-city African Americans without a history of human immunodeficiency virus infection, SF was higher in men.19
Thirty-eight percent of the present participants were classified as having liver disease. We observed significant positive correlations of SF and TS with ALT, AST, and GGT. Although SF is elevated in patients with many types of liver disease,4,6 GGT, but not ALT, AST, or liver disease, was independently associated with SF in the present multi-variable regressions, after adjustment for other variables.
Hepatitis B and hepatitis C occurred in 5% and 12% of the present participants, respectively, consistent with a previous report of hepatitis B and C in African Ameri-cans.20 In the present study, neither hepatitis B nor hepatitis C was independently associated with SF, after adjustment for other variables. In two studies of persons with hepatitis C, black subjects had higher SF and TS than subjects of other race/ethnicity groups.3,21
The present correlations of SF and TS with GGT were significant and GGT was significantly associated with SF after adjustment for other variables. Serum GGT is a surrogate marker of non-alcoholic fatty liver disease (NAFLD) and its severity.22 In another study, SF was the most significant determinant of GGT in patients with NAFLD23 and SF is related to liver iron storage in NAFLD.24 NAFLD is a common cause of elevated hepatic enzyme levels in persons without previously diagnosed liver disease,25 although evaluation for NAFLD was beyond the scope of the HEIRS Study.
Higher SF is associated with increased risk of diabetes in persons from the general population without hemo-chromatosis or iron overload phenotypes.26,27 It is unknown whether higher SF in persons with diabetes is due to inflammation or increased iron stores.26-28 SF is also higher in persons with MetS and IR.29 In the present study, neither diabetes, MetS, nor IR were associated with higher SF in univariate or multivariable analyses. Exclusion of participants who had SF levels that were not elevated could account for these results.
The positive correlation of SF and blood monocytes in the present study was significant. Ferritin levels in blood leukocytes are highest in monocytes.30In vitro and in vitro observations suggest that ferritin released from monocytes contributes to SF.31
Platelet counts were negatively associated with SF in the present univariate and multivariable analyses. The prevalence of thrombocytopenia was significantly greater in the present participants with than without liver disease. Thrombocytopenia is a common multifactorial abnormality in persons with chronic liver disease, regardless of eti-ology.32
Daily alcohol intake of > 30 g, reported by 7% of the present participants, was positively correlated with TS but not SF. Daily alcohol intake was not independently associated with SF, after adjustment for other variables, consistent with a previous report.7 Chronic alcoholism stimulates ferritin secretion.7 Hyperferritinemia and elevated TS are common and often severe during intervals of heavy alcohol consumption but SF may return to normal during periods of abstinence.33
Estimated daily iron intake did not differ significantly in the present participants with SF ≤ 1,000 μg/L and SF > 1,000 μg/L, and was not significantly associated with SF, after adjustment for other variables. These results are consistent with a previous postulate that higher mean SF in black than white persons in the United States is the result of factors other than iron intake.1
Five men had presumed primary iron overload (hemo-chromatosis) phenotypes as defined herein. Their SF/TS phenotypes are consistent with those of four black participants who underwent therapeutic phlebotomy that removed > 2 g Fe per participant in a post-HEIRS Study program18 and those of black adults with presumed primary iron overload diagnosed in non-screening venues.34,35 In the present study, HFE H63D was not significantly associated with SF or TS. No participant had HFE C282Y. In a HEIRS substudy of 74 high SF/TS black participants and 75 black control participants with normal SF/TS, mutations in HFE, SLC40A1, HAMP, HJV, and TFR2 that could account for high SF/TS phenotypes in black participants were not detected.11
Transfusion iron overload occurred in four participants, each of whom had SF > 1,000 μg/L. Two of these four participants had explanatory thalassemia or hemo-globinopathy phenotypes. Transfused blood/erythrocyte units were significant predictors of SF in univariate and multivariable analyses.
The prevalence of β-thalassemia phenotypes was more than six-fold greater in the present participants with SF > 1,000 μg/L. Erythropoiesis suppresses hepcidin in persons with β-thalassemia trait and Hb E/β-thalassemia and thus increases risk of iron overload.36
The prevalence of undefined microcytic anemia was significantly greater in the present participants with SF > 1,000 μg/L. This category may have included participants with secondary iron overload due to moderate or severe alpha-thalassemia,34 X-linked sideroblastic anemia (ALAS2) genotypes,37 or chronic erythrocyte transfusion associated with acquired disorders.4 Other participants with undefined microcytic anemia may have had chronic kidney disease or other chronic diseases associated with severe hyperferritinemia in the absence of severe iron overload.38
In African Americans, there were significant associations of SF and SNPs near GAB3 on chromosome X.39 In a genome-wide association study, higher SF was associated with rs1867504 in the transferrin gene (TF) in three African cohorts but not in an African-American cohort.40FTL mutations that cause the hereditary hyperferritinemia-cataract syndrome were not detected in 74 black participants with high-iron phenotypes in a HEIRS substudy.11
Clinical conditions in patients with SF ≥ 1,000 μg/L in a university hospital study included liver disease (20.0%), renal disease (17.9%), malignancy (17.9%), human immunodeficiency virus infection (16.8%), other systemic infections (15.8%), chronic transfusions (10.5%), and sickle cell syndromes (10.5%). No condition usually associated with extreme hyperferritinemia was identified in 8.4% of patients, and 16.8% of patients were classified as having more than one condition.
Screening the general population for iron overload was not recommended in the HEIRS Study.41 In countries with a predominance of Caucasian residents such as Ireland and Australia, there is interest in the HFE C282Y mutation as a screening test for hemochromatosis and iron overload. In the case of screening black participants for hemochromato-sis and iron overload in the HEIRS Study, there was no role of C282Y genotyping because C282Y homozygotes are rare in this race/ethnicity group.2 Screening with SF and/or TS can detect blacks with primary iron overload or transfusion iron overload, but persons with conditions such as chronic hepatitis B and C, chronic alcohol use, or steatohepatitis can have similar SF/TS profiles.
There are limitations and uncertainties of the present study. The independent variables we studied did not explain 47% of the variance in SF, suggesting that hyperfer-ritinemia is influenced by heritable or acquired factors not included in our analyses. Evaluating family histories, diagnosing all liver diseases, types of anemia, infections, inflammatory disorders, renal disorders, and malignancies, performing phlebotomy to achieve iron depletion, and analyzing non-HFE genes in all participants were beyond the scope of the HEIRS Study. Some persons with liver disease do not have elevated ALT, AST, or GGT. Elevated ALT, AST, or GGT occur in some persons without diagnoses of liver disease. The contributions of daily alcohol intake > 30 g and daily iron intake to persistent hyperfer-ritinemia in the present cohort are probably small, if any. Participants with mild iron overload may have been excluded by our iron overload definitions. We did not study medications known to cause elevated hepatic enzymes or influence iron absorption.
ConclusionsPersistent hyperferritinemia in 373 black adults was significantly associated with male sex, age, TS, GGT, and transfusion. 2.4% of participants with persistent hyperfer-ritinemia had iron overload.
Abbreviations- •
ALT: alanine aminotransferase.
- •
AST: aspartate aminotransferase.
- •
BMI: body mass index.
- •
CE: clinical examination.
- •
CRP: C-reactive protein.
- •
GGT: γ-glutamyl transpeptidase.
- •
Hb: hemoglobin.
- •
HEIRS Study: Hemochromatosis and Iron Overload Screening Study.
- •
HOMA-IR: homeostasis model assessment-insulin resistance.
- •
MCV: mean corpuscular volume.
- •
MetS: metabolic syndrome.
- •
NAFLD: non-alcoholic fatty liver disease.
- •
SF: serum ferritin.
- •
TS: transferrin saturation.
The authors recognize and appreciate the contributions of all HEIRS Study investigators and participants. A complete list of HEIRS Study investigators and their affiliations is displayed elsewhere.9 The HEIRS Study (January 2000-January 2006) was initiated and funded by the National Heart, Lung, and Blood Institute in conjunction with the National Human Genome Research Institute. The study was supported by contracts N01-HC05185 (University of Minnesota); N01-HC05186, N01-CM-07003-74, and the Minority Community Clinical Oncology Program (Howard University); N01-HC05188 (University of Alabama at Birmingham); N01-C05189 (Kaiser Permanente Center for Health Research); N01-HC05190 (University of California, Irvine); N01-HC05191 (London Health Sciences Centre); and N01-C05192 (Wake Forest University). Additional support was provided by University of Alabama at Birmingham General Clinical Research Center grant M01-RR00032; and Southern Iron Disorders Center.
Author ContributionsJaCB conceived this project, recruited and evaluated study participants, and drafted the manuscript. JClB managed data and performed statistics. PCA recruited and evaluated study participants. Each author contributed to and approved the final version of the manuscript.
Conflict of InterestNo author has a conflict of interest to report.


