


The incidence of liver injury (LI) in hospitalized COVID-19 patients ranged from 14% to 53% based on sole or multiple elevated indexes for LI. The aims of our study were to investigate the changes of parameters (ALT, AST) in LI and determine the risk factors for LI in a cohort of 830 COVID-19 patients.
MethodsDemographic information, clinical features, and laboratory testing outcomes on admission were compared between patients with and without liver biochemistry abnormality (LBA). The same comparisons were performed between the LBA and LI groups. The updated RUCAM was used to determine the causality between drugs application and LI. Univariable and multivariable logistic regression analyses were used to explore the potential risk factors associated with LBA and LI.
ResultsA total of 227 (27.3%) patients exhibited LBA and 32 (3.9%) patients were categorized as having LI based on the diagnostic criteria. 32.6% (74/227) of the LBA patients had RUCAM score >3, whereas the non-LBA patients had a slight lower at rate of 24.2% (146/603) (P?=?0.047). Multivariable regression showed that a higher incidence of LBA was associated with hepatic hypoattenuation on computed tomography (CT) (odds ratio: 2.243, 95% confidence interval: 1.410–3.592, p?=?0.001), lymphocyte proportion <20% (2.088, 1.476–2.954, p?<!--?0.001), C-reactive protein (CRP) -->1?mg/dL (2.650, 1.845–3.806, p?<!--?0.001) and aspartate transaminase to alanine transaminase (AST/ALT) ratio -->1 (2.558, 1.820-3.596, p?<!--?0.001).-->
ConclusionsCRP levels >1.0?mg/dL, lymphocyte proportion <20%, AST/ALT ratio <1, and triglyceride levels >1.7?mol/L are potential risk factors for LI.
Coronavirus disease 2019 (COVID-19), caused by Severe Acute Respiratory Syndrome Coronavirus 2 (SARS-CoV-2), is currently a worldwide global pandemic [1]. On April 30, 2020, there were over 3,000,000 confirmed cases of COVID-19 and over 200,000 deaths according to reports from the World Health Organization (WHO) [2]. SARS-CoV-2 was reported to have symptoms similar to those of Severe Acute Respiratory Syndrome CoV (retrospectively named SARS-CoV-1) and Middle East Respiratory Syndrome coronavirus (MERS-CoV). The syndromes associated with SARS-CoV-2 include mild fever, cough, dyspnea, respiratory failure, and even death. These three coronaviruses employ the same receptor, angiotensin-converting enzyme 2 (ACE2), to attach and enter host cells [3–5]. It was also demonstrated that the spike protein of SARS-CoV-2 can be primed by Transmembrane Serine Protease 2 (TMPRSS2) and that SARS-CoV-2 infection depends not only on host cell factors such as ACE2, but also TMPRSS2 [6]. It is well known that the lung is the main target organ of infection by the novel SARS-CoV-2. However, this coronavirus can also invade multiple systems (immune and nervous systems) and target several organs and tissues (brain, liver, heart, lung, intestine, muscle, kidney, and gastrointestinal tract) [7–11].
The elevation of serum aminotransferases in clinical samples has been observed in some patients with COVID-19 and the liver is one of the most frequently impaired organs besides the lungs [8]. The abnormality index for the liver injury represents increases in alanine aminotransferase (ALT), aspartate aminotransferase (AST), gamma-glutamyl transferase (GGT), and bilirubin, which result in functional impairments in hepatocytes and eventually cause dysfunctions in bile duct cells [12]. A previous case study showed that 37.2% of 148 confirmed COVID-19 patients exhibited abnormal liver function on admission [13]. However, the background and medical histories of the patients and the baseline levels of these indexes for the patients were unclear. Some patients may have chronic hepatitis B virus (HBV) infection and other non-viral chronic liver diseases, such as non-alcoholic fatty liver disease (NAFLD). Lippi et al. [14] argued that the outcome of chronic liver disease was not necessarily related to disease severity or mortality in COVID-19. Given the high transmission rate of SARS-CoV-2 between humans and the uncertain incidence of liver damage and injury, a large population study focused on liver function in COVID-19 patients is important and necessary for better understanding of the pathogenesis in the liver.
In the present study, we retrospectively and systematically investigated the liver function during the early phase of infection and subsequent changes in 830 COVID-19 patients hospitalized at two designated medical health centers (Wuhan, China). We also compared the clinical features on admission, severity, and clinical outcomes for patients with and without liver injury (LI) by testing ALT, AST, and GGT- in those cohorts. The purpose of this study is to explore the risk factors for LI and their association with the clinical outcomes of patients with SARS-CoV-2 infection.
2Methods2.1Ethics declaration and consentThe study was approved by the Medical Ethics Committee of Wuhan Central Hospital, Tongji Medical College, Huazhong University of Science and Technology (No. 202074). Before enrollment in this study, verbal consent was obtained from the patients or an accompanying relative if the patients were unable to provide consent.
2.2Experimental designThe cohort in this study consisted of patients from two designated medical centers affiliated with the Central Hospital of Wuhan, University of Science and Technology (Wuhan, China). These centers were the closest healthcare centers to the area where the first case of COVID-19 was reported. Patients hospitalized from January 1 to March 15, 2020 who were determined to be COVID-19-positive according to the WHO interim guidelines were evaluated. A positive case of COVID-19 was defined based on positive results from a real-time reverse-transcription polymerase chain reaction (RT-PCR) test or specific antibodies against SARS-CoV-2 in the serum. A total of 1046 patients treated up to April 15, 2020 were characterized and assessed. The following patients were excluded: 179 patients with negative COVID-19 results in serial RT-PCR, 13 patients with other pathogen pneumonia unrelated to COVID-19, 19 patients that lacked follow-up clinical records and radiographic data, and five patients with poor quality images of the liver. Therefore, 830 patients with COVID-19 who underwent radiological assessment were eligible for inclusion. Liver biochemistry abnormality (LBA) was defined as ALT, AST, GGT, signifying the liver injury, whereas total bilirubin levels that exceeded the upper limit of the normal value, signifying the liver function. LI was defined as ALT or AST levels at three times the upper limit of the normal values. LI was also defined as total bilirubin levels that exceeded twice the upper limit of the normal value, in accordance with expert consensus from the Chinese Society of Hepatology, Chinese Medical Association [15]. The updated Roussel Uclaf Causality Assessment Method (RUCAM) was used to determine the causality between drugs application and liver injury. The final scores correspond to the following causality levels: =0 points, excluded causality; 1–2, unlikely; 3–5, possible; 6–8, probable; and =9, highly probable [16].
2.3Data collectionThe medical history, laboratory tests, and computed tomography (CT) data for all patients were collected from the institutional digital medical records database. The data for all patients included the basic features of patients (age, gender), main symptoms (fever, cough, diarrhea, anorexia, weakness), and comorbidities (hypertension, diabetes, hyperlipidemia, cardiac or cerebrovascular disease, malignancy, chronic kidney disease, chronic pulmonary disease, surgery, liver fibrosis/cirrhosis, and HBV). Lymphocyte count, lymphocyte proportion, C-reactive protein (CRP), d-dimer, albumin, ALT, AST, AST/ALT ratio, GGT, total bilirubin, triglyceride, and cholesterol test results on hospital admission were also recorded. Confirmed clinical cases were classified based on the final diagnosis upon discharge using the Chinese Guidelines for COVID-19 (Trial version 7.0) [17]. Other related clinical diagnostic criteria were in accordance with the preliminary diagnosis and treatment protocols from the National Health Commission of the People’s Republic of China (Trial version 7.0). To assess hepatic attenuation in patients, 3-mm sections on chest CT images of the livers of the patients were independently reviewed by two trained radiologists who had no access to other parameters. Visual assessment of steatosis in the right hepatic lobe was determined with a ?ve-point scale described in a previous study by Lee et al. [18]. Liver attenuation in a 300-mm2 rectangular area in the right lobe was examined (Fig. 1). Disagreements between the two reviewers were resolved by a third reviewer with proper consultation.
 a section of the liver shows hypoattenuation (mean attenuation: 34.4 HU) in the liver parenchyma on initial chest CT scan (obtained on day 4 after the onset of symptoms); (B) a section of the liver shows an increase in liver attenuation (mean attenuation: 48.8 HU) on the second chest CT (day 10 after the onset of symptoms); (C) a section of the liver shows continued recovery in liver attenuation (mean attenuation: 54.0 HU) on the third chest CT scan (day 15 after the onset of symptoms); (D) initial chest CT scan shows multifocal patchy ground-glass opacities (GGO) in two lungs; (E) the second chest CT image shows dissipation of GGO in the left lower lobe and a mild enlargement of GGO in the right lower lobe; (F) the third chest CT image shows demonstrative absorption.")
A 39-year-old man with COVID-19 pneumonia. Changes in liver attenuation on serial chest CT examinations. (A) a section of the liver shows hypoattenuation (mean attenuation: 34.4 HU) in the liver parenchyma on initial chest CT scan (obtained on day 4 after the onset of symptoms); (B) a section of the liver shows an increase in liver attenuation (mean attenuation: 48.8 HU) on the second chest CT (day 10 after the onset of symptoms); (C) a section of the liver shows continued recovery in liver attenuation (mean attenuation: 54.0 HU) on the third chest CT scan (day 15 after the onset of symptoms); (D) initial chest CT scan shows multifocal patchy ground-glass opacities (GGO) in two lungs; (E) the second chest CT image shows dissipation of GGO in the left lower lobe and a mild enlargement of GGO in the right lower lobe; (F) the third chest CT image shows demonstrative absorption.
Continuous variables were expressed as the median with the interquartile range (IQR) and compared using the Kruskal–Wallis and Mann–Whitney U tests where appropriate. Categorical variables were presented as frequency (%), and proportions in categorical variables were compared using the ?2 test or Fisher’s exact test. Univariable and multivariable logistic regression models were used to explore the risk factors associated with LBA and LI. Since lymphocyte proportion, lymphocyte count, and CRP levels can contribute to systemic inflammation, multivariable analysis was used for the calculation of lymphocyte proportion. Receiver operating characteristic (ROC) analysis was used to determine the predictive values of LBA and LI. A two-sided a of less than 0.05 was considered statistically significant. Statistical analyses were performed using SPSS v. 25.0 (IBM, Armonk, NY) and MedCalc v. 17.6 (MedCalc Software BVBA; https://www.medcalc.org).
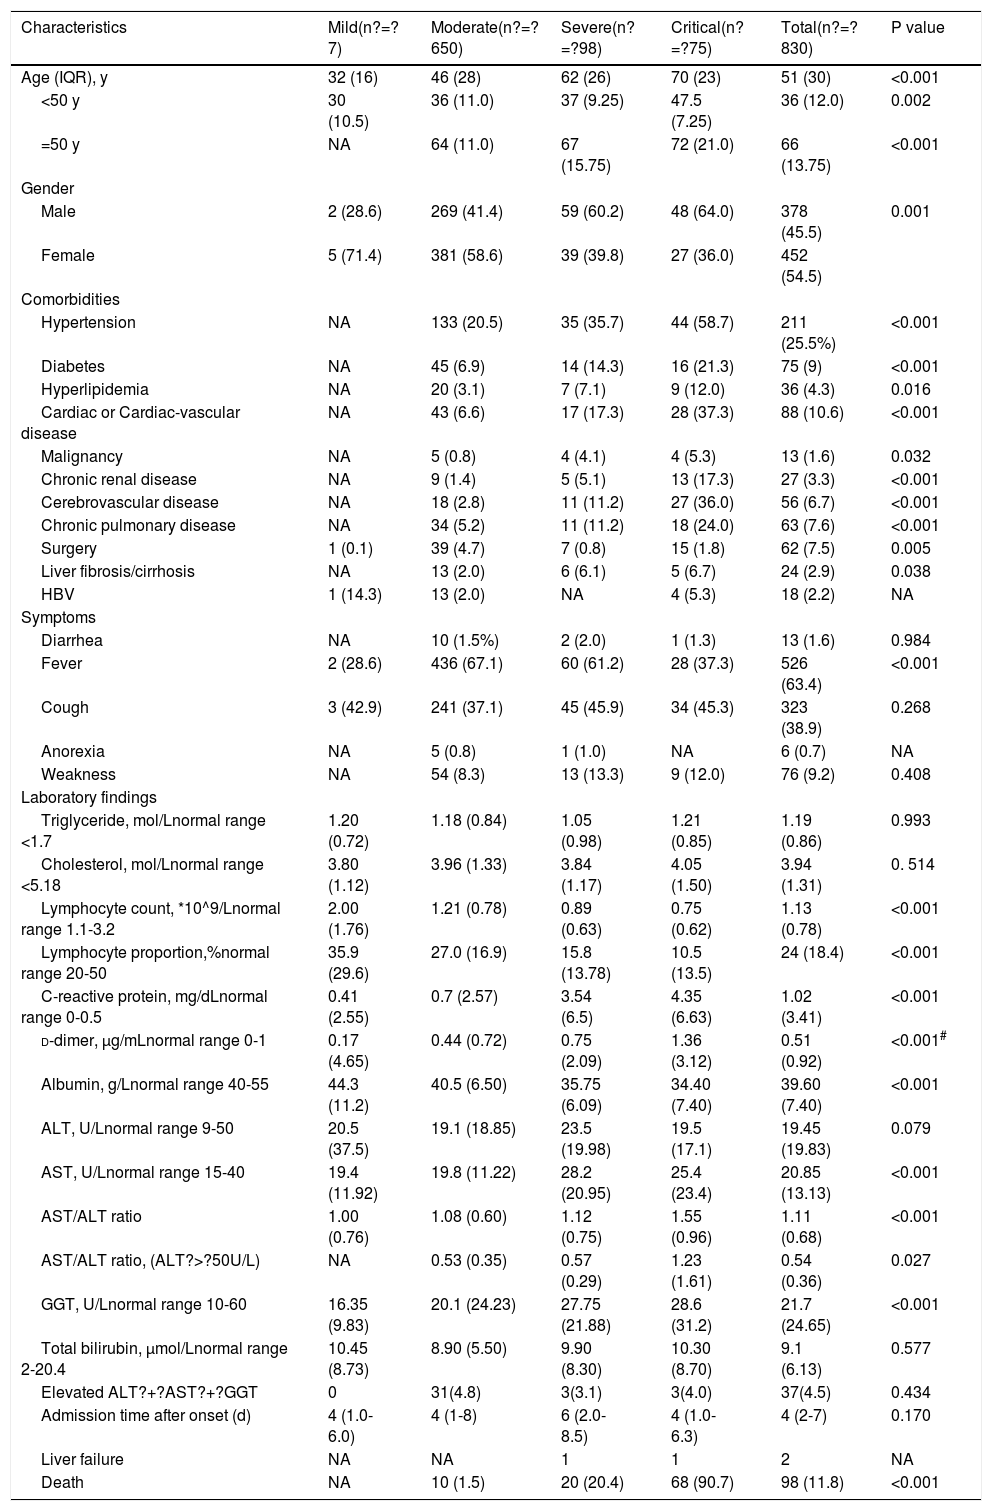
3Results3.1Demographic and clinical characteristicsAs shown in Table 1, among 830 COVID-19 patients, the median ages of severe and critical patients were 62 and 70 years old, respectively, and over 60% of the patients were men. By March 15, 2020, 1043 patients had been discharged from the designated medical centers after they had fully recovered and met the clinical criteria for COVID-19 recovery. By April 10, 2020, 196 patients were either still hospitalized or the tests for SARS-CoV-2 nucleic acids or serum-specific antibodies for SARS-CoV-2 were not confirmed yet or were negative. Key information was missing in the medical records of 17 inpatients. Therefore, the data for 830 inpatients were included in the final analysis in this study. Notably, two patients eventually developed sub-acute liver failure while they were hospitalized; one of patients was an 84-year-old woman with pancreatic ampullary carcinoma and the other was a 36-year-old man with cholangiocarcinoma. Both patients accepted endoscopic retrograde biliary drainage to improve jaundice while undergoing treatment. Out of the entire cohort, 98 (11.8%) patients died during hospitalization and 732 were discharged. The median age was 51 years old and 422 (50.8%) patients were over 50 years old. Two common gastrointestinal symptoms observed in the patients were diarrhea (1.6%) and anorexia (0.7%), with no significant differences among four groups of patients categorized according to disease severity (mild, moderate, severe, and critical). Clinically, hypertension, cardiac or cerebrovascular disease, and diabetes were the three most frequently observed chronic diseases. Twenty-four patients who had liver fibrosis/cirrhosis associated with conditions including chronic HBV, schistosome, NAFLD, and excessive alcohol intake. Eighteen patients were HBV-positive. The data suggested that there were significant differences in gender, age, fever, and comorbidities between the severely group and mild group (p? d-dimer values was also observed in severe and critically ill patients than in patients with standard symptoms.
Clinical characteristics of 830 patients with COVID-19.
| Characteristics | Mild(n?=?7) | Moderate(n?=?650) | Severe(n?=?98) | Critical(n?=?75) | Total(n?=?830) | P value |
|---|---|---|---|---|---|---|
| Age (IQR), y | 32 (16) | 46 (28) | 62 (26) | 70 (23) | 51 (30) | <0.001 |
| <50 y | 30 (10.5) | 36 (11.0) | 37 (9.25) | 47.5 (7.25) | 36 (12.0) | 0.002 |
| =50 y | NA | 64 (11.0) | 67 (15.75) | 72 (21.0) | 66 (13.75) | <0.001 |
| Gender | ||||||
| Male | 2 (28.6) | 269 (41.4) | 59 (60.2) | 48 (64.0) | 378 (45.5) | 0.001 |
| Female | 5 (71.4) | 381 (58.6) | 39 (39.8) | 27 (36.0) | 452 (54.5) | |
| Comorbidities | ||||||
| Hypertension | NA | 133 (20.5) | 35 (35.7) | 44 (58.7) | 211 (25.5%) | <0.001 |
| Diabetes | NA | 45 (6.9) | 14 (14.3) | 16 (21.3) | 75 (9) | <0.001 |
| Hyperlipidemia | NA | 20 (3.1) | 7 (7.1) | 9 (12.0) | 36 (4.3) | 0.016 |
| Cardiac or Cardiac-vascular disease | NA | 43 (6.6) | 17 (17.3) | 28 (37.3) | 88 (10.6) | <0.001 |
| Malignancy | NA | 5 (0.8) | 4 (4.1) | 4 (5.3) | 13 (1.6) | 0.032 |
| Chronic renal disease | NA | 9 (1.4) | 5 (5.1) | 13 (17.3) | 27 (3.3) | <0.001 |
| Cerebrovascular disease | NA | 18 (2.8) | 11 (11.2) | 27 (36.0) | 56 (6.7) | <0.001 |
| Chronic pulmonary disease | NA | 34 (5.2) | 11 (11.2) | 18 (24.0) | 63 (7.6) | <0.001 |
| Surgery | 1 (0.1) | 39 (4.7) | 7 (0.8) | 15 (1.8) | 62 (7.5) | 0.005 |
| Liver fibrosis/cirrhosis | NA | 13 (2.0) | 6 (6.1) | 5 (6.7) | 24 (2.9) | 0.038 |
| HBV | 1 (14.3) | 13 (2.0) | NA | 4 (5.3) | 18 (2.2) | NA |
| Symptoms | ||||||
| Diarrhea | NA | 10 (1.5%) | 2 (2.0) | 1 (1.3) | 13 (1.6) | 0.984 |
| Fever | 2 (28.6) | 436 (67.1) | 60 (61.2) | 28 (37.3) | 526 (63.4) | <0.001 |
| Cough | 3 (42.9) | 241 (37.1) | 45 (45.9) | 34 (45.3) | 323 (38.9) | 0.268 |
| Anorexia | NA | 5 (0.8) | 1 (1.0) | NA | 6 (0.7) | NA |
| Weakness | NA | 54 (8.3) | 13 (13.3) | 9 (12.0) | 76 (9.2) | 0.408 |
| Laboratory findings | ||||||
| Triglyceride, mol/Lnormal range <1.7 | 1.20 (0.72) | 1.18 (0.84) | 1.05 (0.98) | 1.21 (0.85) | 1.19 (0.86) | 0.993 |
| Cholesterol, mol/Lnormal range <5.18 | 3.80 (1.12) | 3.96 (1.33) | 3.84 (1.17) | 4.05 (1.50) | 3.94 (1.31) | 0. 514 |
| Lymphocyte count, *10^9/Lnormal range 1.1-3.2 | 2.00 (1.76) | 1.21 (0.78) | 0.89 (0.63) | 0.75 (0.62) | 1.13 (0.78) | <0.001 |
| Lymphocyte proportion,%normal range 20-50 | 35.9 (29.6) | 27.0 (16.9) | 15.8 (13.78) | 10.5 (13.5) | 24 (18.4) | <0.001 |
| C-reactive protein, mg/dLnormal range 0-0.5 | 0.41 (2.55) | 0.7 (2.57) | 3.54 (6.5) | 4.35 (6.63) | 1.02 (3.41) | <0.001 |
| d-dimer, µg/mLnormal range 0-1 | 0.17 (4.65) | 0.44 (0.72) | 0.75 (2.09) | 1.36 (3.12) | 0.51 (0.92) | <0.001# |
| Albumin, g/Lnormal range 40-55 | 44.3 (11.2) | 40.5 (6.50) | 35.75 (6.09) | 34.40 (7.40) | 39.60 (7.40) | <0.001 |
| ALT, U/Lnormal range 9-50 | 20.5 (37.5) | 19.1 (18.85) | 23.5 (19.98) | 19.5 (17.1) | 19.45 (19.83) | 0.079 |
| AST, U/Lnormal range 15-40 | 19.4 (11.92) | 19.8 (11.22) | 28.2 (20.95) | 25.4 (23.4) | 20.85 (13.13) | <0.001 |
| AST/ALT ratio | 1.00 (0.76) | 1.08 (0.60) | 1.12 (0.75) | 1.55 (0.96) | 1.11 (0.68) | <0.001 |
| AST/ALT ratio, (ALT?>?50U/L) | NA | 0.53 (0.35) | 0.57 (0.29) | 1.23 (1.61) | 0.54 (0.36) | 0.027 |
| GGT, U/Lnormal range 10-60 | 16.35 (9.83) | 20.1 (24.23) | 27.75 (21.88) | 28.6 (31.2) | 21.7 (24.65) | <0.001 |
| Total bilirubin, µmol/Lnormal range 2-20.4 | 10.45 (8.73) | 8.90 (5.50) | 9.90 (8.30) | 10.30 (8.70) | 9.1 (6.13) | 0.577 |
| Elevated ALT?+?AST?+?GGT | 0 | 31(4.8) | 3(3.1) | 3(4.0) | 37(4.5) | 0.434 |
| Admission time after onset (d) | 4 (1.0-6.0) | 4 (1-8) | 6 (2.0-8.5) | 4 (1.0-6.3) | 4 (2-7) | 0.170 |
| Liver failure | NA | NA | 1 | 1 | 2 | NA |
| Death | NA | 10 (1.5) | 20 (20.4) | 68 (90.7) | 98 (11.8) | <0.001 |
Continuous data are expressed as median (IQR) and categorical data as number (%).
ALT, alanine aminotransferase; AST, aspartate aminotransferase; GGT, Gamma Glutamyltransferase; HBV, hepatitis B virus.
#Data for 804 patients.
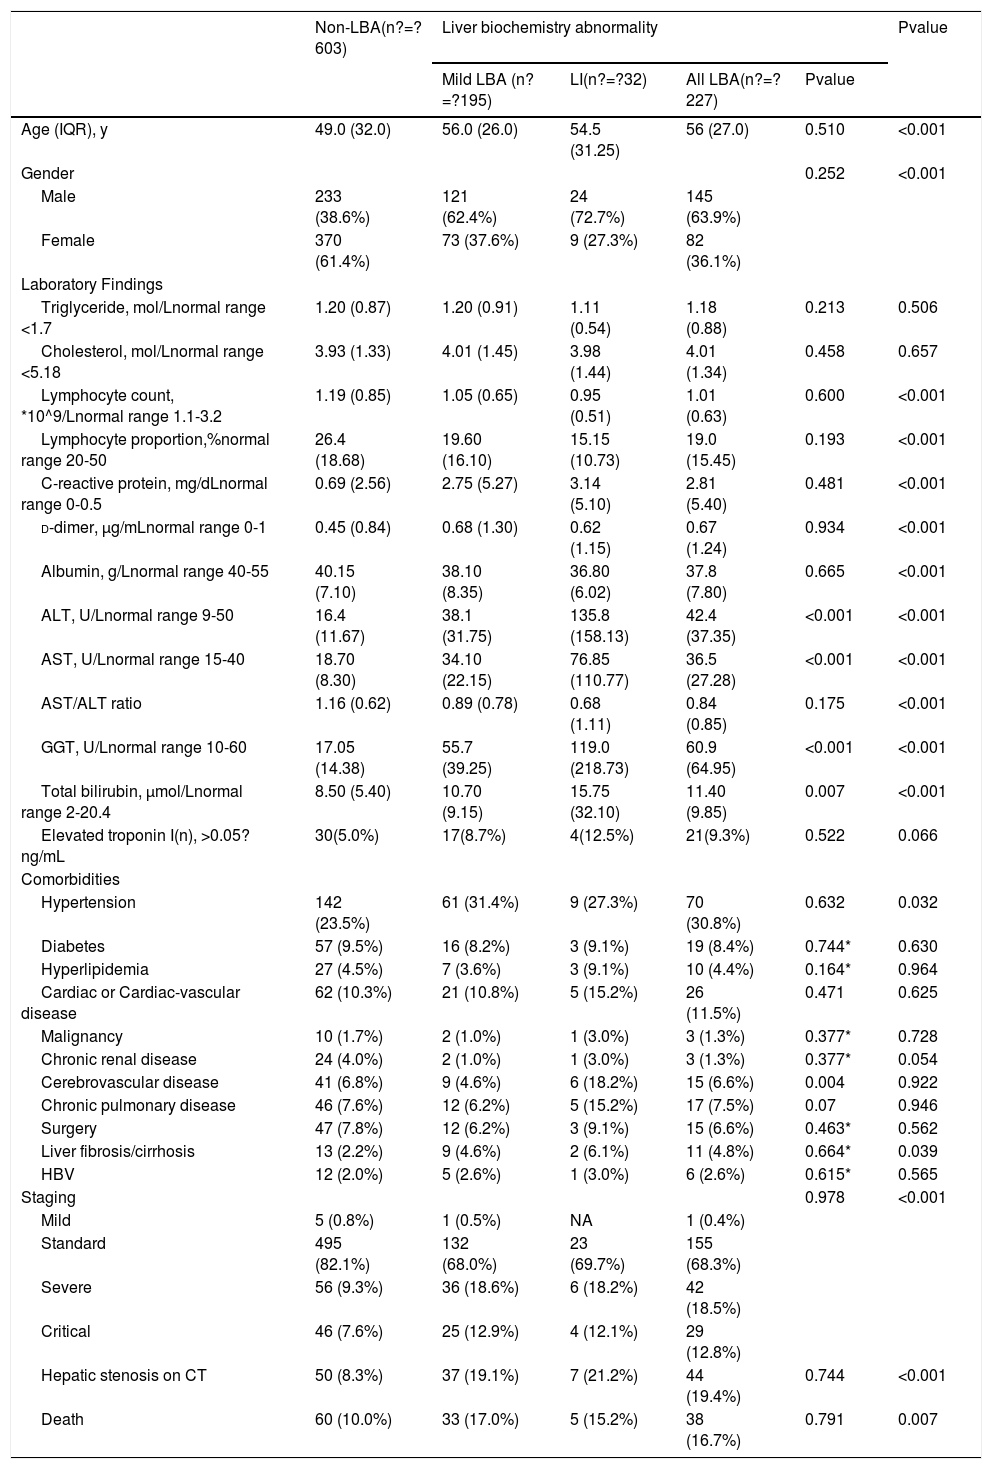
As shown in Table 2, 227 out of 830 patients (27.3%) had different degrees of liver dysfunction on admission, specifically, mild LBA (n?=?195) and hepatic impairment (n?=?32). Among these patients, 63.9% were men. Among 227 patients, 41.9% (95/227), 48.5% (110/227), 50.7% (115/227) and 21.1% (48/227) were abnormal in serum ALT, AST, GGT, and total bilirubin, respectively. Approximately 16.3% (37/227) of the patients showed an abnormal increase in all three serum liver enzymes tested (ALT, AST, GGT). The median AST/ALT ratios, which showed a gradual decline in the groups according to the degree of liver dysfunction, were 1.16, 0.89, and 0.68 in the non-LBA, mild LBA, and LI subgroups, respectively. Compared with the non-LBA subgroup, the LBA subgroup showed lower levels of CRP, d-dimer, and aminotransferases. Moreover, the lymphocyte count and lymphocyte proportion were significantly lower in the LBA subgroup. No clear statistical difference was found between the mild LBA and LI subgroups as well. No significant differences were observed between the mild LBA and LI subgroups in terms of chronic comorbidities such as hypertension, diabetes, cardiac disease, chronic renal disease, malignancy, chronic HBV, and liver fibrosis/cirrhosis. Abnormalities in AST, GGT, and albumin were more frequently observed in severely ill patients than in non-severe patients; however, this difference was not apparent in ALT and total bilirubin. 32.6% (74/227) of the LBA patients had the updated RUCAM score >3, whereas the non-LBA patients had a slight lower at a rate of 24.2% (146/603) (P?=?0.047).
Findings for patients with COVID-19 and liver impairment.
| Non-LBA(n?=?603) | Liver biochemistry abnormality | Pvalue | ||||
|---|---|---|---|---|---|---|
| Mild LBA (n?=?195) | LI(n?=?32) | All LBA(n?=?227) | Pvalue | |||
| Age (IQR), y | 49.0 (32.0) | 56.0 (26.0) | 54.5 (31.25) | 56 (27.0) | 0.510 | <0.001 |
| Gender | 0.252 | <0.001 | ||||
| Male | 233 (38.6%) | 121 (62.4%) | 24 (72.7%) | 145 (63.9%) | ||
| Female | 370 (61.4%) | 73 (37.6%) | 9 (27.3%) | 82 (36.1%) | ||
| Laboratory Findings | ||||||
| Triglyceride, mol/Lnormal range <1.7 | 1.20 (0.87) | 1.20 (0.91) | 1.11 (0.54) | 1.18 (0.88) | 0.213 | 0.506 |
| Cholesterol, mol/Lnormal range <5.18 | 3.93 (1.33) | 4.01 (1.45) | 3.98 (1.44) | 4.01 (1.34) | 0.458 | 0.657 |
| Lymphocyte count, *10^9/Lnormal range 1.1-3.2 | 1.19 (0.85) | 1.05 (0.65) | 0.95 (0.51) | 1.01 (0.63) | 0.600 | <0.001 |
| Lymphocyte proportion,%normal range 20-50 | 26.4 (18.68) | 19.60 (16.10) | 15.15 (10.73) | 19.0 (15.45) | 0.193 | <0.001 |
| C-reactive protein, mg/dLnormal range 0-0.5 | 0.69 (2.56) | 2.75 (5.27) | 3.14 (5.10) | 2.81 (5.40) | 0.481 | <0.001 |
| d-dimer, µg/mLnormal range 0-1 | 0.45 (0.84) | 0.68 (1.30) | 0.62 (1.15) | 0.67 (1.24) | 0.934 | <0.001 |
| Albumin, g/Lnormal range 40-55 | 40.15 (7.10) | 38.10 (8.35) | 36.80 (6.02) | 37.8 (7.80) | 0.665 | <0.001 |
| ALT, U/Lnormal range 9-50 | 16.4 (11.67) | 38.1 (31.75) | 135.8 (158.13) | 42.4 (37.35) | <0.001 | <0.001 |
| AST, U/Lnormal range 15-40 | 18.70 (8.30) | 34.10 (22.15) | 76.85 (110.77) | 36.5 (27.28) | <0.001 | <0.001 |
| AST/ALT ratio | 1.16 (0.62) | 0.89 (0.78) | 0.68 (1.11) | 0.84 (0.85) | 0.175 | <0.001 |
| GGT, U/Lnormal range 10-60 | 17.05 (14.38) | 55.7 (39.25) | 119.0 (218.73) | 60.9 (64.95) | <0.001 | <0.001 |
| Total bilirubin, µmol/Lnormal range 2-20.4 | 8.50 (5.40) | 10.70 (9.15) | 15.75 (32.10) | 11.40 (9.85) | 0.007 | <0.001 |
| Elevated troponin I(n), >0.05?ng/mL | 30(5.0%) | 17(8.7%) | 4(12.5%) | 21(9.3%) | 0.522 | 0.066 |
| Comorbidities | ||||||
| Hypertension | 142 (23.5%) | 61 (31.4%) | 9 (27.3%) | 70 (30.8%) | 0.632 | 0.032 |
| Diabetes | 57 (9.5%) | 16 (8.2%) | 3 (9.1%) | 19 (8.4%) | 0.744* | 0.630 |
| Hyperlipidemia | 27 (4.5%) | 7 (3.6%) | 3 (9.1%) | 10 (4.4%) | 0.164* | 0.964 |
| Cardiac or Cardiac-vascular disease | 62 (10.3%) | 21 (10.8%) | 5 (15.2%) | 26 (11.5%) | 0.471 | 0.625 |
| Malignancy | 10 (1.7%) | 2 (1.0%) | 1 (3.0%) | 3 (1.3%) | 0.377* | 0.728 |
| Chronic renal disease | 24 (4.0%) | 2 (1.0%) | 1 (3.0%) | 3 (1.3%) | 0.377* | 0.054 |
| Cerebrovascular disease | 41 (6.8%) | 9 (4.6%) | 6 (18.2%) | 15 (6.6%) | 0.004 | 0.922 |
| Chronic pulmonary disease | 46 (7.6%) | 12 (6.2%) | 5 (15.2%) | 17 (7.5%) | 0.07 | 0.946 |
| Surgery | 47 (7.8%) | 12 (6.2%) | 3 (9.1%) | 15 (6.6%) | 0.463* | 0.562 |
| Liver fibrosis/cirrhosis | 13 (2.2%) | 9 (4.6%) | 2 (6.1%) | 11 (4.8%) | 0.664* | 0.039 |
| HBV | 12 (2.0%) | 5 (2.6%) | 1 (3.0%) | 6 (2.6%) | 0.615* | 0.565 |
| Staging | 0.978 | <0.001 | ||||
| Mild | 5 (0.8%) | 1 (0.5%) | NA | 1 (0.4%) | ||
| Standard | 495 (82.1%) | 132 (68.0%) | 23 (69.7%) | 155 (68.3%) | ||
| Severe | 56 (9.3%) | 36 (18.6%) | 6 (18.2%) | 42 (18.5%) | ||
| Critical | 46 (7.6%) | 25 (12.9%) | 4 (12.1%) | 29 (12.8%) | ||
| Hepatic stenosis on CT | 50 (8.3%) | 37 (19.1%) | 7 (21.2%) | 44 (19.4%) | 0.744 | <0.001 |
| Death | 60 (10.0%) | 33 (17.0%) | 5 (15.2%) | 38 (16.7%) | 0.791 | 0.007 |
Continuous data are expressed as median (IQR) and categorical data as number (%).
ALT, alanine aminotransferase; AST, aspartate aminotransferase; GGT, Gamma Glutamyltransferase; HBV, hepatitis B virus; CT, computerized tomography; LBA, liver biochemistry abnormality; LI, liver impairment.
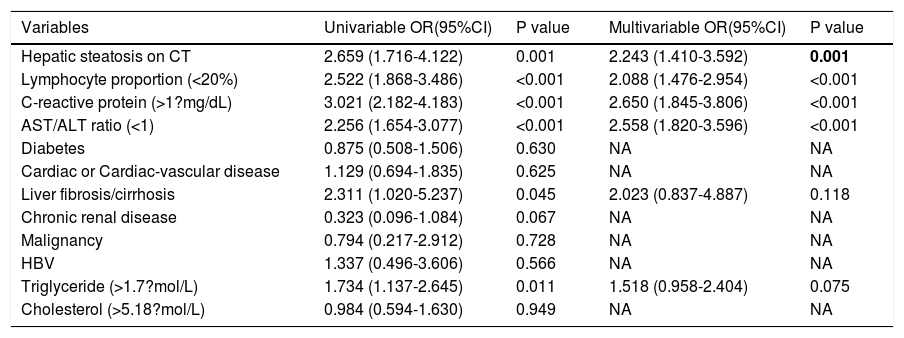
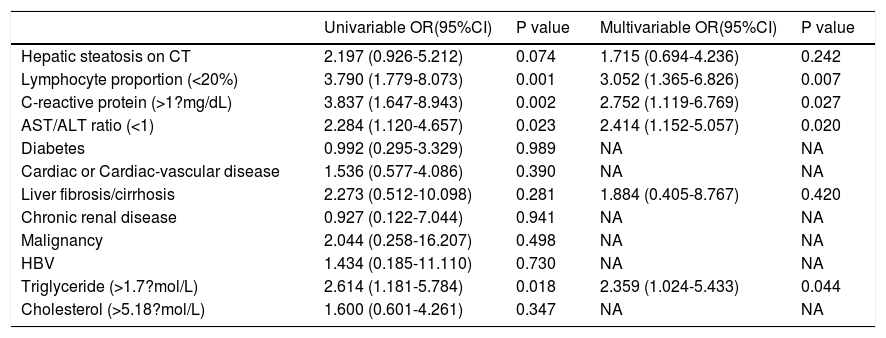
In univariable analysis, the odds of LBA development in patients were associated with the presence of hepatic steatosis, liver fibrosis/cirrhosis, and triglyceride levels higher than 1.7?mol/L (Table 3). Lymphopenia, elevated ALT/AST, and elevated CRP were also highly associated with LBA (Table 3). However, hepatic steatosis, HBV infection, and liver fibrosis/cirrhosis were not related to LI. The multivariable logistic regression model was developed with the data for all 830 patients with complete data for all variables (603 non-LBA, 195 mild-LBA, and 32 LI). We found that hepatic steatosis, lymphocyte proportion less than 20%, CRP index higher that 1?mg/dL, and AST/ALT ratio greater than 1 on admission were highly associated with increased odds of LBA (Table 3). Furthermore, lymphocyte proportion (<20%), CRP (>1?mg/dL), AST/ALT (ratio >1), and triglyceride level (>1.7?mol/L) were highly correlated with increased odds of LI (Table 4). These findings suggested that a systemic inflammation response in the patients was the primary reason for LI at admission, followed by the high level of triglyceride (Fig. 2). ROC analysis indicated the area under the curves (AUCs) for predicting LBA and LI in the multivariable logistic regression models were 0.729 (95% confidence interval [CI] 0.697-0.759) and 0.765 (95% CI 0.735-0.793). The results also suggested that the sensitivity and specificity of the model were relatively moderate (Sensitivity: LBA, 76.2%, LI, 84.8%; Specificity: LBA, 58.2%, LI, 54.7%) (Fig. 3).
Risk factors associated with liver abnormality in COVID-19 patients.
| Variables | Univariable OR(95%CI) | P value | Multivariable OR(95%CI) | P value |
|---|---|---|---|---|
| Hepatic steatosis on CT | 2.659 (1.716-4.122) | 0.001 | 2.243 (1.410-3.592) | 0.001 |
| Lymphocyte proportion (<20%) | 2.522 (1.868-3.486) | <0.001 | 2.088 (1.476-2.954) | <0.001 |
| C-reactive protein (>1?mg/dL) | 3.021 (2.182-4.183) | <0.001 | 2.650 (1.845-3.806) | <0.001 |
| AST/ALT ratio (<1) | 2.256 (1.654-3.077) | <0.001 | 2.558 (1.820-3.596) | <0.001 |
| Diabetes | 0.875 (0.508-1.506) | 0.630 | NA | NA |
| Cardiac or Cardiac-vascular disease | 1.129 (0.694-1.835) | 0.625 | NA | NA |
| Liver fibrosis/cirrhosis | 2.311 (1.020-5.237) | 0.045 | 2.023 (0.837-4.887) | 0.118 |
| Chronic renal disease | 0.323 (0.096-1.084) | 0.067 | NA | NA |
| Malignancy | 0.794 (0.217-2.912) | 0.728 | NA | NA |
| HBV | 1.337 (0.496-3.606) | 0.566 | NA | NA |
| Triglyceride (>1.7?mol/L) | 1.734 (1.137-2.645) | 0.011 | 1.518 (0.958-2.404) | 0.075 |
| Cholesterol (>5.18?mol/L) | 0.984 (0.594-1.630) | 0.949 | NA | NA |
ALT, alanine aminotransferase; AST, aspartate aminotransferase; HBV, hepatitis B virus; CT, computerized tomography; OR, odds ratio.
Risk factors associated with liver impairment in COVID-19 patients.
| Univariable OR(95%CI) | P value | Multivariable OR(95%CI) | P value | |
|---|---|---|---|---|
| Hepatic steatosis on CT | 2.197 (0.926-5.212) | 0.074 | 1.715 (0.694-4.236) | 0.242 |
| Lymphocyte proportion (<20%) | 3.790 (1.779-8.073) | 0.001 | 3.052 (1.365-6.826) | 0.007 |
| C-reactive protein (>1?mg/dL) | 3.837 (1.647-8.943) | 0.002 | 2.752 (1.119-6.769) | 0.027 |
| AST/ALT ratio (<1) | 2.284 (1.120-4.657) | 0.023 | 2.414 (1.152-5.057) | 0.020 |
| Diabetes | 0.992 (0.295-3.329) | 0.989 | NA | NA |
| Cardiac or Cardiac-vascular disease | 1.536 (0.577-4.086) | 0.390 | NA | NA |
| Liver fibrosis/cirrhosis | 2.273 (0.512-10.098) | 0.281 | 1.884 (0.405-8.767) | 0.420 |
| Chronic renal disease | 0.927 (0.122-7.044) | 0.941 | NA | NA |
| Malignancy | 2.044 (0.258-16.207) | 0.498 | NA | NA |
| HBV | 1.434 (0.185-11.110) | 0.730 | NA | NA |
| Triglyceride (>1.7?mol/L) | 2.614 (1.181-5.784) | 0.018 | 2.359 (1.024-5.433) | 0.044 |
| Cholesterol (>5.18?mol/L) | 1.600 (0.601-4.261) | 0.347 | NA | NA |
ALT, alanine aminotransferase; AST, aspartate aminotransferase; HBV, hepatitis B virus; CT, computerized tomography; OR, odds ratio.
.")
 ROC curve for multivariable logistic regression model in predicting LBA with the AUC. (B) ROC curve analysis of multivariable logistic regression model in predicting LI.")
At hospital admission, 94 patients (11.3%, 94/830) were diagnosed with hepatic steatosis. Among them, 50 patients had normal values for the liver function metrics while 44 patients had elevated values. Thus, hepatic steatosis was more frequently observed in LBA patients (19.4%, 44/227) than in non-LBA patients (8.3%, 50/603). Indeed, hepatic steatosis was diagnosed based on the observation of CT attenuation in the liver parenchyma, which corresponds to CT liver attenuation and liver-to-spleen attenuation ratio within the ranges of 38.2?±?10.4 HU and 0.70?±?0.19, respectively. Among the patients with hepatic steatosis, 21, 21, 28, and 24 patients were assessed with hepatic steatosis scores of 2, 3, 4, and 5, respectively. There was no significant statistical difference in hepatic steatosis between severe and non-severe patients (CTL: mean 39.6?±?8.7 HU vs 37.9?±?10.8 HU, p?=?0.604; CTL/s: mean 0.72?±?0.16 vs 0.69?±?0.20, p?=?0.598). However, 27 (61.4%, 27/44) patients with LBA showed an obvious recovery in liver hypoattenuation on follow-up chest CT scans during hospitalization, evidenced by marked improvements in CT attenuation of the liver with therapeutic treatment (Fig. 1). Due to the lack of CT scans of the liver for these patients prior to hospitalization, it is not practical or feasible to compare the state of hepatic CT attenuation for these patients pre- and during hospitalization.
4DiscussionIn this retrospective study, 27.3% of the COVID-19 patients presented mild biochemistry abnormalities in the liver on admission, however, approximately 3.9% eventually developed LI. We identified several risk factors for liver dysfunction in COVID-19 patients who were hospitalized. In particular, several dominant factors, such as the identification of hepatic steatosis on CT, lymphocyte proportion less than 20%, CRP levels greater than 1?mg/dL, and AST/ALT ratio less than 1, were all associated with greater odds for liver dysfunction and LI in patients on admission.
In this study, the prevalence of liver dysfunction was higher than that of gastrointestinal symptoms such as diarrhea (1.6%) and anorexia (0.7%). Most COVID-19 patients with liver dysfunction present elevations in one or more aminotransferases, with less than a three-fold increase from the normal values [19]. Only 3.9% of patients developed into LI according to the updated guidelines for liver injury in COVID-19. These results were similar to those for patients with community-acquired pneumonia, with a very small impact on hepatocytes [20]. However, it has been shown that abnormal liver test results and liver injury in COVID-19 patients are associated with the progression to severe pneumonia [21]. Although severe patients may have higher level of d-dimer, creatinine, or brain natriuretic peptide [9,20], the exact relationship between liver injury and attack of coagulation system, kidney, or heart still remains unclear. Hypoxia induced by COVID-19 related complications (such as respiratory distress syndrome or multiple organ failure) may also cause hepatic ischemia and hypoxia-reperfusion dysfunction [22]. Compared with COVID-19 patients with no or mild syndromes, the level of GGT was slightly increased in severe COVID-19 patients, whereas there was no significant difference in total bilirubin between severe and mild patients. None of the enrolled patients developed acute or subacute liver failure, except for two patients with common bile duct obstruction and malignancy who progressed to acute liver failure. In our study, 24 patients had background of liver fibrosis or cirrhosis, however, a deterioration of liver function was not found during the treatment of COVID-19 with a careful consideration for the drug selection to avoid secondary hepatic damage. Considering their immunocompromised status, more intensive surveillance or individualized treatment is needed for severe patients with COVID-19 with other pathological conditions such as pre-existing liver disease [23]. The length of hospitalization in patients with liver impairment on admission would be longer than those cases with normal liver function, which results in a higher rate of death as well [13]. In our study, ALT, AST, and GGT were elevated primarily in severely ill COVID-19 patients, mostly with less than a two-fold change when compared with the reference value, which is consistent with previous studies [13]. ALT is one of the most sensitive indexes for liver function and is highly correlated with the permeability of the hepatocyte membrane. The AST/ALT ratio was generally higher than 1.0 and was significantly higher in critically ill patients. However, when the ALT level exceeded 50 U/L, the median AST/ALT ratio decreased to 0.53 and 0.57 in standard and severe patients, respectively. These results indicated the AST level was often higher than the ALT level when the latter was within the normal range. When the level of ALT rose above 50 U/L, the elevation of AST was less than that of ALT in standard and severe COVID-19 patients. However, in critically ill patients, the AST level was significantly higher than the ALT level, resulting in a higher AST/ALT ratio in critical patients than in standard and severe patients. This may partially explain the relationship between disease progression and the increase in the AST/ALT ratio. It was reported in two previous studies that an increase in the AST/ALT ratio is associated with progressive functional impairment in the liver due to chronic hepatitis [16,17,24,25]. Therefore, the AST/ALT ratio should be taken into consideration along with the levels of both ALT and AST to better assess the status of LI.
Dysfunctions in the host immune response, characterized by inflammatory storms and lymphopenia, are prominent manifestations of COVID-19 [9]. In COVID-19 patients, respiratory failure is characterized by a rapid and widespread hyperinflammatory response in the lungs that eventually leads to multiorgan failure and death. It has also been reported in previous studies that the peripheral lymphocyte count (mainly CD4 T and CD8 T cells) is significantly lower in COVID-19 patients, which might explain the close association between the degree of lymphopenia and the severity of the disease [18,19,26,27]. The underlying molecular mechanism of lymphocyte reduction during SARS-CoV-2 infection remains largely unknown. SARS-CoV viral RNA can be detected in T lymphocytes isolated from peripheral blood and lymph nodes in humans, indicating that SARS-CoV may directly infect T lymphocytes to invade other cells [20,28]. Strikingly, SARS-CoV-2 is not detected in lymphocytes, suggesting that it has very limited ability to replicate in the T cells. CRP is an inflammatory marker used for the diagnosis and prediction of morbidity in many infectious diseases. In severe COVID-19 patients, CRP increased significantly at the initial stage and was highly associated with disease progression in the early stages of infection [21,29]. Our data consistently suggested that CRP was an independent risk factor for the progression of liver dysfunction in COVID-19 patients.
In addition, some patients with LBA were more likely to have a RUCAM score higher than 3 than non-LBA patients. Drugs are associated to LBA. Antipyretic agents (acetaminophen) may cause liver damage or induce liver failure [30]. In addition, although currently there is no targeted antiviral treatment for COVID-19, many patients have also been treated with some antiviral agents, such as oseltamivir, abidol, ribavirin, botanicals (such as Lian Hua Qing Wen) which may have some hepatotoxic effects and cause an elevation of serum aminotransferases [31,32]. For the treatment of COVID-19 patients, when multiple drugs are used in combination, RUCAM score is required to evaluate the risk of drug-induced liver injury.
To the best of our knowledge, this is the first report describing detailed liver radiological manifestations for hospitalized patients with COVID-19. Specifically, 11.3% of the COVID-19 patients in our study were diagnosed with hepatic steatosis based on chest CT imaging. Our results suggest that the patients with hepatic steatosis had more than twice the incidence of liver dysfunction when compared with patients without hepatic steatosis. Mild-common hypoattenuation in the liver parenchyma was often found on initial CT and the decreased attenuation gradually recovered on follow-up CT scans during hospitalization as the viral infection improved. Therefore, we assume that the occurrence of hepatic steatosis is a transient change associated with COVID-19. Xu et al. reported the detection of microvesicular steatosis as well as mild lobular and portal activity in liver biopsy specimens from one dead COVID-19 patient [33]. Another study involving 115 patients showed there were no definite positive changes in the liver, with the exception of mild sinusoidal dilatation and minimal lymphocytic infiltration observed in the liver of a dead patient [21]. However, needle biopsy specimens in these two studies were performed after the death of the patients; hence, the original histopathologic characteristics of the liver at the early stage of viral infection were unknown. We identified hepatic steatosis as another independent risk factor for LI by logistic regression analysis. Given that the identification of hepatic steatosis in CT images was very weakly related to the severity of COVID-19, it is highly advisable for physicians to monitor dynamic changes in liver-related enzymes.
4.1LimitationsThe present study admittedly has several limitations. First, during the COVID-19 outbreak, asymptomatic patients were not hospitalized, which can cause biases of analysis in clinical observations. Second, the patients were only recruited from two designated centers in Wuhan. The sample size of the cohort was relatively small; therefore, it would be better to include patients from other hospitals in Wuhan, other cities in China, and even other countries across the world to create a large dataset. Third, all data were retrieved from the digital medical records during hospitalization but the baseline results for the laboratory tests, liver CT, and medication history of COVID-19 patients before hospitalization were not included or available. Finally, there were some side effects from chest CT imaging on the detection of liver attenuation. Since chest CT imaging using a low-dose scan protocol can potentially affect the liver attenuation measurements, we used an iterative reconstruction technique in an attempt to improve the quality of the images [34].
5ConclusionsPatients with COVID-19 frequently exhibit liver abnormalities but only 3.9% develop LI. For hospitalized COVID-19 patients, hepatic steatosis is a risk factor for LBA, though LBA may not develop into LI. All test results should be taken into account, including the CRP levels, lymphocyte proportion, AST/ALT ratio, and triglyceride levels. Close clinical surveillance of hepatic function is essential for the early assessment of LI in COVID-19 patients, and RUCAM might be recommended for evaluation the probability of drug or herb induced liver injury.
Ethics approval and consent to participateThe study was approved by the Medical Ethics Committee of Wuhan Central Hospital, Tongji Medical College, Huazhong University of Science and Technology (No. 202074). Before enrollment in this study, verbal consent was obtained from the patients or an accompanying relative if the patients were unable to provide consent. AbbreviationsALT alanine aminotransferase aspartate transaminase area under the curves coronavirus disease 2019 C-reactive protein computed tomography CT liver attenuation liver-to-spleen attenuation ratio value gamma-glutamyl transferase hepatitis B virus Hounsfiled Unit intensive care unit liver biochemistry abnormality liver injury non-alcoholic fatty liver disease receiver operating characteristic real-time reverse-transcription polymerase chain reaction Roussel Uclaf Causality Assessment Method Severe Acute Respiratory Syndrome Coronavirus 2
Not applicable.
Availability of data and materialNot applicable.
FundingNone.
Conflict of interestThe authors have no conflicts of interest to declare.
Not applicable.


