


Background and Rationale. Anemia is a major side effect of combination therapy for chronic hepatitis C. In this study, severity, potential risk factors for and potential underlying mechanisms of anemia were evaluated.
Patients and methods. 44 chronic hepatitis C patients on interferon-ribavirin treatment were included. Anemia-related parameters were measured before and during treatment. Potential changes in membrane phospholipids composition of erythrocytes of patients on anti-viral treatment and potentially increased erythrocyte susceptibility to osmotic or bile salt induced stress were explored.
Results. Anemia was almost universal during treatment, with evidence of hemolysis. Decrease of Hb after six months of therapy was 2.1 ± O.I mmol/L (range -0.6-4.1). Higher pre-treatment Hb, highest ribavirin dose (1S-17.S mg/kg) and lower pre-treatment platelet level were independent risk factors for decrease of Hb. Serum erythropoietin levels increased during treatment with negative correlation to Hb levels at week 12 (r = -0.70, p = 0.002) and 24 (r = -0.72, p = 0.002). Erythrocyte membrane phospholipid composition did not differ between anemic patients and healthy controls. Also, resistance to osmotic or bile salt induced stress was normal in anemic patients. Phosphatidylserine exposure at the outer membrane leaflet did not change upon 24 hrs ex vivo incubation with pharmacological ribavirin concentration.
Conclusions. Anemia is almost universal during anti-HCV treatment. The extent of anemia correlates with pre-treatment levels of thrombocytes and Hb and with high ribavirin dosing. Although we found hemolysis as contributing factor, our data do not indicate that altered membrane phospholipids composition is an important factor in pathogenesis of anemia.
Chronic hepatitis C is a life-shortening disease associated with significant morbidity and decreased quality of life. Current treatment (PEG-interferon and ribavirin) achieves a sustained response in 5090% of cases, depending on hepatitis C virus (HCV) genotype.1,2 Treatment may cause anemia, requiring dose-reduction or even discontinuation of therapy in up to one third of patients.3 The cause of anemia is probably multifactorial: interferon might suppress bone marrow regenerative activity of erythroid progenitor cells and inhibit erythropoietin production.4,5 Also, ribavirin may induce dose-dependent hemolytic anemia.6-8 Ribavirin is converted into ri-bavirin-mono-, di-and triphosphate in all cell types but subsequent dephosphorylation back to ribavirin occurs exclusively in nucleated cells, not in erythrocytes. Accumulated phosphorylated ribavirin derivates within the erythrocyte might lead to relative intracellular adenosine triphosphate (ATP) depletion,9-12 impaired antioxidant defense and possibly, premature removal from the circulation.13
The major structural phospholipids of the erythrocyte membrane outer leaflet are phosphatidylcholine and sphingomyelin. Phosphatidylserine, phosphatidylethanolamine and phosphatidylinositol are mainly located in the inner leaflet.14-17 Such membrane asymmetry, dependent on flippase activity, is essential for membrane integrity and cellular function.18-20 Increased intracellular ribavirin could induce a change of phospholipid composition with enhanced signalling for red cell removal from the circulation. In this study, we explored potential changes in erythrocyte membrane phospholipid composition and susceptibility to osmotic or bile salt induced stress in anemic hepatitis C patients on anti-viral treatment. We also determined serum erythropoietin levels in a subgroup of patients and related these to various clinical parameters of anemia.
MethodsPatients44 treatment naive chronic hepatitis C (CHC) patients participating in a multicenter, randomised placebo-controlled trial comparing standard therapy (interferon/ribavirin combination therapy) with an experimental triple regimen (interferon/ribavirin and amantadine), were included in this study. All patients provided written informed consent and the protocol was approved by the medical ethical committee of the UMC Utrecht. Baseline patient characteristics are given in Table I. 36% of patients had severe fibrosis or cirrhosis corresponding with Me-tavir score F3-F4.21 Treatment consisted of weight-based ribavirin (Rebetol®, Schering Plough B.V. Maarssen, The Netherlands: 1,000 mg/day in case of body weight < 75 kg, 1,200 mg/day in case of body weight > 75 kg) and interferon (Intron A®, Schering Plough B.V. Maarssen, The Netherlands) 10 MIU/ day during days 1-6, 5 MlU/day during days 7-12, thereafter 3 MlU/day until week 26 and 3 MIU TIW during weeks 27-52 in combination with amantadine hydrochloride 200 mg per day or placebo for 52 weeks. Amantadine was part of the treatment regimen in 50% of the cases. According to the protocol, dose modification was indicated whenever Hb concentration was < 4.9 mmol/L. Patients were grouped according to actually received ribavirin dose in three predefined subgroups: group A: ribavirin < 13.5 mg/ kg/day, group B: ribavirin 13.5-15 mg/kg/day or group C: ribavirin 15.1-17.5 mg/kg/day. Thirty-two patients (73%: 95% CI 60-86%) reached a sustained viral response (SVR), defined as undetectable serum HCV RNA 12 months after discontinuation of antiviral treatment. One patient was lost to follow-up after 40 weeks of treatment. Of the remaining patients, five cases (11%: 95% CI 2-21%) had a persistently detectable HCV RNA after 24 weeks of treatment (non-response: 4 patients stopped antiviral therapy) and six patients (14%; 95% CI 4-24%) relapsed after week 52 after initially negative HCV RNA at 24 weeks.
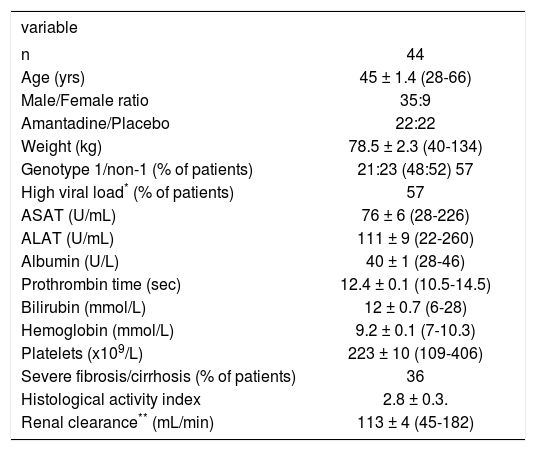
Baseline characteristics in treatment naive patients with chronic hepatitis C.
| variable | |
|---|---|
| n | 44 |
| Age (yrs) | 45 ± 1.4 (28-66) |
| Male/Female ratio | 35:9 |
| Amantadine/Placebo | 22:22 |
| Weight (kg) | 78.5 ± 2.3 (40-134) |
| Genotype 1/non-1 (% of patients) | 21:23 (48:52) 57 |
| High viral load* (% of patients) | 57 |
| ASAT (U/mL) | 76 ± 6 (28-226) |
| ALAT (U/mL) | 111 ± 9 (22-260) |
| Albumin (U/L) | 40 ± 1 (28-46) |
| Prothrombin time (sec) | 12.4 ± 0.1 (10.5-14.5) |
| Bilirubin (mmol/L) | 12 ± 0.7 (6-28) |
| Hemoglobin (mmol/L) | 9.2 ± 0.1 (7-10.3) |
| Platelets (x109/L) | 223 ± 10 (109-406) |
| Severe fibrosis/cirrhosis (% of patients) | 36 |
| Histological activity index | 2.8 ± 0.3. |
| Renal clearance** (mL/min) | 113 ± 4 (45-182) |
Data are presented as mean ± SEM with range in brackets.* Viral load > 800.000 IU/mL. ** By Cockroft-Gault.50
Taurocholate was obtained from Sigma Chemical Co. (St. Louis MO, USA) and yielded a single spot upon thin-layer chromatography (butanol-acetic acid-water, 10:1:1 vol/vol/vol, application of 200 µg bile salt). 3α-Hydroxysteroid dehydrogenase for the enzymatic measurement of bile salt concentrations22 and TRIS-HCl were purchased from Sigma. The Annexin V-fluorescein isothiocyanate (FITC) apoptosis detection kit was obtained from BD Pharmingen (San Diego CA, USA). 1-β-D-ribofuranosyl-1,2,4-tria-zole-3-carboxamide (ribavirin) was obtained from Sigma. All other chemicals and solvents were of ACS or reagent grade quality.
Clinical measurementsHemoglobin (Hb) levels were quantified by standard assay at baseline, at 1, 2, and 4 weeks after start of therapy and thereafter every four weeks during the entire study period. Anemia was defined as Hb < 7.4 mmol/L for females and < 8.6 mmol/L for males. Clinical anemia-related parameters were determined by standard assays before and after 12 weeks of anti-viral therapy. HCV RNA was tested by quantitative polymerase chain reaction (PCR) (Roche Amplicor HCV monitor Kit v2.0) and values > 800.000 IU/mL were considered high viral load. HCV genotype was determined using Innolipa. (Innolipa HCV II, Innogenetics, Ghent, Belgium).
Serum erythropoietin (sEPO) was quantified before, 12 and 24 weeks after start of therapy anti-viral treatment in a subgroup of 16 patients. Serum erythropoietin was measured using a chemiluminescent enzyme-labeled immunometric assay (Immunolite® EPO, Diagnostic Products Corporation (DPC, Los Angeles CA, USA)). The lower limit of detection for serum erythropoietin was 0.24 mU/mL and values between 3-20 mU/mL were considered normal.23 To determine whether the serum erythropoietin responses to the decreasing hematocrit were normal in our patients, their values were compared with the normal human response to anemia defined by the equation logEPO = 4.609 – 8.7xHt.24,25
Hemolysis induced by hypotonic solutions or taurocholateResistance of erythrocytes against osmotic and bile salt-induced stress of fresh human erythrocytes of anemic hepatitis C patients after twelve weeks of anti-viral treatment (Hb 6.2 ± 0.6 mmol/L) and from healthy controls (Hb 8.4 ± 0.3 mmol/L) was determined as described in detail before.26,27
Phospholipid composition of the erythrocyte membraneFresh erythrocytes (aliquots of 10 mL blood) were sedimented three times by centrifugation during 15 min. at 3,000 rpm. After discarding the plasma and the buffy coat, membrane phospholipids were extracted from the erythrocytes according to Reed.28 After separation by thin layer chromatography (chloroform:methanol:acetic acid:water – 50:25:8:3 vol/vol/vol/vol), phospholipid contents of separated spots were quantified according to Rouser.29
Exposure of phosphatidylserine and hemolysis after ribavirin incubationPhosphatidylserine normally localizes to the inner leaflet of erythrocyte membranes but becomes exposed to the cell surface in pathologic or aged cells, with subsequent removal from the circulation.30-33 Annexin V is a calcium-dependent phospholipid-binding protein that exhibits a high affinity for cell membranes exposing phosphatidylserine on the outer leaflets.34 Fresh erythrocytes of normal volunteers were incubated during 15, 30, 45, 60, 240 min and 24 h at 37 °C with solution containing 3.125 µg/mL ribavirin in order to mimic a therapeutic concentration of ribavirin in the tube (2.5 µg/mL).9 After addition of FITC labelled annexin V, phosphatidylserine exposure was measured by quantifying fluorescence in a Becton Dickinson Fluorescence Automate Cell sorter.35 During all incubations hemolysis was assayed by measuring absorbance of hemoglobin in the supernatant at 540 nm.36
StatisticsValues are expressed as means ± SEM or in case of non-parametric distribution, as medians (range). Differences between groups were tested with unpaired t-tests or Mann Whitney-U tests as appropriate. Differences between pre-treatment and on-treatment data were tested with paired t-tests or with repeated measurement ANOVA. Correlation between parameters was tested for statistical significance by Pearson correlation tests or Spearman Rank test in case of non-Gaussian distribution. In order to identify risk factors for Hb decrease during the first 24 weeks (ΔHb), univariate and multivariate linear regression analyses were performed. Coefficients are expressed with 95% confidence intervals (C.I.). First, determinants were examined in univariate analysis. Only determinants with coefficients significant at the 0.2 level were included in subsequent multivaria-te analysis. In multivariate analysis, stepwise regression procedure was used. A two-sided p-value < 0.05 was considered statistically significant.
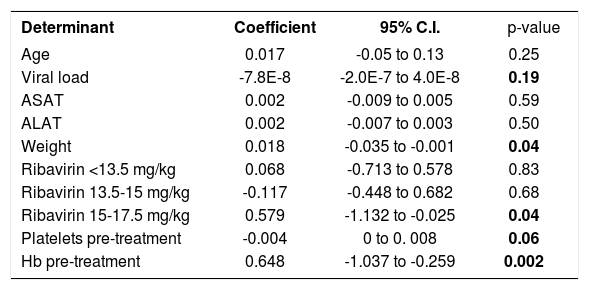
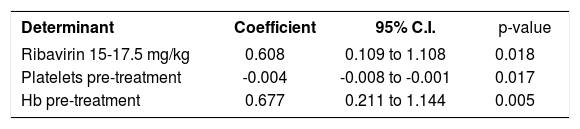
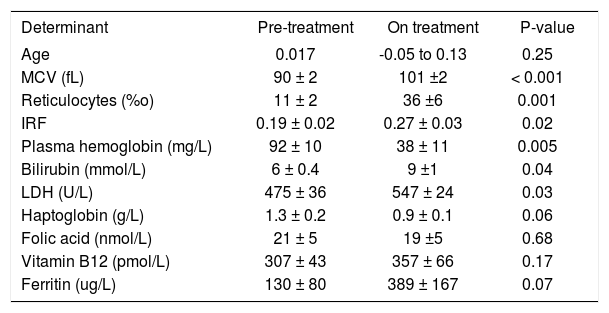
ResultsAnemia during antiviral therapyMean pre-treatment level of hemoglobin was 9.2 ± 0.1 mmol/L. During antiviral treatment, mean hemoglobin decreased 2.6 ± 0.1 mmol/L (28%, range 11-44%) if pre-treatment Hb level was compared to lowest Hb level at any time point during treatment. 98% of patients developed anemia during antiviral therapy (see “Methods” for definitions), and 27 patients (61%) experienced a drop of hemoglobin of at least 2.5 mmol/L. Nevertheless, no dose-reduction was required for anemia in any patient. Since there was no difference between amantadine and placebo groups in extent of anemia or any other parameter of potential relevance, these groups are reported together in the following. Hb levels started to decline two weeks after the first medication was taken and minimum values were reached after a median of 24 (range 2-52) weeks (Figure 1). Mean ΔHb, defined as difference between pre-treatment Hb and Hb at 24 weeks, was 2.1 ± 0.1 mmol/L. ΔHb was not different between patients with or without severe fibrosis/cirrhosis, between genotype 1 and non-1 patients or between patients with 1,000 and 1,200 mg ribavirin/day. ΔHb did not correlate with age, transaminases or histological activity index. Although ΔHb was greatest in patients with highest weight-based dose of ribavirin, ΔHb did not differ significantly (p = 0.44) between the various ribavirin doses (2.2 ± 0.2 mmol/L, 2.1 ± 0.2 mmol/L and 2.5 ± 0.2 mmol/L in groups with ribavirin < 13.S mg/kg/day, 13.5-15 mg/kg/day and 15.1-17.5 mg/kg/day). Determinants associated with greater ΔHb at the 0.2 level in the univariate regression analysis were: weight, highest ribavirin dose (15-17.5 mg/kg), higher pre-treatment level of Hb, lower viral load and lower pre-treatment platelet level (Table 2A). Multivariate analysis identified only higher pre-treatment Hb, highest ribavirin dose (15-17.5 mg/kg) and lower pre-treatment platelet level as independent risk factors for decrease of Hb (Table 2B). As shown in Table 3, significant differences between pre-and 3 month treatment levels of mean corpuscular volume (MCV), %c of reticulocytes, immature reticulocyte fraction (IRF), plasma hemoglobin, bilirubin and lactate dehydrogenase (LDH) were found. Median pre-treatment level of serum erythropoietin measured in a subgroup of 16 patients, was 8 (5-48) mU/ mL, increased to 51 (13-326) mU/mL after 12 weeks and to 67 (7-1590) mU/mL after 24 weeks of treatment (Figure 2A: p < 0.001). Baseline levels of serum erythropoietin were not associated with baseline levels of Hb or hematocrit (r = -0.23, p = 0.37 and r = -0.32, p = 0.21 respectively). In contrast serum erythropoietin levels at 12 and 24 weeks after start of treatment were negatively correlated with simultaneous Hb and Ht levels (r = -0.7, p = 0.002 and r = -0.78, p = 0.0004 for Hb and Ht levels at week 12: r = -0.72, p = 0.002 and r = -0.79, p = 0.0002 for Hb and Ht levels at week 24).
. One way repeated measured ANOVA reveals a significant Hb decrease during therapy (p < 0.0001).")
Univariate regression analysis of determinants associated with an increase in AHb.
| Determinant | Coefficient | 95% C.I. | p-value |
|---|---|---|---|
| Age | 0.017 | -0.05 to 0.13 | 0.25 |
| Viral load | -7.8E-8 | -2.0E-7 to 4.0E-8 | 0.19 |
| ASAT | 0.002 | -0.009 to 0.005 | 0.59 |
| ALAT | 0.002 | -0.007 to 0.003 | 0.50 |
| Weight | 0.018 | -0.035 to -0.001 | 0.04 |
| Ribavirin <13.5 mg/kg | 0.068 | -0.713 to 0.578 | 0.83 |
| Ribavirin 13.5-15 mg/kg | -0.117 | -0.448 to 0.682 | 0.68 |
| Ribavirin 15-17.5 mg/kg | 0.579 | -1.132 to -0.025 | 0.04 |
| Platelets pre-treatment | -0.004 | 0 to 0. 008 | 0.06 |
| Hb pre-treatment | 0.648 | -1.037 to -0.259 | 0.002 |
Mean clinical anemia-related parameters before and during treatment.
| Determinant | Pre-treatment | On treatment | P-value |
|---|---|---|---|
| Age | 0.017 | -0.05 to 0.13 | 0.25 |
| MCV (fL) | 90 ± 2 | 101 ±2 | < 0.001 |
| Reticulocytes (%o) | 11 ± 2 | 36 ±6 | 0.001 |
| IRF | 0.19 ± 0.02 | 0.27 ± 0.03 | 0.02 |
| Plasma hemoglobin (mg/L) | 92 ± 10 | 38 ± 11 | 0.005 |
| Bilirubin (mmol/L) | 6 ± 0.4 | 9 ±1 | 0.04 |
| LDH (U/L) | 475 ± 36 | 547 ± 24 | 0.03 |
| Haptoglobin (g/L) | 1.3 ± 0.2 | 0.9 ± 0.1 | 0.06 |
| Folic acid (nmol/L) | 21 ± 5 | 19 ±5 | 0.68 |
| Vitamin B12 (pmol/L) | 307 ± 43 | 357 ± 66 | 0.17 |
| Ferritin (ug/L) | 130 ± 80 | 389 ± 167 | 0.07 |
MCV: Mean corpuscular volume. LDH: Lactate dehydrogenase. IRF: Immature reticulocyte fraction.
 before and during antiviral treatment. Bars indicate median values at various time points. * p < 0.001 compared to basal. B. Relationship between serum erythropoietin and hematocrit levels (r = -0.88, p < 0.0001) in our population. For comparison, the regression line (-)of the normal compensatory erythropoietin response to anemia defined by the equation logEPO = 4.609-8.7xHt (see ref 24 and 2S) is also shown.")
A. Serum erythropoietin levels of individual patients (N = 16) before and during antiviral treatment. Bars indicate median values at various time points. * p < 0.001 compared to basal. B. Relationship between serum erythropoietin and hematocrit levels (r = -0.88, p < 0.0001) in our population. For comparison, the regression line (-)of the normal compensatory erythropoietin response to anemia defined by the equation logEPO = 4.609-8.7xHt (see ref 24 and 2S) is also shown.
Also, ΔsEPO (sEPO at 24 weeks - pretreatment sEPO) correlated positively with ΔHb (r = 0.5, p =0.047) and inversely with pre-treatment level of Hb (r = -0.8, p = 0.001). ΔsEPO was not different between patients with or without histologically proven severe fibrosis/cirrhosis, between genotype 1 and non-1 patients or between males and females. Comparing the normal human response to anemia with the response in our population, no significant differences in the slope of hematocrit (x) versus logEPO (y) (-8.7 versus -8.7) and y-intercept (4.719 vs. 4.609) (Figure 2B) were found.
Effect of osmotic and bile salt induced stress on hemolysisIn Figure 3, hemolysis of erythrocytes induced by hypotonic buffer is shown for hepatitis C patients with anemia due to anti-viral treatment and for healthy controls. In TRIS-buffer solutions with concentrations ranging from 150 to 110 mM, hemolysis proved to be negligible. Hemolysis increased progressively at lower concentrations. Nevertheless, no difference was found in osmotic resistance pattern between erythrocytes of anemic patients and healthy controls.
 against osmotic stress of erythrocytes obtained from anemic patients during antiviral therapy for hepatitis C does not differ from healthy controls.")
Although low concentrations of taurocholate exhibited no effects, incubation with ≥ 15 mM of this detergent bile salt induced progressive dose-dependent hemolysis. Again there were no differences between erythrocytes of anemic patients and healthy controls (results not shown).
Phospholipid composition of the erythrocyte membraneNo differences in the phospholipid composition of the red cells membranes or in the sphingomyelin (SM)/phosphatidylcholine (PC) ratio were found between healthy controls and anemic hepatitis C patients on antiviral treatment. Sphingomyelin comprised 27.3 ± 0.7% and 25.1 ± 1% of total cell membrane phospholipids in hepatitis C patients and controls (P = NS). For phosphatidylcholine, these values were 32.7 ± 0.7% and 34.9 ± 1.7%, for phos-phatidylinositol/phosphatidylserine 14.1 ± 0.8% and 12.7 ± 0.3%, and for phosphatidylethanolamine 25.9 ± 1% and 27.2 ± 1.3% respectively (all not significantly different).
Annexin V assayPhosphatidylserine exposure on the outer leaflet of the erythrocyte was not detected after incubation up to 24 h with pharmacologically relevant ribavirin concentrations. Hemolysis after 24 h incubation with ribavirin and TRIS-buffer solution was respectively 5% and 6%.
DiscussionSpecific risk factors for developing anemia during antiviral therapy for hepatitis C are not well established. We found in our multivariate analysis, higher pre-treatment Hb level, lower pre-treatment platelet count and highest dose of ribavirin (> 15 mg/kg/day) to be independent factors associated with greater decreases of Hb. The correlation between pre-treatment Hb level and extent of Hb decrease during therapy has been described before37,38 and could be the consequence of the fact that a certain-more or less fixed-fraction of all circulating erythrocytes might be removed from the circulation during a certain time period during therapy. In line with previous data,38 greater ΔHb was associated with lower pre-treatment platelet level, but not with histologically proven severe fibrosis/cirrhosis. One may speculate that low thrombocyte levels are a more sensitive marker for severe liver disease than liver biopsy. Indeed, thrombocytopenia is generally the first hematological abnormality to occur in patients with cirrhosis.39
Recent data suggest increased platelet breakdown in chronic liver disease and cirrhosis, and to a lesser extent decreased platelet production and platelet dysfunction.40 Total ribavirin dose per day was not associated with magnitude of Hb decrease, and there were no significant differences in ΔHb between subgroups with low, intermediate or high weight-based ribavirin dose. This may be explained by the fact that there is a threshold ribavirin dosage of ≥ 1000 mg/day for development of anemia.41 In our study all patients received at least 11.2 mg ribavirin/kg bodyweight and no patient had a dose of less than 1,000 mg/day. Nevertheless, in our multiple regression analysis, ribavirin dose > 15 mg/kg/day proved to be an independent factor associated with greater AHb, in line with another recent study.42 Our study focused on baseline predictive factors for extent of anemia during antiviral treatment. It was recently reported, that early on-treatment extent of Hb-decli-ne (after 2-4 weeks of therapy) can predict extent of anemia during the subsequent treatment period.43,44 We found in a post-hoc analysis in the current study, a highly significant correlation between Hb-decline after 2 (r = 0.63, p < 0.0001) and 4 weeks (r = 0.71, p < 0.0001) of therapy and maximal decrease of Hb during the entire study period, thus confirming the previous reports. In the current study we found clear evidence of hemolysis, with elevated levels of bilirubin and LDH and decreased haptoglobin levels. Serum ferritin levels also increased, in line with previous studies.45 So far there are conflicting results in the literature about serum erythropoietin response during interferon-ribavirin therapy.25,37,46 This issue has considerable clinical relevance, since erythropoietic growth factors are used to increase hemoglobin levels and to reduce the need of ribavirin dose reductions.47,48 Our results show no correlation between logEPO levels and Ht in non-anemic patients before treatment but during the anemic period there was a significant inverse correlation between these parameters up to 24 weeks after initiation of therapy. Previous studies examined this correlation for shorter periods of maximal 12 weeks.25,37,46 Based on comparison with the normal human response to anemia, our data would suggest that serum erythropoietin response could be adequate in patients with anemia during antiviral therapy (Figure 2B). Since all available studies are hampered by relatively small patient numbers with severe anemia, and considering the appreciable inter-individual variation in normal serum erythropoietin response to anemia,49 further research is warranted on this issue.
We did not find changes of erythrocyte membrane phospholipid composition or decreased resistance to osmotic or bile salt-induced stress in anemic hepatitis C patients. Furthermore, after ex vivo incubation with ribavirin during 24 h, there was no enhanced exposure of phosphatidylserine on the outer leaflet of the membrane. Although we cannot exclude that longer incubation times could lead to different results, metabolites of ribavirin are already formed within a few hours of incubation.10 Also, normal phosphatidylserine exposure in patients with hemolytic anemia from other causes has been described, in line with our findings.30
It should be noted that our study was already designed in the year 1999 and executed in 2000. Therefore some aspects differ from current practice. For example, PEG-interferon rather than interferon is now generally used for treatment of hepatitis C. Also, high dose interferon induction therapy as applied in our study is now controversial, and sustained viral responses are now defined as negative HCV RNA 24 rather than 48 weeks after the end of therapy. Nevertheless, it is generally thought that ribavirin rather than (PEG-) interferon is the most important factor in development of anemia, the topic of the current study. Since we used the standard dose of ribavirin and there was a similar rate of anemia in the PEG-interferon and standard interferon groups in the two main registration trials we assume that our results would have been similar if PEG-interferon had been used.1,2
In conclusion, anemia occurs in most patients during anti-HCV treatment. Extent of anemia correlates with pre-treatment levels of thrombocytes and Hb and becomes aggravated by high ribavirin dosing. Although we found clear hemolysis as contributing factor, our data do not indicate altered membrane phospholipid composition as an important factor. Further research is needed to explore whether serum erythropoietin response is adequate during antiviral therapy.
AcknowledgementsWe thank R.A. de Vries, Rijnstate Hospital Arnhem, R.J. Lieverse, Gelre Ziekenhuizen Apeldoorn, P. Warners, Diaconessenhuis Zeist and S.Y. de Boer, Slingeland Hospital Doetinchem for their contribution in inclusion of patients. The important contribution of Dr J. van Hattum to this study is acknowledged.
Abbreviations- •
Hb: Hemoglobin
- •
HCV: Hepatitis C virus
- •
PEG-interferon: Pegylated interferon
- •
ATP: Adenosine triphosphate
- •
CHC: Chronic hepatitis C
- •
Ht: Hematocrit
- •
FITC: Fluorescein isothiocyanate
- •
sEPO: Serum erythropoietin
- •
IRF: Immature reticulocyte fraction
- •
MCV: Mean corpuscular volume
- •
LDH: Lactate dehydrogenase
- •
SM: Sphingomyelin
- •
PC: Phosphatidylcholine


