


Hepatocellular carcinoma (HCC) is the most common primary liver cancer and a major public health problem worldwide. Liver fibrosis is closely correlated with liver functional reserve and the risk of HCC development. Meanwhile, malignant tumors generally have high cellularity compared to benign tumors, which results in increased stiffness. Magnetic resonance elastography (MRE) has emerged as a new non-invasive technique for assessing tissue stiffness with excellent diagnostic accuracy, not only for assessing liver fibrosis but also for measuring tumor stiffness. Recent studies provide new evidence that MRE may play an important role in the management of patients with HCC and show several novel clinical applications, such as predicting the development of HCC, differentiating between benign/malignant liver lesions (FLL) and HCC pathological grades, assessing treatment response, and predicting recurrence after treatment, although some findings are controversial. Therefore, we conducted this review to summarize these novel applications of MRE in HCC patients and also discuss their limitations and future advancement.
Hepatocellular carcinoma (HCC) is the fifth most common malignancy and second most frequent cause of cancer-related death worldwide [1]. The overall survival of HCC patients was still very low, with a 5-year survival rate of <15% [2]. The most common causes of HCC are hepatitis B and/or hepatitis C virus infection, as well as alcoholic and non-alcoholic fatty liver disease (NAFLD) [3].
The degree of liver fibrosis seems to be a strong predictor of HCC development risk. Furthermore, 70–90% of HCCs develop in the context of pre-existing cirrhosis or advanced fibrosis [4]. Liver fibrosis is also closely related to liver functional reserve, which is an important factor in developing a treatment strategy and determining prognosis in HCC patients. The reference standard for staging liver fibrosis remains liver biopsy; however, this procedure has several limitations, including high cost, potential complications, sampling variability, and inter- and intra-observer variability in the interpretation of histopathological findings [5]. And it is also undesirable to repeatedly perform liver biopsies to assess disease progression and treatment response. Moreover, many physiological and pathological processes cause marked changes in the stiffness of tissue, not only in liver parenchyma but also in tumor tissue. Disorderly cell proliferation and changes in the microenvironment are accompanied by profound alterations in tumor stiffness [6]. Malignant tumors generally have high cellularity compared to benign tumors, which results in increased stiffness. Tumor stiffness may also be another candidate imaging biomarker to distinguish tumor features.
In fact, several non-invasive ultrasound elastographic techniques [7,8] have been used to measure tissue stiffness. In recent years, with the advancement of magnetic resonance imaging technology and equipment, magnetic resonance elastography (MRE), as a new non-invasive technique, has shown great potential and good development prospects not only in the staging of fibrosis in patients with chronic liver disease but also in the field of oncology [9,10]. Obesity, massive ascites, and operator dependence limit the use of ultrasound-based elastography, but those can't affect MR elastography. In addition, MRE has been shown to have higher diagnostic accuracy and better reproducibility than other elastographic modalities in staging hepatic fibrosis [11,12]. Moreover, this modality can play an important role in quantifying tumor stiffness. HCC is a unique malignancy because it does not require histological confirmation but is diagnosed primarily by imaging. So MRE may also be another supplementary imaging biomarker of HCC. Some evidence has been emerging in recent years. In this review, the clinical significance of MRE in HCC patients will be highlighted, along with an outlook on the shortcomings of the current technology and future developments.
2Current MRE techniquesStiffness is the ability of a tissue to resist deformation under certain stress, which is the biomechanical property of human tissue [13]. The basic principle of MRE is to calculate the tissue stiffness and related parameters by detecting the propagation of shear waves in the target organ. So far, liver MRE can be used extensively in existing clinical MR scanners. The most widely used MRE pulse sequences nowadays are phase-contrast two-dimensional gradient recovery echo (2D-GRE-MRE) sequences. The clinical liver MRE device consists of an active pneumatic mechanical driver, which is located outside the MRI scanning room and connected to the passive driver with a circular, rigid plastic tube. The mechanical wave is generated by the active driver and the commonly used 60 Hz wave provides sufficient wave conduction in the tissue for transmission through the tube to the passive driver. The passive driver is usually positioned close to the liver, under the right cartilage, with the patient in a supine position, and secured with a soft elastic band that maintains appropriate contact with the right upper quadrant rib cage; it delivers shear waves to the whole abdomen, including the liver. Typically, four 10 mm thick sections are acquired through the largest cross-section of the liver. Magnitude and phase images are automatically processed using an inversion algorithm to produce a two-dimensional image. The two-dimensional displacement maps are called “wave maps,” and the two-dimensional grayscale or color-coded maps are called “elastograms” that measure the hepatic stiffness. The reader can obtain a reliable liver stiffness measure (LSM) by outlining the region of interest (ROI) on the liver with a “confidence map,” avoiding the liver margin, severely dilated bile ducts, gallbladder fossa, large blood vessels, widened liver fissures, and wave interference regions. Mean values and measurement ranges are reported for four different levels of ROI. The mechanical property measured with MRE is the magnitude of the complex shear modulus expressed in kilopascals (kPa). This mechanical property represents the elasticity and viscosity of the tissue [11,14].
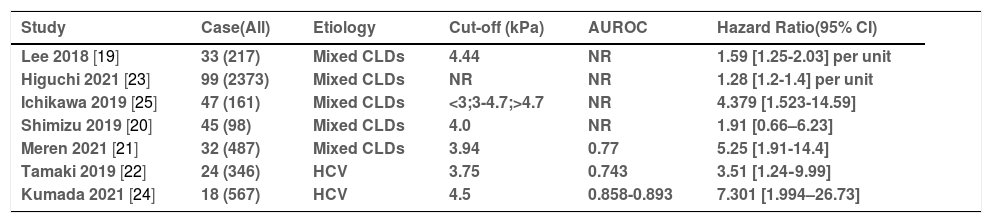
3Applications in HCC3.1Prediction of the HCC occurrence and portal hypertension (PHT)Assessing the risk of HCC occurrence in patients with chronic liver disease(CLD) is of critical importance for clinical management. Liver fibrosis is a potent prognostic factor that can reflect hepatic function and the risk of HCC development [15,16]. A retrospective case-control study by Motosugi et al. [17] firstly showed that liver stiffness measurement (LSM) by MRE in patients with HCCs was significantly higher than that in patients without HCCs, and it may be a significant predictor of HCC development. Subsequently, several studies found that the risk of HCC development increased with increasing MRE-associated liver stiffness in a dose-dependent manner [18,19]. In a recent large-scale retrospective study, the adjusted hazard ratio (aHR) for HCC was 1.28 (1.2-1.4) with each 1-kPa increase in LSM by MRE in patients with chronic liver disease [18]. Another study [19] showed a similar result (aHR = 1.59/unit; 95% CI = 1.20-1.78)in patients with CLDs. The optimal cut-off LS value for predicting the occurrence of HCC was set at 3.75-4.7 kPa in different studies [19–25]. The adjusted HRs could also be estimated by the highest versus lowest category of liver stiffness, ranging from 1.91 [0.66-6.23] to 7.301 [1.994-26.73]. The AUROCs predicted by LSM by MRE for the occurrence of HCC in CLD patients were 0.743-0.893. All these are shown in Table 1. It is expected that the development of HCC in patients with viral hepatitis will be suppressed after direct-acting antiviral (DAA) treatment. However, some patients developed HCC even after the eradication of the hepatitis C virus in clinical practice. Therefore, the prediction of HCC development after sustained viral responses has become more important clinically. Tamaki et al. [22] reported that LSM by MRE at the end of antiviral treatment was an independent predictor of HCC development, and its AUROC was higher than the fibrosis stage in histopathology, while 3.75 kPa was used as the optimal cut-off value. Importantly, the cut-off value (3.75 kPa) in Tamaki's study was lower than in other previous studies, which may be explained by the fact that LSM by MRE in patients with viral hepatitis C can change or revert with time following antiviral therapy [23]. However, in another study [24], MRE values >4.5 kPa was the only significant factor associated with the development of HCC in patients who achieved HCV eradication after DAA treatment. Meanwhile, some other authors have considered that a simple point assessment of pathology-based fibrosis staging is not able to accurately stratify the risk of HCC development. Ichikawa et al. [25] reported that the persistently high LSM value may be a greater risk factor for hepatocarcinogenesis than a single point measurement of current moderate-to-high liver stiffness, and that longitudinal monitoring of LSM by MRE can help to stratify the risk of developing HCC.
The summary of articles on predicting the occurrence of HCC in patients with CLDS
| Study | Case(All) | Etiology | Cut-off (kPa) | AUROC | Hazard Ratio(95% CI) |
|---|---|---|---|---|---|
| Lee 2018 [19] | 33 (217) | Mixed CLDs | 4.44 | NR | 1.59 [1.25-2.03] per unit |
| Higuchi 2021 [23] | 99 (2373) | Mixed CLDs | NR | NR | 1.28 [1.2-1.4] per unit |
| Ichikawa 2019 [25] | 47 (161) | Mixed CLDs | <3;3-4.7;>4.7 | NR | 4.379 [1.523-14.59] |
| Shimizu 2019 [20] | 45 (98) | Mixed CLDs | 4.0 | NR | 1.91 [0.66–6.23] |
| Meren 2021 [21] | 32 (487) | Mixed CLDs | 3.94 | 0.77 | 5.25 [1.91-14.4] |
| Tamaki 2019 [22] | 24 (346) | HCV | 3.75 | 0.743 | 3.51 [1.24‐9.99] |
| Kumada 2021 [24] | 18 (567) | HCV | 4.5 | 0.858-0.893 | 7.301 [1.994–26.73] |
CLD = Chronic liver disease; HCV = Hepatitis C virus; AUROC = Area Under the Receiver Operating Characteristics; NR = No Report; Case(All) = Number of patients with HCC occurrence (Number of patients in follow up).
On the other hand, patients with PHT present a higher risk of developing HCC, and HCC through changes in the hepatic architecture and vascular invasion also contributes to PHT occurrence [61]. Clinically significant portal hypertension, (CSPH) also impacts the choice of HCC treatment. CSPH is a well-identified predictive factor for liver decompensation and death after liver resection. Several studies have demonstrated the feasibility and utility of MRE in predicting portal hypertension. Both liver and spleen stiffness measurements by MRE have been shown high accuracy in predicting portal hypertension [63,64]. A most recent meta-analysis [62] showed the area under the curve (AUC) values for liver and spleen stiffness on MRE were 88% (95% CI 85–91%) and 92% (95% CI 89–94%), respectively. Spleen stiffness may be more specific and accurate than liver stiffness for detecting portal hypertension. Idilman et al. [9] introduced that high LSM, especially >5 kPa, was associated with an increased risk of portal hypertension and esophageal varices in clinical practice. Treatment options for such HCC patients with suspected combined portal hypertension (LSM >5kPa) should be carefully evaluated.
3.2Differentiation of benign/malignant liver lesions (FLL) and HCC pathological gradesWhen a focal liver lesion, (FLL) is found, the most important determination is to know whether it is benign or malignant. Some features of FLLs on computed tomography (CT) and magnetic resonance imaging (MRI) are useful for their diagnosis. Dynamic contrast-enhanced CT/MRI and the use of special contrast agents (GD-EOB-DTPA) for assessing imaging features provide more valuable clues to the type of FLL. However, some lesions are still not precisely determined and the use of contrast agents is expensive, plus radiation and/or nephrotoxicity in some patients. An imaging technique with high accuracy and without contrast agents is needed to provide additional information. Theoretically, FLLs mechanically differ from surrounding tissues and exhibit changes in their elasticity, with a tendency for increased stiffness in malignant lesions [6]. That is because the malignancy has an abundant extracellular matrix with increased vascular and interstitial pressure, which may lead to an increase in stiffness that can be assessed by elastography.
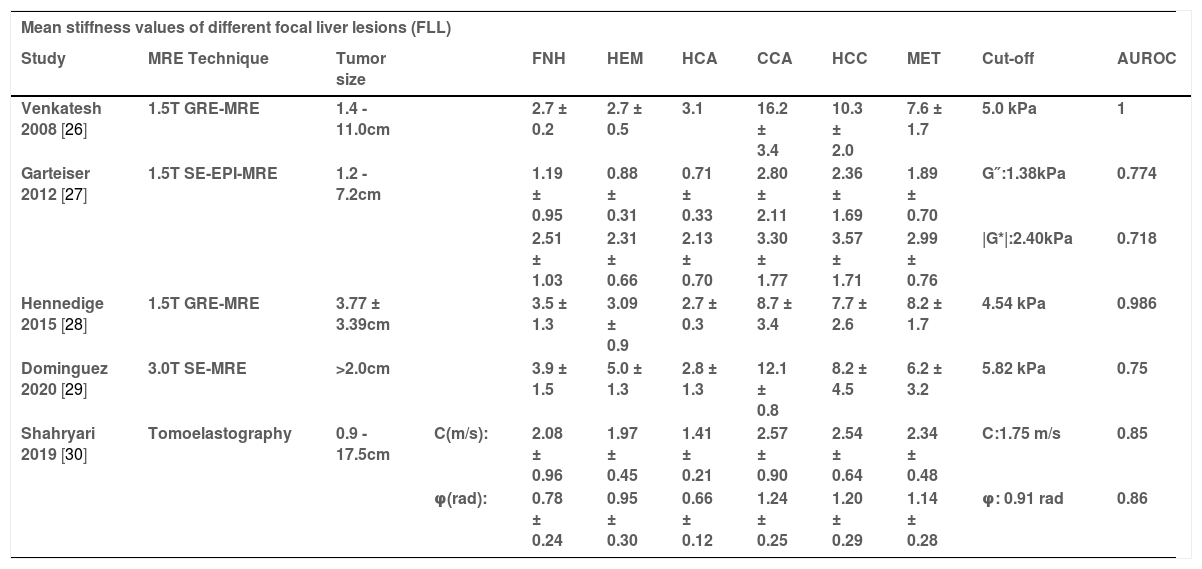
MR elastography (MRE) may be a promising technique capable of differentiating benign and malignant FLLs without the use of an intravenous contrast agent. The mean stiffness of different species of benign and malignant tumors as measured by MRE are collated in Table 2. Venkatesh et al. [26] were the first to demonstrate that malignant liver tumors had significantly higher mean shear stiffness (10.1 kPa; 95% CI, 8.7–11.4) than benign tumors (2.7 kPa; 95% CI, 2.4–3.0, p = 0.001). This study suggests that a cut-off value of 5.0 kPa may be very accurate (accuracy = 100%) for differentiating benign focal masses from malignant tumors.
Mean stiffness (kPa) values of different focal liver lesions and HCC tumor grade
| Mean stiffness values of different focal liver lesions (FLL) | |||||||||||
|---|---|---|---|---|---|---|---|---|---|---|---|
| Study | MRE Technique | Tumor size | FNH | HEM | HCA | CCA | HCC | MET | Cut-off | AUROC | |
| Venkatesh 2008 [26] | 1.5T GRE-MRE | 1.4 - 11.0cm | 2.7 ± 0.2 | 2.7 ± 0.5 | 3.1 | 16.2 ± 3.4 | 10.3 ± 2.0 | 7.6 ± 1.7 | 5.0 kPa | 1 | |
| Garteiser 2012 [27] | 1.5T SE-EPI-MRE | 1.2 - 7.2cm | 1.19 ± 0.95 | 0.88 ± 0.31 | 0.71 ± 0.33 | 2.80 ± 2.11 | 2.36 ± 1.69 | 1.89 ± 0.70 | G″:1.38kPa | 0.774 | |
| 2.51 ± 1.03 | 2.31 ± 0.66 | 2.13 ± 0.70 | 3.30 ± 1.77 | 3.57 ± 1.71 | 2.99 ± 0.76 | |G*|:2.40kPa | 0.718 | ||||
| Hennedige 2015 [28] | 1.5T GRE-MRE | 3.77 ± 3.39cm | 3.5 ± 1.3 | 3.09 ± 0.9 | 2.7 ± 0.3 | 8.7 ± 3.4 | 7.7 ± 2.6 | 8.2 ± 1.7 | 4.54 kPa | 0.986 | |
| Dominguez 2020 [29] | 3.0T SE-MRE | >2.0cm | 3.9 ± 1.5 | 5.0 ± 1.3 | 2.8 ± 1.3 | 12.1 ± 0.8 | 8.2 ± 4.5 | 6.2 ± 3.2 | 5.82 kPa | 0.75 | |
| Shahryari 2019 [30] | Tomoelastography | 0.9 - 17.5cm | C(m/s): | 2.08 ± 0.96 | 1.97 ± 0.45 | 1.41 ± 0.21 | 2.57 ± 0.90 | 2.54 ± 0.64 | 2.34 ± 0.48 | C:1.75 m/s | 0.85 |
| φ(rad): | 0.78 ± 0.24 | 0.95 ± 0.30 | 0.66 ± 0.12 | 1.24 ± 0.25 | 1.20 ± 0.29 | 1.14 ± 0.28 | φ: 0.91 rad | 0.86 | |||
| Mean stiffness (kPa) values of well/ moderately and poorly differentiated HCC | |||||||||||
|---|---|---|---|---|---|---|---|---|---|---|---|
| Study | MRE Technique | Tumor size | TS | well/moderately: | Poorly: | ||||||
| Thompson 2017 [31] | 2D-GRE-MRE | 5.3 ± 3.9 cm | TS-WT (kPa): | 6.5 ± 1.2 | 4.9 ± 1.2 | ||||||
| Wang 2018 [32] | 3.0T 3D-SE-EPI MRE | 2.3 – 15.5 cm | TS-WT (kPa): | 4.91 [4.01 – 6.48] | 7.28 [5.68 –9.80] | ||||||
| Park 2020 [33] | 1.5T 3D-SE-EPI MRE | 4.73 ± 3.17 cm | TS-WT (kPa): | 2.27 ± 0.77 | 1.86 ± 0.57 | ||||||
| TS-SP (kPa): | 2.33 ± 0.78 | 2.85 ± 1.31 | |||||||||
FLL = focal liver lesions; TS = Tumor stiffness; TS-WT = Tumor stiffness values for the whole tumor; TS-SP = Tumor stiffness values for the solid portion; SE-EPI = spin-echo echo-planar imaging; GRE = gradient-echo; FNH = Focal nodular hyperplasia; HEM = Hemangioma; HCA = Hepatic adenoma CCA = Cholangiocarcinoma; HCC = Hepatocellular carcinoma; MET = Metastasis.
A prospective study [27] showed that loss modulus (G”, kPa) and magnitude of the complex-valued shear modulus (|G*|, kPa) were measured by MRE with SE-EPI sequence. The ROC analysis for discriminating between benign and malignant lesions displayed similar statistical trends, whereby AUROC (0.774) of G″ was statistically higher than that of |G*| (AUROC: 0.718, p<0.05). In another study comparing MRE and diffusion-weighted imaging (DWI) [28], malignant FLLs also showed significantly higher mean stiffness than benign FLLs (7.92 vs. 3.12 kPa, p<0.001), and ROC analysis showed that MRE (AUROC = 0.986) performed better than DWI (AUROC = 0.87, p = 0.0016) in differentiating malignant and benign FLLs with an optimal cut-off value of 4.54 kPa.
The results of a most recent preliminary study [29] were consistent with these previous studies: malignant FLLs have significantly higher stiffness values than benign FLLs, and the optimal cut-off value was set at 5.8 kPa to provide 75–85% accuracy for differentiating these lesions. Moreover, Shahryari et al. [30] applied a novel MRE actuation system with a recently introduced analysis approach called Tomoelastography, which provides two parameters c and φ, c can be considered a surrogate of stiffness and φ indicates fluid tissue properties. c with a cut-off value of 1.75 m/s allowed distinction between benign and malignant lesions with a sensitivity of 94% and specificity of 78% (AUROC = 0.85). Similarly, φ with a cut-off value of 0.91 rad distinguished benign from malignant lesions with a sensitivity of 83% and specificity of 78% (AUROC = 0.86).
MRE also can help distinguish pathological features of HCC tumors. Thompson et al. [31] reported that there was a trend toward increased tumor stiffness in well/moderately differentiated HCC compared to poorly differentiated HCC. The reduced stiffness of poorly differentiated HCCs may be due to more necrosis and reduced vascularity. But this study only included a small sample size. Wang et al. [32] showed contrary results that tumor stiffness in well and/or moderately-differentiated HCC were significantly lower than that in poorly differentiated HCCs (4.91 [4.01–6.48]kPa vs. 7.28 [5.68–9.80] kPa, P = 0.001). Park et al. [33] conducted a retrospective study that seems to explain this discrepancy. Tumor stiffness values were measured separately for the whole tumor (TS-WT) and the solid portion (TS-SP) by adjusting for different ROIs methods, and these two tumor stiffness values of well or moderately differentiated HCC were also significantly higher than the poorly-differentiated HCC group. As necrotic areas have lower stiffness values compared with solid tumor components, when a tumor contains a greater degree of necrosis, TS-WT values could be lower than TS-SP values. The discrepancy between the results of the two previous studies may be due to the different proportions of tumor necrosis. Therefore, TS-SP may better represent the biological aggressiveness of HCCs than TS-WT. These results support the hypothesis that quantitative assessment of tumor stiffness by MRE can help identify liver lesions and differentiate HCC grades. It is worth noting that all above-published studies had not investigated FLLs below 1cm (Table 2) due to the lower spatial resolution of MRE, which limits its clinical use.
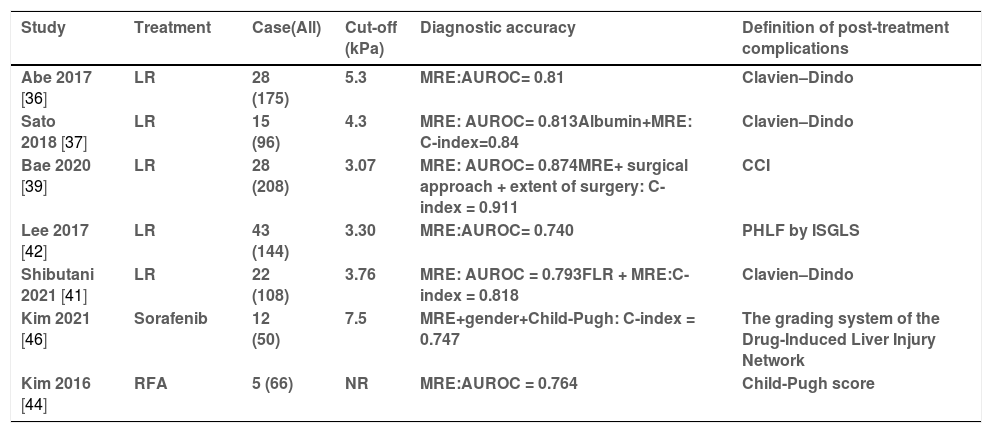
3.3Prediction of post-treatment complicationsHepatectomy is regarded as the most efficient and available treatment method for early HCC [34]. Advanced liver fibrosis and cirrhosis are present in the majority of HCC patients, which is associated with blood loss and severe postoperative complications, particularly in those undergoing major hepatectomy. Li et al. [35] first demonstrated that LSM by MRE was significantly correlated with liver functional reserve, which correlated strongly with postoperative complications. Several recent studies have reported that preoperative LSM by MRE correlates well with postoperative outcomes, which are summarized in Table 3. In a study from Japan [36] including 175 patients undergoing liver resection, LSM was mentioned as an independent predictor of major complications after liver resection. ROC analysis showed that the AUROC of LSM by MRE for predicting major complications was 0.81 with a cut-off value of 5.3 kPa. In another prospective study [37], the results of the ROC analysis showed that the LSM was determined to be the best cut-off value for predicting major complications at 4.3 kPa, with AUROC = 0.813. A C-index model combined with LSM by MRE and serum albumin concentration showed a higher precision (AUROC = 0.84). Another study from the same center [38] demonstrated that LSM by MRE could predict postoperative ascites occurrence with a C index of 0.7612. In a retrospective study that used the comprehensive complication index (CCI) as the reference standard [40], MRE also showed a higher performance than TE and ICG-R15 in predicting postoperative complications [39]. Furthermore, a prediction model of 3 variables (LSM by MRE, the type of surgical approach, and the extent of surgery) showed a good discriminative capability with a C-index of 0.911 in this study. Shibutani et al. [41] also combined the future liver remnant (FLR) by CT and LSM by MRE for predicting major complications after liver resection, with an area under the curve (AUC) of 0.818.
The summary of articles on predicting the post-treatment complications in HCC patients.
| Study | Treatment | Case(All) | Cut-off (kPa) | Diagnostic accuracy | Definition of post-treatment complications |
|---|---|---|---|---|---|
| Abe 2017 [36] | LR | 28 (175) | 5.3 | MRE:AUROC= 0.81 | Clavien–Dindo |
| Sato 2018 [37] | LR | 15 (96) | 4.3 | MRE: AUROC= 0.813Albumin+MRE: C-index=0.84 | Clavien–Dindo |
| Bae 2020 [39] | LR | 28 (208) | 3.07 | MRE: AUROC= 0.874MRE+ surgical approach + extent of surgery: C-index = 0.911 | CCI |
| Lee 2017 [42] | LR | 43 (144) | 3.30 | MRE:AUROC= 0.740 | PHLF by ISGLS |
| Shibutani 2021 [41] | LR | 22 (108) | 3.76 | MRE: AUROC = 0.793FLR + MRE:C-index = 0.818 | Clavien–Dindo |
| Kim 2021 [46] | Sorafenib | 12 (50) | 7.5 | MRE+gender+Child-Pugh: C-index = 0.747 | The grading system of the Drug-Induced Liver Injury Network |
| Kim 2016 [44] | RFA | 5 (66) | NR | MRE:AUROC = 0.764 | Child-Pugh score |
LR = Liver resection RFA = Radiofrequency ablation PHLF = post hepatectomy liver failure; ISGLS = International Study Group of Liver Surgery; CCI = The comprehensive complication index; NR = No Report MRE = Magnetic Resonance Elastography; Case(All) = Number of patients with post-treatment complication (Number of patients undergoing treatment).
Posthepatectomy liver failure (PHLF) is one of the major complications after hepatectomy. Lee et al. [42] demonstrated that LSM by MRE was assessed as a more potent biomarker for predicting PHLF, with an optimal cut-off of 3.30 kPa. The AUC for LSM was 0.740 (95% CI; 0.638–0.822, P = 0.001), higher than ICG-15 (AUC = 0.573) in predicting the development of PHLF. In addition, several variables, including high LSM by MRE, low serum albumin, major hepatic resection, higher albumin-bilirubin score, and higher serum-fetoprotein, were used to develop another risk prediction model for distinguishing PHLF with AUROC = 0.877 [43].
Except for surgical treatment, RFA has been recommended for early-stage HCC (less than 3 cm in diameter) in patients with liver cirrhosis. Kim et al. [44] demonstrated that the LSM by MRE was significantly associated with the development of liver function deterioration after RFA treatment, with AUROC = 0.764. In addition, Sorafenib, an oral multi-tyrosine kinase inhibitor, is the first regulatory-approved systemic therapeutic agent for advanced HCC patients. However, Sorafenib-induced liver injury is known to be idiosyncratic hepatotoxic and strongly associated with poor prognosis in HCC patients [45]. LSM by MRE was identified as a potent independent biomarker for predicting severe liver injury after Sorafenib administration. Higher LSM by MRE (> 7.5 kPa, HR 10.11, 95% CI 2.41–42.46) and higher Child-Pugh score (>6, HR 5.09, 95% CI 1.28–20.19) were identified as independent risk factors for predicting significant liver injury after Sorafenib administration, with the C-index calculated as 0.747 [46].
3.4Biomarker of treatment responseUnfortunately, many patients have the advanced-stage disease and are not candidates for radical treatment options such as tumor resection or liver transplantation [34]. In these cases, systemic or loco-regional therapy is used to treat the disease with promising results. Non-invasive quantitative imaging techniques can predict tumor response to these treatments and will provide useful information to clinicians. Recently, the performance of MRE as a marker of tumor response has been reported in a few preliminary studies.
Gordic et al. [47] reported that tumor stiffness (TS) after loco-regional treatment (90Y radioembolization/TACE/RFA) was significantly lower than untreated tumors (3.9 ± 1.8 vs. 6.9 ± 3.4 kPa, p = 0.006). There was a negative correlation between TS and the percentage of necrosis (r = -0.540, p = 0.0001). However, the opposite result appears in a recent prospective study [48]. Tumor stiffness (TS) and peritumoral liver stiffness (LS) were significantly increased after 90Y radioembolization treatment. Patients who achieved complete treatment response at six weeks were found to have significantly lower baseline TS and peritumoral LS than those who did not, but only 17 tumors were included in this study. Another study [49] focusing on the stiffness of colorectal liver metastases after chemoembolization therapy also found a significant increase in tumor stiffness at six weeks post-treatment.
In a preliminary study [50] about immunotherapy in advanced HCC patients, tumor stiffness increased by 0.12 kPa after treatment. In the correlation analysis, this change was significantly associated with overall survival (R = 0.81) and time to relapse (R = 0.88) and also significantly associated with tumor T lymphocytes (R = 0.79). This finding suggests effects related to immune cell infiltration and alteration in tumor stroma (including fibrosis and angiogenesis) can result in early increased tumor stiffness as an independent biomarker of treatment response. However, this is a pilot study that is meant to be hypothesis-generating, and the number of patients is very small (only nine patients). The results of the above studies are inconsistent, possibly due to different study designs and interval times between treatment and imaging. And these studies with low statistical power were due to the small sample size.
3.5Prediction of HCC recurrence after treatmentEarly tumor recurrence after treatment is associated with a poor prognosis in patients with HCC. Therefore, risk assessment for tumor recurrence should be considered in the treatment decision-making process. Previous studies have identified poor tumor differentiation and microvascular invasion as independent risk factors for HCC recurrence after surgical resection and liver transplantation [51,52].
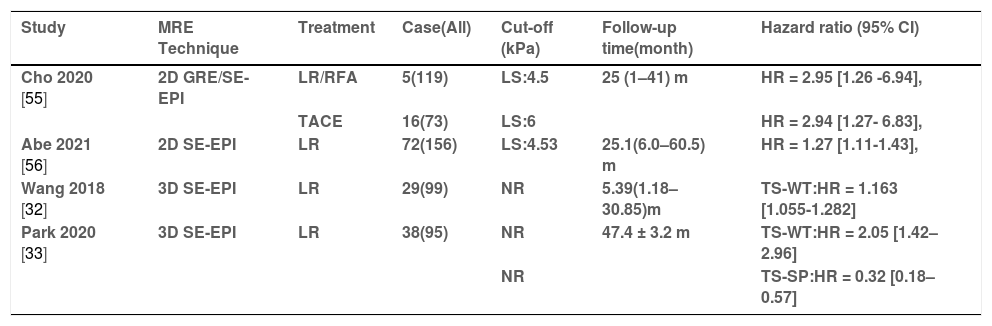
Several previous studies have found that LSM by Fibroscan can be an independent risk factor for the recurrence of HCC after treatment in patients with viral hepatitis [53,54]. Subsequently, studies about LSM by MRE on this topic have gradually emerged (Table 4). Cho et al.[55] reported that higher LSM (cut-off: > 5.5 kPa, HR = 1.12; 95% CI 1.01–1.25; p = 0.040) emerged as an independent risk factor for early tumor recurrence after treatment. In the subgroup analysis, higher LSM were associated with higher risks of early HCC recurrence in both the resection/RFA group (cut-off: > 4.5 kPa, HR = 2.95; 95% CI = 1.26–6.94) and the TACE group (cut-off: > 6 kPa, HR = 2.94; 95% CI = 1.27–6.83; p = 0.012). Interestingly, the cut-off value for the TACE-treated group was higher than those in other groups. It might be due to the proportion of Child-Pugh B grade/advanced HCC patients being higher in the group with TACE. In a recent prospective study, Abe et al. [56] also introduced that LSM by MRE and vascular invasion were identified as independent predictors of recurrence after hepatic resection for HCC. The optimal cut-off value for this study was set at 4.53 kPa, similar to the study by Cho et al. [55]. On the other hand, a study by Matsuda et al. [57] was not consistent with the above-mentioned studies; LSM by MRE wasn't associated with the recurrence of HCC.
The summary of articles on predicting HCC recurrence after treatment.
| Study | MRE Technique | Treatment | Case(All) | Cut-off (kPa) | Follow-up time(month) | Hazard ratio (95% CI) |
|---|---|---|---|---|---|---|
| Cho 2020 [55] | 2D GRE/SE-EPI | LR/RFA | 5(119) | LS:4.5 | 25 (1–41) m | HR = 2.95 [1.26 -6.94], |
| TACE | 16(73) | LS:6 | HR = 2.94 [1.27- 6.83], | |||
| Abe 2021 [56] | 2D SE-EPI | LR | 72(156) | LS:4.53 | 25.1(6.0–60.5) m | HR = 1.27 [1.11-1.43], |
| Wang 2018 [32] | 3D SE-EPI | LR | 29(99) | NR | 5.39(1.18–30.85)m | TS-WT:HR = 1.163 [1.055-1.282] |
| Park 2020 [33] | 3D SE-EPI | LR | 38(95) | NR | 47.4 ± 3.2 m | TS-WT:HR = 2.05 [1.42–2.96] |
| NR | TS-SP:HR = 0.32 [0.18–0.57] |
HR = Hazard ratio LS: liver stiffness TS-WT = tumor stiffness values for whole tumor; TS-SP = tumor stiffness values for solid portion; RFA = Radiofrequency ablation TACE = Transarterial chemoembolization LR = liver resection SE-EPI = spin-echo echo-planar imaging; GRE = gradient recovery echo; Case(All) = Number of patients with HCC recurrence (Number of patients undergoing treatment).
With the advance of 3D MRE techniques, they may provide better tumor stiffness estimates that are less affected by partial volume effects and other artifacts than conventional 2D methods. Wang et al. [32] first introduced the novel 3D MRE technique on this topic; the results showed that the tumor stiffness of HCCs with recurrence [5.89 (4.34–9.10) kPa] was significantly higher than that of HCCs without recurrence [4.87 (4.08–6.57) kPa]. The multivariate Cox proportional hazard model showed that tumor stiffness (HR = 1.163 per unit; 95% CI: 1.055-1.282) was a risk factor associated with early recurrence. Another study [33] evaluated two tumor stiffnesses of HCCs with 3D-MRE reconstruction and a new ROI selection method, including whole tumor (TS-WT) and solid fraction (TS-SP), both of which are significant factors associated with recurrence after surgery for a single nodal HCC. Among them, TS-SP values were positively correlated with the recurrence of HCC, while TS-WT values were the reverse. TS-SP might better represent the biological aggressiveness of HCCs because it removed the effect of the necrotic area.
4Limitations and advancesFirst, the majority of studies in this review were retrospective designs with a small sample size and from single center. The measurement parameters used in the current studies were different, limiting the comparison and technical standardization between different techniques and devices. Furthermore, the basic characteristics and etiology of the patients and the standard references for the outcomes varied among the studies. All these factors may affect reliability.
Second, the cut-off values varied widely across studies in the same clinical application. Likewise, they were similar among different indications, which would seem to limit their clinical usefulness. We speculate that this may be attributed to the fact that the occurrence and recurrence of HCC, portal hypertension, and post-treatment complications were all closely associated with advanced liver fibrosis/cirrhosis. Moreover, the LSM cut-offs that distinguish the fibrotic stages would not be similar for different basic characteristics and etiologies. Based on the currently available data, it seemed difficult to establish a specific point cut-off value for each different clinical application. A simple and practical cut-off value system was recommended by Mayo Clinic for general practice [9], which was derived using a large database and from a clinical management perspective. For any etiology of CLDs, LSM: 4.0-5.0kPa were recognized as patients with advanced fibrosis (stage 3-4) and considered suitable for surveillance and follow-up. LSM>5.0kPa were recognized as cirrhosis and associated with the development of complications, including HCC, portal hypertension, and decompensation.
Third, the most significant limitation of MRE in differentiating liver tumor stiffness is low spatial resolution. The conventional 2D-GRE MRE has a slice thickness of 1 cm and cannot accurately measure small tumors (<1 cm). In contrast, the slice count of 3D MRE usually ranges from 32 to 40 slices, which significantly improves the spatial resolution compared to conventional 2D-MRE reconstruction. Recent studies have shown that 3D-MRE may be more accurate than 2D-MRE in staging liver fibrosis [58]. Due to the long shear wavelength, liver MREs using a vibration frequency of 60-Hz may be less effective in distinguishing small, rigid HCC, and a higher vibration frequency may be appropriate to consider for smaller tumors. Meanwhile, a novel MRE actuation system that is called Tomoelastography, operates multiple drivers in parallel to ensure full wave penetration into the abdominal region of the body. It is more robust to noise than conventional recovery approaches and recovers spatially resolved stiffness measurements from even lower signal-to-noise ratio (SNR) regions of the organ [59]. These new techniques may become preferable in the future for assessing the stiffness of liver lesions.
Forth, MRE was most often used in the previous decade with gradient echo (GRE)-based sequences. However, SE-EPI-MRE has been widely used recently, and it outperforms GRE-MRE in terms of success rate, image quality, and liver coverage because of its low motion artifacts, short acquisition time, and comparable performance [60].
Future multicenter, large sample, prospective-designed cohort studies are necessary to validate these promising observations, especially under standardized technical conditions, such as subgrouping of included patients according to different baseline characteristics and etiology (HBV, HCV and NAFLD, etc.), harmonization of technical indicators of MRE (MRI field strength and sequence, etc.) and placement region of interest, and the same standard reference of outcomes.
5ConclusionsTo the best of our knowledge, this review is the first to summarize these new clinical applications of MRE in patients with HCC, which include predicting the occurrence of HCC, differentiating between benign/malignant liver lesions (FLL) and pathological grades of HCC, assessing treatment response, and predicting recurrence and complications after treatment. In summary, emerging evidence suggests that MRE may be suitable as a useful supplement to MRI enhancement in the clinical management of HCC. However, the evidence remains limited and this technique is not widely used in clinical practice.
FundingThis research received no specific grant from funding agencies in the public, commercial, or not-for-profit sectors.
Author contributionsStudy concept and design: JL, QZ, SZ, YC. Data collections: JL, QZ. Data analysis and interpretation: JL, QZ. Material support: JL, JC. Study supervision: SZ, MRG. Drafting of the manuscript: JL, JA. Critical revision of the manuscript for important intellectual content: MRG. All the authors gave their final approval of the version to be published and agreement to be accountable for all aspects of the work in ensuring that questions related to the accuracy or integrity of any part of the article are appropriately investigated and resolved.
Data availability statementData sharing is not applicable to this article as no new data were created or analyzed in this study.


