


Background & Aim: Imaging modalities have a role in the diagnosis of patients with nonalcoholic fatty liver disease. Aim of the present study was to evaluate the role of chemical shift magnetic resonance imaging in assessing hepatic steatosis and fibrosis in patients with nonalcoholic fatty liver disease.
Methods: Chemical shift magnetic resonance imaging was done in 10 biopsy proven patients (7 females, mean age 41 ± 9.2 years) with nonalcoholic fatty liver disease. Objective measurements of signal intensity (SI) were done and a ratio was calculated (SI out-of-phase liver/ SI out-of-phase kidney)/ (SI in-phase liver/ SI in-phase kidney). A lower ratio indicated a higher signal drop and hence higher fat content. The ratio was correlated with hepatic steatosis on histology (< 33% and > 33%). Patients were classified as having histological NASH or no NASH and MRI was assessed in diagnosing hepatic fi-brosis as seen on liver histology.
Results: Six patients had > 33% hepatic steatosis on histology. Five patients (50%) had evidence of histological NASH. MRI was not helpful in differentiating patients with and without his-tological NASH. One patient amongst NASH patients did not have fibrosis, one had stage 1, 2 had stage 2 and one had stage 4 fibrosis. SI ratio ranged between 0.350.69 in 6 patients with steatosis > 33% and was in the range of 0.69-1.20 in four patients with steatosis < 33% on histology. Fibrotic changes seen in 4 patients on biopsy were not detected on MRI.
Conclusion: Chemical shift MRI provides objective data on fat infiltration in patients with NAFLD without giving information about hepatic fibrosis.
Nonalcoholic fatty liver disease (NAFLD) is a broad term including patients of only steatosis and steatohepa-titis (NASH) which can progress to cirrhosis liver and its various complications including hepatocellular carcinoma (HCC).1 The term nonalcoholic steatohepatitis (NASH) was introduced by Ludwig et al2 in 1980 to describe histological changes indistinguishable from alcoholic hepatitis in patients with no or insignificant alcohol intake of less than 20 g/day.
Even though a definite diagnosis of NAFLD/NASH can be made only on histology, liver biopsy remains a controversial issue in patients with NAFLD due to the slowly progressive nature of the disease, lack of specific treatment and complications associated with liver biop-sy.3,4 Being non-invasive, imaging (ultrasonography, computed tomography and magnetic resonance imaging) plays an important role in detecting fat in the liver but its role in detecting liver fibrosis is limited.5
The aim of the present study was to assess the role of magnetic resonance imaging (MRI) in patients with NAFLD. To the best of our knowledge this is the first study from India regarding MRI in NAFLD.
MethodsPatientsIn a prospective analysis (April 2004 – March 2006), 10 patients with NAFLD diagnosed on the basis of history, clinical examination, serum biochemistry, ultrasound and a liver biopsy were included in the study. Inclusion criteria were adult (>16 yrs) nonalcoholic individuals (total abstinence or intake less than 20 g/day, confirmed by two family members) with raised serum alanine ami-notransferase (ALT) (> 1.5 x ULN x at least 6 months), ultrasound showing hyperechoic liver or other features of steatosis, negative viral markers (HBsAg, anti HCV - 3rd generation), negative autoimmune markers [anti-nuclear antibody (ANA), anti-smooth muscle antibody (ASMA), anti-liver kidney microsomal antibody (LKM), anti-mito-chondrial antibody (AMA)], normal serum ceruloplasmin & absent Keyser Fleisher rings on slit lamp examination, normal iron parameters and a liver biopsy consistent with NAFLD. Pregnant females were excluded from the study. All patients gave informed consent and the study was approved by the ethics committee of the institute.
AnthropometryAll patients underwent a detailed physical examination including anthropometry. Overweight (BMI •• 23 but < 25 kg/m2), obesity (BMI •• 25 kg/m2) and abnormal waist circumference [> 90 cm (males), > 80 cm (females)] were defined as per the Asia Pacific criteria.6,7
BiochemistryDiabetes mellitus was defined as per the WHO criteria with fasting plasma glucose (FPG) •• 126 mg/dL or plasma glucose •• 200 mg/dL in a symptomatic patient or a 2hour plasma glucose on glucose tolerance test • 200 mg/ dL.8 Lipid profile was taken as abnormal when serum cholesterol was >200 mg/dL, serum high-density lipo-protein (HDL) < 40 mg/dl in males & < 50 mg/dL in females, serum low-density lipoprotein (LDL) > 130 mg/dL and serum triglycerides were > 150 mg/dL.9
Metabolic syndromeMetabolic syndrome was defined by the presence of at least •• 3 out of five modified adult treatment panel III criteria including modified abnormal waist as per the Asia Pacific criteria, FPG >110 mg/dL (or a known diabetic on drugs), hypertension (blood pressure •• 130/85 mmHg or on anti-hypertensive drugs), serum triglycer-ides > 150 mg/dl, and serum high density lipoprotein (HDL) < 40 mg/dL (males) & < 50 mg/dl (females).9
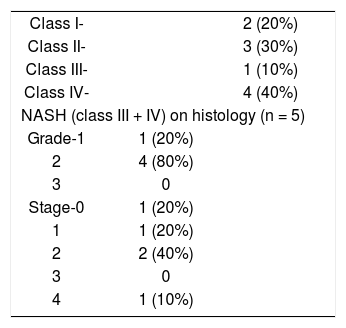
HistopathologyHistologically patients were classified as having hepatic steatosis < 33% and more than 33% and they were divided into four classes as per Matteoni et al (Class − 1 = Simple steatosis, Class − 2 = Steatosis + lobular inflammation, Class − 3 = + Ballooned hepatocytes, Class − 4 = + Mallory hyaline or fibrosis) and those patients with class 3 or 4 were defined as having NASH.10 Further patients with NASH were graded and staged according to Brunt et al.11
Insulin resistanceInsulin resistance was determined by homeostasis model assessment for insulin resistance (HOMA-IR) calculated as the product of fasting insulin (μU/L) and fasting plasma glucose (mmol/L) divided by 22.5. An absolute value of HOMA-IR > 1.64 was taken as abnormal.12-15
UltrasoundUltrasound was done by using a 3.5 or 5 MHz sector transducer (ATL HDI 5000, Philips). The liver echoge-nicity and any focal lesion or focal area of altered echogenicity was recorded. The degree of fatty infiltration was determined based on the increase in echoge-nicity of liver and relative visualization of diaphragm and intrahepatic vessel borders. Minimal increase in echogenicity with normal visualization of diaphragm and intrahepatic vessel borders was graded as mild fatty infil-tration. Slightly impaired visualization of intrahepatic vessels and diaphragm was graded as moderate while poor or no visualization of the hepatic vessels and dia-phragm was labeled as severe fatty infiltration.16
Magnetic Resonance ImagingChemical shift MRI was done on a 1.5 Tesla scanner (Siemens, Magnetom plus, Siemens Medical Systems, Er-langen, Germany). In-phase and out-of-phase gradient echo breath - hold images were obtained in the axial plane(TR /TE 128/5.3 and 128/2.7 ms, flip angle 70°) with a matrix of 144 x 256, slice thickness of 6 mm and FOV of 350 mm. The degree of signal loss of hepatic parenchyma in out-of-phase images indicative of fatty infiltration was recorded. Objective measurements of signal intensity (SI) were done in 10 patients and a ratio was calculated using the following formula, (SI out-of-phase liver/ SI out-of-phase kidney)/ (SI in-phase liver/ SI in-phase kidney).15 A region of interest (ROI) was drawn on the liver and anterior cortex of right kidney using an adjustable round cursor to measure the signal intensity. The ROI was drawn on the hepatic parenchyma to exclude blood vessels, motion artifacts and partial volume effects. The signal intensity of kidney was used as an internal reference in order to decrease the differences due to scanner calibration. A lower ratio indicated a higher signal drop and hence higher fat content. The ratio was correlated with the histopathology findings. This MRI technique exploits the difference in resonance frequency between protons in fatty acid molecules and protons in water molecules. If images are obtained when the fat and water protons are in-phase, their signals are additive. If images are obtained when the fat and water protons are out-of-phase, their signals are destructive.17
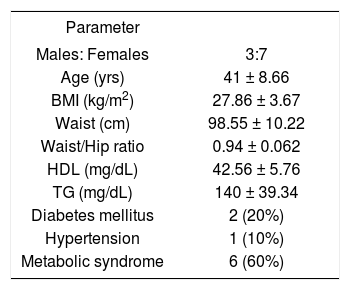
ResultsPatientsThere were 10 patients (7 females, age range 31-54 years, mean age 41 ± 9.2 years). Other clinical and biochemical details are shown in Table I.
Baseline characteristics of 10 patients with NAFLD.
| Parameter | |
|---|---|
| Males: Females | 3:7 |
| Age (yrs) | 41 ± 8.66 |
| BMI (kg/m2) | 27.86 ± 3.67 |
| Waist (cm) | 98.55 ± 10.22 |
| Waist/Hip ratio | 0.94 ± 0.062 |
| HDL (mg/dL) | 42.56 ± 5.76 |
| TG (mg/dL) | 140 ± 39.34 |
| Diabetes mellitus | 2 (20%) |
| Hypertension | 1 (10%) |
| Metabolic syndrome | 6 (60%) |
BMI – Body mass index
HDL – High-density lipoprotein
TG – Triglycerides
Patients with NAFLD had significantly higher HOMA-IR in comparison to the historical healthy controls (Mean HOMA – IR = 7.6 ± 2.9 vs. 1.4 ± 1.2) (p = < 0.01). Overall 8 patients had HOMA-IR > 1.64 suggesting insulin resistance in them.
Histopathology and imagingDetails of the histopathology are shown in Table II. Five (50%) out of ten patients with NAFLD had class III (1 patient) or IV (4 patients) disease amounting to histological NASH. Of these 5 patients none had severe inflammation and one had stage 4 fibrosis (cirrhosis). Ob-jective MR signal intensity evaluation was thus done in five patients with histological NASH and five patients with changes of only NAFLD without NASH on histology. There was no difference in MR signal intensity between patients with and without histological NASH. There were 6 patients who had steatosis > 33% on histology and the value of the SI ratio on MR imaging was in the range of 0.35-0.69 in these patients. These patients showed loss of signal intensity on out-of-phase imaging and moderate fatty infiltration on ultrasound (Figures 1a and 1b). There were 4 patients with steatosis < 33% on histology and the value of the SI ratio on MR imaging was in the range 0.69-1.20 in these patients. These patients had mild fatty infiltration on US. Four patients showed fibrotic changes on biopsy which were not detected on ultrasound or MRI.
 and out-of-phase (1b) showing loss of signal intensity of the liver parenchyma in out-of-phase image (1b). This patient had > 33% hepatic steatosis on liver biopsy.")
In this study we found that MRI is helpful in detecting hepatic steatosis but it could not differentiate patients with and without histological NASH and could not detect liver fibrosis in patients with histological NASH. Hepatic steatosis was detectable in all patients on ultrasound examination and was taken as inclusion criteria. Ultrasound has the advantage of being inexpensive and being readily available but gives subjective information about the fatty infiltration of liver. MRI abdomen though did not give additional information to what was available with ultrasound; it has the advantage of giving an objective evaluation of the fat fraction within the liver. Majority of our patients had mild fibrosis (Table II) and only one patient had stage IV fibrosis (cirrhosis). Fibrosis was not detected in our study but the role of MRI in patients with severe fibrosis may have to be studied in larger number of patients.
NAFLD is defined as fatty infiltration of liver exceeding 5-10% of liver weight and is expressed as percentage of fat laden hepatocytes observed by light microscopy. Classically, simple steatosis involves pure fatty metamorphosis without or with minimal inflammation. On the other hand nonalcoholic steatohepatitis (NASH) consists of varying degrees of inflammation, hepatocyte necrosis and fibrosis in addition to fat in the liver and has propensity to progress to cirrhosis and hepatocellular carcinoma.1
Since NAFLD is thought to have a benign long-term course, doing a liver biopsy in these patients is contro-versial.3,4 Arguments in favour of biopsy include: (i) exclusion of alternative causes of liver disease, (ii) distinguish simple steatosis from NASH, (iii) estimate prognosis based on degree of fibrosis, and (iv) determination of progression of fibrosis over time. Arguments against biopsy include: (i) generally good prognosis of NAFLD, (ii) lack of effective therapy, and (iii) the risks and costs associated with biopsy and (iv) sampling error and variability.
There are several non-invasive techniques which have been used to diagnose fat accumulation in the liver and several clinical and laboratory findings that enable a pre-diction of the presence of NASH, with or without fibro-sis. In a study of 93 mildly obese patients (BMI > 25 kg/ m2), age > 50 years, BMI > 28 kg/m2, alanine ami-notransferase more than twice the upper limit of normal and serum triglycerides > 1.7 mmol/L were all independent predictors of septal fibrosis, and septal fibrosis was strongly associated with necroinflammatory activity.18 Another report of obese patients undergoing bariatric surgery found that independent predictors of NASH and fi-brosis were an increased ALT, hypertension, an increased insulin resistance index, type 2 DM and an elevated waist-hip ratio.19 Ratziu et al evaluated Fibrotest (alpha -2 macroglobulin, apolipoprotein A1, haptoglobin, GGTP and total bilirubin) and actitest (biochemical parameters of fibrotest plus ALT) for the prediction of liver fibrosis in patients with NAFLD. They concluded that in patients with NAFLD, Fibrotest provides a simple and non-invasive quantitative estimate of liver fibrosis and reliably predicts extensive fibrosis and cirrhosis.20
These non invasive tests are not readily available and are expensive and because of the problems associated with liver biopsy for detecting the severity of liver disease and fibrosis, imaging modalities like ultrasound, CT scan, and MRI have been evaluated for assessing these patients. Ultrasound has a sensitivity and specificity of around 85% in detecting steatosis but is not a good modality for detecting liver fibrosis.16 In a recent study it was found that diagnosing fatty infiltration by ultrasound gave a specificity of 77%, a positive predictive value of 77% and a negative predictive value of 67%.21 Fibroscan (tissue elastography) is a new non-invasive modality in detecting liver fibrosis and its role is still being evolved in various liver diseases including NAFLD.22
CT scan does not add much and is probably as good as ultrasound for detecting fat in the liver. When a diagnosis of a fatty liver is based simply on a qualitative as-sessment of the differential attenuation during a contrast-enhanced CT scan, the sensitivity and specificity are 54% and 95% respectively.23 Using a cutoff of 20.5 HU, 80-100 seconds after i.v. contrast injection, a fatty liver could be diagnosed with 86% sensitivity and 87% specificity. Despite this, CT scan cannot differentiate between simple steatosis and steatohepatitis and cannot determine the degree of fibrosis.
MRI using chemical shift imaging has been used for the detection and quantification of fatty infiltration.24-26 This technique was first described by Dixon where the difference in resonance frequency between protons in fatty acid molecules and protons in water molecules is used to generate images.17 If images are obtained when the fat and water protons are in-phase, their signals are additive and when the fat and water protons are out-of-phase, their signals are destructive. There are limited studies in literature about the role of chemical shift MRI in NAFLD and few of them have quantified the fat objectively.27-29 Fishbein et al28 used the following formula for calculating the hepatic fat fraction (FF = SI in-phase-SI out-of-phase/2SI in-phase) and found that a fat fraction of less than 9% was normal, between 9% and 18% indicated mild steatosis and above 18% indicated severe steatosis. We used the right kidney as an internal reference to minimize scanner calibration errors. Saadeh et al5 have used the spleen as an internal reference in their study. However they did not correlate the objective values for the SI with the degree of hepatic steatosis. Magnetic resonance spectroscopy (MRS) is another method to measure the hepatic steatosis.30 In this technique however a single measurement can be obtained from a predetermined ROI. The whole liver is not assessed and retrospective selection of ROI cannot be done. The retrospective selection of ROI with chemical shift imaging allows areas of vascular structures to be avoided which could have otherwise confounded the measurements of hepatic fat content. In addition the acquisition time for gradient-echo chemical shift MR imaging is less than that for MRS.
Our study has certain drawbacks. The number of patients is small. Though a larger number of patients with NAFLD were seen during the study period only those who agree to undergo liver biopsy and MRI abdomen were included in the study, hence may not be representative of all the patients. Majority of patients had stage I or II fibrosis with only one patient having stage IV fibrosis (cirrhosis). Another limitation is that we did not have any controls in our study to evaluate the objective signal intensity ratio in livers without fatty infiltration.
In conclusion we found that chemical shift MRI provides objective data on fatty infiltration in patients with NAFLD. This information is provided by ultrasound, though only in a subjective manner. MRI does not differentiate patients with and without histological NASH and does not provide any information about hepatic fibrosis.


