


Background. Chemerin and retinol binding protein-4 (RBP-4) are adipokines which may play a role in the progression of NAFLD. It has been also suggested that cytokeratin-18 (CK-18) could be a marker of hepatocyte caspase-directed death while transgelin-2 production could reflect stage of liver fibrosis. The aim of this study was to evaluate the level of the above adipokines in sera of patients with NAFLD and determine the relation between the level of transgelin-2 and fibrosis-4 index (FIB-4).
Material and methods. Ninety-five subjects included initially to the study were divided into four groups: (I) prediabetics, obese with NAFLD and metabolic syndrome (Ms), (II) lean with NAFLD and without MS, (III) obese without NAFLD and MS, and (IV) healthy individuals. We determined the levels of chemerin, RBP-4, transgelin-2 and CK-18 fragments in sera of patients with NAFLD. Moreover, we examined if the levels of CK-18 fragments and transgelin-2 correlates with FIB4 value. Results. Chemerin and RBP-4 were highly expressed in sera of all NAFLD, especially in obese individuals. Chemerin level was also linked to MS. High level of serum CK-18 fragments and transgelin-2 did not correlate with obesity and MS, but seemed to correlate with progression of NAFLD to liver fibrosis.
Conclusions. In conclusion, the production of the two adipokines, chemerin and RBP-4, is strongly associated with obesity in patients with NAFLD. Serum concentrations of CK-18 fragments and transgelin-2 correlate with the severity of NAFLD, but not with obesity.
Nonalcoholic fatty liver disease (NAFLD) is the most common cause of liver disease in Western countries. It is estimated that its prevalence in the general adult population worldwide varies between 20 and 30%. However, among people with obesity and type 2 diabetes it may concern up to 70-90% of individuals, mainly due to the lifestyle habits and the epidemic of obesity and insulin resistance (IR).1 NAFLD causes a wide spectrum of liver damage, ranging from simple steatosis, fibrosis, nonalcoholic steatohepatitis (NASH) to cirrhosis. NAFLD has been frequently associated with obesity, type 2 diabetes mellitus (T2DM), hyperlipidemia and insulin resistance the main features of metabolic syndrome (MS).1,2 Obesity is considered an important risk factor of NAFLD, though not all patients with NAFLD are obese. Obesity is currently regarded as systemic, low-grade inflammation in which adipose tissue and its hormones play a central role. Adipose tissue releases chemokines which recruit macrophages. The latter release inflammatory cytokines stimulating inflammatory and suppressing anti-inflammatory adipokines. The majority of adipokines are also produced by hepatocytes. Among these, leptin was detected a potent mitogen and apoptosis inhibitor. Activated liver stellate cells acquire the ability to secrete leptin and further promote liver fibrosis. In contrast to leptin, adiponectin is considered an anti-inflammatory cytokine which reduces body fat and improves insulin sensitivity. Adiponectin induction was associated with protective action of saturated fat against the development of NAFLD in mice. Resistin, another adipokine, was shown to have a proinflammatory action in hepatic stellate cells, thus participating in liver fibrogenesis.3–6
According to several recent studies, the newly identified adipokine, retinol binding protein-4 (RBP-4), the specific carrier protein of retinol, is associated with the degree of adiposity and IR. Moreover, the level of this adipokine was found to be significantly higher in morbidly obese women with NAFLD 7. Finally, RBP-4 can be considered a convenient serum marker of intra-hepatic lipid content, as hepatocytes are the main source of this adipokine.8,9 Although promising, the above results have not been confirmed by all the authors. Some scientists deny correlation between serum levels of RBP-4 and BMI or IR.10–12
Chemerin, another newly discovered adipokine, is probably enhancing insulin-stimulated glucose uptake, stimulating adiponectin expression and inhibiting production of pro-inflammatory cytokines such as IL-6 or TNF-α.13 In the study performed by Döcke, et al., chemerin’s mRNA and serum chemerin concentration were significantly elevated in human NAFLD, especially in NASH when compared to healthy individuals.14 Other investigators suspect chemerin to be a marker of MS as chemerin systemic concentration and its expression in adipose tissue are increased in obese individuals.15,16 Meta-analysis strongly suggests that chemerin’s concentration in patients with obesity or MS may be associated with imbalances in lipid and glucose metabolism and it that it could promote IR.17
Transgelin-2 is 22kDa actin stress fiber-associated protein of the calponin family. Transgelin-2 has been reported to be involved in cell migration, and its level was significantly increased in activated pancreatic stellate cells. It has been suggested that transgelin-2 could be a useful target protein to modulate pancreatic stellate cells function.18 Unfortunately, there are no publications on the role of transgelin-2 in hepatic stellate cell function and on the development of liver fibrosis.
The emerging data suggest that hepatocyte apoptosis is typically present in humans with NASH but absent in patients with NAFLD. A central consequence of the apoptotic process is the activation of the effector caspases which cleave a number of different substrates including cytokeratin-18 (CK-18), the major intermediate filament protein in the liver, thus resulting in apoptosis. The determination of CK-18 fragments in the blood could be a useful test in NASH diagnosis and in evaluating severity of the disease.19,20
Several unique markers have been found as noninvasive models to predict hepatic fibrosis.21,22 These include simple fibrosis scores, advanced biochemical markers, and radiologic imaging studies. Simple fibrosis scores use readily available laboratory tests; AST/ALT ratio, fibrosis index (FIB-4), and others. Advanced biochemical markers include biomarkers of hepatocyte cell death such as cytokeratin-18 fragment levels, and transgelin-2.23 FIB-4 score helps to estimate the amount of scarring in the liver and, as non-invasive marker of fibrosis, could thus reduce the need for the liver biopsy.24
The aim of the study was to measure serum level of chemerin, RBP-4, CK-18 fragments and transgelin-2 as markers of fibrotic changes in the liver in NAFLD patients. Furthermore, the study aimed to compare serum concentrations of the examined adipokines in NAFLD patients and healthy controls. Moreover, we decided to correlate transgelin-2 and CK-18 with FIB-4. In order to detect the role of obesity and MS in NAFLD, patients were divided into 4 groups. First group included predia-betic obese patients with NAFLD and MS, second - lean patients with NAFLD without MS, third - obese patients without NAFLD and MS and fourth - healthy individuals.
Experimental ProceduresPatientsThe study was carried out on 124 adults who were admitted to the Medical University Hospital in Lublin (Poland) between April 2012 and December 2013. Of them, 95 patients were included into this study. Patients presenting different potential causes of liver disease such as:
- •
Daily alcohol consumption over 20 g.
- •
Viral hepatitis (hepatitis B and C).
- •
Autoimmune hepatitis.
- •
Treatment with hepatotoxic, steatosis-provoking, or immunosuppressive drugs during the previous 6 months.
- •
Wilson’s disease or haemochromatosis were excluded from the study.
Other exclusion criteria included T2DM, malignancy, clinical atherosclerosis, hematological or chronic kidney diseases, active infection, metformin treatment, and smoking. In all patients with NAFLD, liver biopsy was obtained in order to exclude patients having both - NASH and liver cirrhosis. All the patients agreed to undergo liver biopsy. The control group comprised 22 healthy individuals undergoing a routine health check-up program. Informed written consent was obtained from all participants in this study, which was conducted according to the ethical principles stated in the Declaration of Helsinki and approved by the institutional review board at the Medical University in Lublin, Poland.
Diagnostic criteriaThe anthropometric evaluation included measures of BMI and waist circumference. Blood samples with and without anticoagulants were obtained after an overnight fast from all subjects in order to perform biochemical analyses and determine adipokine/cytokine levels. The blood samples were kept in low temperature and the collected sera were frozen at minus 80 °C until adipokine measurement. All of the measurements were performed by enzyme-linked immunosorbent assay (ELISA) according to the manufacturer’s instructions. To minimize the laboratory errors, room temperature, air humidity, and incubator temperature were controlled.
Diagnosis of fatty liver was based on abdominal ultrasonography: increased echogenicity of the hepatic parenchyma with an attenuation of the portal vein echogenicity, increase of liver volumes and blunt liver edges and blurring of the intrahepatic bile ducts. Evaluation of the results of AU was performed by an experienced radiologist using real-time scanner (3.5 MHz; Siemens, Germany).
The histological diagnosis of NAFLD was defined according to original criteria for NAFLD subtypes and NAFLD activity score (NAS) based on the combined assessment of steatosis, inflammation and ballooning hepatocyte degeneration.25,26 According to the original criteria, the NAFLD was histologically categorized into four subtypes:
- •
Steatosis alone (NAFLD type 1).
- •
Steatosis with lobular inflammation only (NAFLD type 2).
- •
Steatosis with hepatocellular ballooning (NAFLD type 3).
- •
Steatosis with Mallory-Denk bodies or fibrosis (NAFLD type 4).
NAFLD subtypes 3 and 4 were considered to represent NASH. Histologic finding with stage 2 or above fibrosis were also defined as NASH. The diagnosis of NAFLD was based on the following criteria: liver biopsy, appropriate exclusion of liver disease of other etiologies, AU results, as well as HSI (> 36.0) and FLI (> 60.0) levels.
The body mass index (BMI) (kg/m2) of each study patient was calculated, based on their body weight and height. A patient was considered to be obese when his calculated BMI was ≥ 30 kg/m2. The diagnosis of MS was based on criteria of the International Diabetes Federation/ National Heart, Lung and Blood Institute/American Heart Association (IDF/NHLBI/AHA-2009) - the presence of at least three of the following features:
- •
Waist circumference ≥ 94 cm in men or ≥ 80 cm in women.
- •
Triglyceride level ≥ 150 mg/dL.
- •
HDL-cholesterol level < 40 mg/dL in men and < 50 mg/dL in women.
- •
Systolic blood pressure ≥ 130 mmHg or diastolic pressure ≥ 85 mmHg.
- •
Fasting plasma glucose level ≥ 100 mg/dL.
Prediabetes was defined by a fasting glucose level of 100-125 mg/dL and/or HbA1C 5.7-6.4% (American Diabetes Association).27
Fasting glucose and fasting insulin concentration levels were used to assess insulin sensitivity with the insulin resistance indicators:
- •
HOMA-IR (homeostasis model assessment):
- •
FIRI (fasting insulin resistance index):
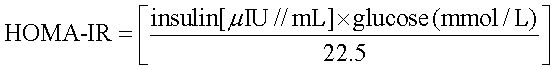
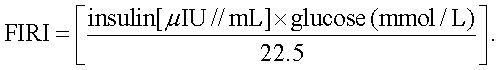
We also calculated HSI, FLI and FIB-4 indexes according to formulas (Figure 1).

HSI and FLI< 30.0 ruled out while HSI ≥ 36.0 and FLI ≥ 60.0 ruled in hepatic steatosis detected by AU. FIB-4 score < 1.45 had a negative predictive value of 90% for advanced fibrosis, whereas FIB-4 > 3.25 would have a 97% specifity and a positive predictive value of 65% for advanced fibrosis.
Based on the IDF/NHLBI/AHA-2009 criteria of MS, on results of liver biopsy, abdominal ultrasonography supported by calculation of HSI and FLI indexes as well as on BMI value, we finally selected and divided 73 patients into 3 groups:
- •
Group I. Prediabetic, obese subjects with NAFLD and MS (meeting all IDF/NHLBI/AHA-2009 criteria) (n = 28).
- •
Group II. Lean patients with NAFLD but without MS (two of the five IDF/NHLBI/AHA-2009 criteria) (n = 23).
- •
Group III. Obese subjects without NAFLD and MS (one IDF/NHLBI/AHA-2009 criterion) (n = 22).
Healthy individuals served as control group (IV) (n = 22). The control group included healthy individuals without any signs or symptoms of illness, with normal routine laboratory tests including normal levels of liver enzymes and with no evidence of fatty liver at their abdominal ultrasonography.
Chemerin, RBP-4, transgelin-2 and CK-18 measurementsSerum levels of chemerin, RBP-4, transgelin-2 and CK-18 fragments were measured by ELISA method: chemerin (Millipore, sensitivity 0.5 ng/mL), RBP-4 (R&D System, sensitivity 0.224 ng/mL), CK-18 (Cloud-Clone Corp., sensitivity 13.6 pg/mL), and transgelin-2 (Cloud-Clone Corp., sensitivity 0.055 ng/mL).
Statistical analysisNormality of variables was tested with the Kol-mogorov-Smirnov test. Normally distributed continuous variables were expressed as mean ± SD, and categorical variables were summarized as median with interquartile range. Quantitative variables with normal distribution were analyzed with one-way or two-way ANOVA with Tukey HSD as a post-hoc test. Comparisons between groups with categorical variables were evaluated by Kruskal-Wallis followed by Dunn test. Correlation analyses between continuous or categorical variables were performed by Pearson’s or Spearman’s, respectively. Data were analyzed by using STATISTICA software version 7.1 (StatSoft. Inc., Tulsa, OK, USA) and p value ≤ 0.05 was considered statistically significant.
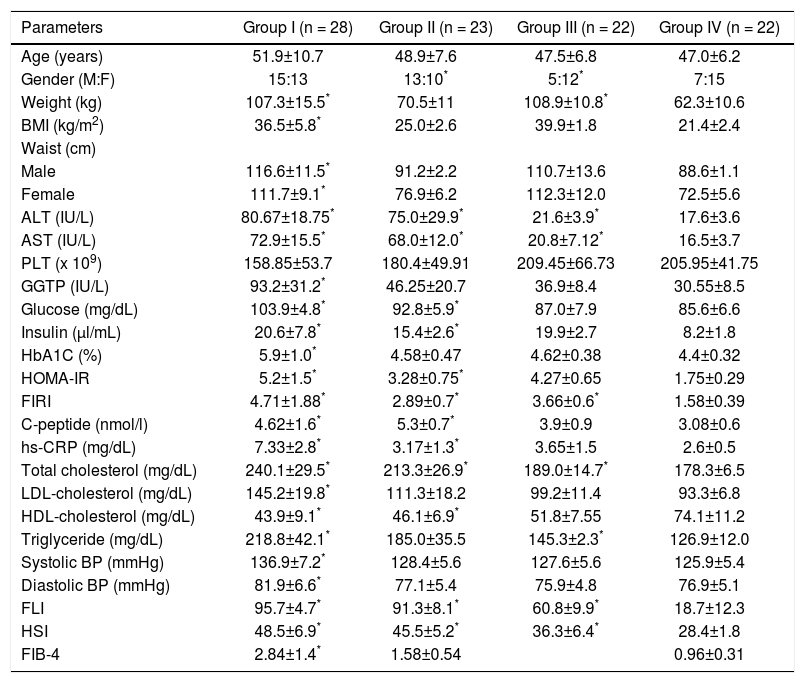
ResultsTable 1 shows clinical and laboratory data of all studied groups. Group I included patients with diagnosed NAFLD and BMI ≥ 30 kg/m2. Moreover, patients from this group met all IDF/NHLBI/AHA-2009 criteria of MS. Prediabetes was identified based on high serum glucose and HbA1C levels. NAFLD obese individuals (group I) were characterized by significantly the highest levels of hs-CRP (7.33 ± 2.8 mg/dL), fasting glucose (103.9 ± 3.8 mg/dL), HbA1C [5.71(5.2-6.4)%], LDL-cholesterol (145.2 ± 19.8 mg/dL), both systolic and diastolic blood pressure [with 136.9 ± 7.2 and 84.0 (79.5-88.1) mmHg respectively]. The participants from group II were also classified as NAFLD; however, they met only two of the five IDF/NHLBI/AHA-2009 criteria (HDL-cholesterol and triglyceride concentrations). Participants of that group in comparison to the controls had significantly higher levels of ALT (75.0 ± 29.9 IU/L), AST (68.0 ± 12.0 IU/L), total cholesterol (213.3 ± 26.9 mg/dL), hs-CRP (3.17 ± 1.3 mg/dL), fasting glucose (92.8 ± 5.9 mg/dL), insulin (15.4 ± 2.6 ul/mL) and HOMA-IR (3.28 ± 0.75). The participants of group III met only one MS criterion - waist circumference ≥ 94 cm in men and ≥ 80 cm in women. They were characterized by significantly higher levels of ALT (21.6 ± 3.9 IU/L), AST (20.8 ± 7.12 IU/L), FIRI (3.66 ± 0.6 mg/dL), total cholesterol (189.0 ± 14.7 mg/dL) and triglyceride (145.3 ± 2.3 mg/dL) compared to healthy volunteers. The mean age was similar in all groups, however, the groups I and II were dominated by males, 54% and 56% respectively, while III and IV - by women, 77% and 68% respectively.
Baseline clinical, anthropometric, and biochemical characteristics of the study populations. Group I - prediabetic, obese NAFLD with MS. Group II - lean NAFLD without MS. Group III - obese without MS. Group IV - healthy individuals. Data are expresses as means ± SD (normally distributed continuous variables) or as medians with interquartile ranges (categorical variables).
| Parameters | Group I (n = 28) | Group II (n = 23) | Group III (n = 22) | Group IV (n = 22) |
|---|---|---|---|---|
| Age (years) | 51.9±10.7 | 48.9±7.6 | 47.5±6.8 | 47.0±6.2 |
| Gender (M:F) | 15:13 | 13:10* | 5:12* | 7:15 |
| Weight (kg) | 107.3±15.5* | 70.5±11 | 108.9±10.8* | 62.3±10.6 |
| BMI (kg/m2) | 36.5±5.8* | 25.0±2.6 | 39.9±1.8 | 21.4±2.4 |
| Waist (cm) | ||||
| Male | 116.6±11.5* | 91.2±2.2 | 110.7±13.6 | 88.6±1.1 |
| Female | 111.7±9.1* | 76.9±6.2 | 112.3±12.0 | 72.5±5.6 |
| ALT (IU/L) | 80.67±18.75* | 75.0±29.9* | 21.6±3.9* | 17.6±3.6 |
| AST (IU/L) | 72.9±15.5* | 68.0±12.0* | 20.8±7.12* | 16.5±3.7 |
| PLT (x 109) | 158.85±53.7 | 180.4±49.91 | 209.45±66.73 | 205.95±41.75 |
| GGTP (IU/L) | 93.2±31.2* | 46.25±20.7 | 36.9±8.4 | 30.55±8.5 |
| Glucose (mg/dL) | 103.9±4.8* | 92.8±5.9* | 87.0±7.9 | 85.6±6.6 |
| Insulin (μl/mL) | 20.6±7.8* | 15.4±2.6* | 19.9±2.7 | 8.2±1.8 |
| HbA1C (%) | 5.9±1.0* | 4.58±0.47 | 4.62±0.38 | 4.4±0.32 |
| HOMA-IR | 5.2±1.5* | 3.28±0.75* | 4.27±0.65 | 1.75±0.29 |
| FIRI | 4.71±1.88* | 2.89±0.7* | 3.66±0.6* | 1.58±0.39 |
| C-peptide (nmol/l) | 4.62±1.6* | 5.3±0.7* | 3.9±0.9 | 3.08±0.6 |
| hs-CRP (mg/dL) | 7.33±2.8* | 3.17±1.3* | 3.65±1.5 | 2.6±0.5 |
| Total cholesterol (mg/dL) | 240.1±29.5* | 213.3±26.9* | 189.0±14.7* | 178.3±6.5 |
| LDL-cholesterol (mg/dL) | 145.2±19.8* | 111.3±18.2 | 99.2±11.4 | 93.3±6.8 |
| HDL-cholesterol (mg/dL) | 43.9±9.1* | 46.1±6.9* | 51.8±7.55 | 74.1±11.2 |
| Triglyceride (mg/dL) | 218.8±42.1* | 185.0±35.5 | 145.3±2.3* | 126.9±12.0 |
| Systolic BP (mmHg) | 136.9±7.2* | 128.4±5.6 | 127.6±5.6 | 125.9±5.4 |
| Diastolic BP (mmHg) | 81.9±6.6* | 77.1±5.4 | 75.9±4.8 | 76.9±5.1 |
| FLI | 95.7±4.7* | 91.3±8.1* | 60.8±9.9* | 18.7±12.3 |
| HSI | 48.5±6.9* | 45.5±5.2* | 36.3±6.4* | 28.4±1.8 |
| FIB-4 | 2.84±1.4* | 1.58±0.54 | 0.96±0.31 |
Statistically significant at p < 0.005 in comparison to group IV (control). BMI: body mass index. ALT: alanine aminotransferase. AST: aspartate aminotransferase. PLT: platelet count. GGTP: gamma-glutamyl transpeptidase. HbA1C: glycated hemoglobin. HOMA-IR: homeostatic model assessment. FIRI: insulin resistance index. hs-CRP: high-sensitivity C-reactive protein. LDL: low-density lipoprotein. HDL: high-density lipoprotein. Systolic BP: systolic blood pressure. Diastolic BP: blood pressure. FLI: fatty liver index. HIS: hepatic steatosis index. FIB4: fibrosis-4 index.
Detailed clinical, anthropometric and biochemical characteristics of study population were presented in previous study.31
Serum level of chemerin was the highest in the I group but it was also high in group III indicating the influence of obesity on chemerin level. However, totally the liver disease (NAFLD) also correlated with increased level of chemerin (Figure 2). The similar relationships were seen in terms of serum RBP-4 level. Both, obese subjects with MS and obese individuals without MS, had high level of this adipokine in the serum, which strongly indicates the influence of obesity on the production of this adipokine, too. In contrast to the above, CK-18 level as a marker of apoptotic death of hepatocytes, was the highest in group I and II, probably because of the severity of liver illness complicated by MS. Transgelin-2 seems to be another marker of liver disease severity. Its level in patients from group I who had symptoms of liver fibrosis (HSI and FLI), was significantly different in comparison to the remaining 3 groups. However, this difference was the most significant when comparing group I with group III and IV (Figure 2). It seems likely that evaluation of transgelin-2 level could be useful in detection of early fibrosis thus allowing to avoid liver biopsy. Moreover, in our study, transgelin-2 level was slightly connected with MS, indicating the influence of lipid metabolism on liver fibrosis. There were positive correlations between FIB4 and transgelin-2 levels in group I (r — 0,64; p ≤ 0,001) but not in the remaining groups. No significant relation between FIB-4 and CK-18 was found in any of the examined groups of (p > 0.2).
Discussion, RBP-4 (B), CK-18 (C) and transgelin2 (D). A comparison of statistical significance between groups (analysis of variance by Kruskall-Wallis method with Dunn’s test for statistical significance.")
In our experiments we detected that serum level of chemerin is strongly associated with obesity in NAFLD patients and partially with MS. This observation is in agreement with large publication presenting meta-analysis association between serum chemerin and obesity and MS. The authors of this study found that chemerin may be associated with obesity but also connected with imbalances in lipid and glucose metabolism and with IR.17 Other authors indicated chemerin as a marker of MS16 and obesity.32 Some studies showed a significant increase of chemerin level in NAFLD patients with metformin treatment improving the course of NAFLD and decreasing the level of chemerin. Chemerin, TG, and ALT were independent variables associated with NAFLD.33 Such discrepancies can be caused by taking account of results from different groups of patients. Therefore, to avoid the influence of both obesity and MS on the results, we separated obese from lean patients and also took into consideration the presence or absence of MS in obese individuals thus creating 4 different groups of patients. The level of chemerin was the highest with statistical significance in obese patients with MS. Obese patients without MS also had elevated level of chemerin in sera but it was not significantly different from lean patients without MS. Therefore we can state that in patients with NAFLD, it is MS as a first factor and obesity as an additional factor which are involved in overproduction of chemerin. Importantly, the hepatic chemerin expression was positively and independently associated with hepatic steatosis, lobular inflammation, ballooning and fibrosis in one study.34 In summary, data on chemerin in human NAFLD are controversial; it seems that circulating chemer-in levels do not accurately reflect the hepatic or adipose tissue expression, implying that a potential role of chemerin in the pathogenesis of NAFLD could not be estimated by its circulating levels.35
RBP-4 serum level was significantly increased in group I and III, thus in obese subjects who did not fulfill MS criteria. In the world literature there are studies which indicate the role of this adipokine in the development of NAFLD, obesity and IR.7–9,36,37 However, other papers question RBP-4 role,12 or even deny any correlations between RBP-4 production, NAFLD, BMI or IR.11 It should be indicated that in our work the levels of RBP-4 in sera were low but significantly connected with obesity in NAFLD patients.
Liver biopsy is the only reliable way of diagnosis and staging NAFLD, especially NASH, but its invasive nature limits its use. Plasma caspase-generated cytokeratine-18 fragment (CK-18) has been proposed as a non-invasive alternative and highly specific for NAFLD, especially when combined with other markers.19,38,39 In our work CK-18 serum fragments were the highest in group I (obese with MS) and group II (lean without MS) but not in “healthy” obese group and seemed to be connected with the severity of liver illness. Therefore measurement of serum level of CK-18 may be an useful marker of NAFLD severity.
Transgelin-2 is an actin stress fiber-associated protein, which is produced in activated pancreatic stellate cells and modulates their function in fibrosis18 but is also a marker in human liver cirrhosis.39 In our study we detected high levels of transgelin-2 in sera of patients with NAFLD, obesity and MS. Therefore, we cannot rule out the possibility that those patients may have the same symptoms of liver fibrosis, especially that they have high level of CK-18 in serum. In our study, similarly to other authors, we found the correlation between the level of transgelin-2 and FIB-4 - the latter a non-invasive marker of fibrosis. In other studies, FIB-4 index24 was strongly correlated to the FibroTest results and biopsy. FIB-4 index is a simple, accurate, and inexpensive method for assessing liver fibrosis and is proved to be concordant with FibroTest result. Therefore, patients with FIB-4 values < 1.45 or > 3.25 and high level of transgelin-2 could avoid liver biopsy.21,23,40
In conclusion, we detected high levels of adipokines -chemerin and RBP-4 - in sera of patients with NAFLD, which seems to be connected with obesity. Chemerin level was also connected with MS but first of all it was characteristic for all patients with NAFLD. Moreover, we found that high levels of CK-18 fragments and transgelin-2 were not related to obesity and MS. Serum level of transgelin-2 could be rather a useful marker of advanced NAFLD, especially in the case of NAFLD concomitant with fibrotic changes in the liver. Thus, in certain cases, the evaluation of serum transgelin-2 level could permit to avoid invasive diagnostic procedures (liver biopsy). This conclusions are in agreement with proteomic studies which indicate the importance of novel biomarkers such as RBP-4 and transgelin-2, which have a significant role in NAFLD development.41
Abbreviations- •
ALT: alanine aminotransferase.
- •
AST: aspartate aminotransferase.
- •
BMI: body mass index.
- •
CK-18: cytokeratin-18.
- •
FIB4: fibrosis-4 index.
- •
FIRI: insulin resistance index.
- •
FLI: fatty liver index.
- •
HbA1C: glycated hemoglobin.
- •
HOMA-IR: homeostatic model assessment.
- •
HSI: hepatic steatosis index.
- •
IL-6: Interleukin 6.
- •
IR: insulin resistance.
- •
MS: metabolic syndrome.
- •
NAFLD: nonalcoholic fatty liver disease.
- •
NASH: nonalcoholic steatohepatitis.
- •
RBP-4: retinol binding protein-4.
- •
T2DM: type 2 diabetes mellitus.
- •
TNF-α: tumor necrosis factor α.
This study was supported by the Medical University in Lublin Seed Funding program for Basic Research (No DS 506/2014) to J. Daniluk.
Conflicts of InterestAll authors declare no conflicts of interest.


