


Intake of a high-carbohydrate, low-protein diet (HCD/LPD) during pregnancy promotes metabolic disturbances. It has been suggested that liver function during pregnancy contributes to the synthesis of proteins necessary for fetal development during this stage. The liver is a site of response to the synthesis of macronutrients such as proteins. However, it is unknown how HCD/LPD is associated with modifications to the amino acid profiles and hepatic alterations in the maternal environment during pregnancy.
Materials and methodsA transverse longitudinal study was done in primiparous mothers during gestation (G) (G1 day 1, G5 day 5, G15 day 15, and G20 day 20). Histological analysis was used to assess hepatic alterations, and amino acid profiles in the liver were analyzed with high performance liquid chromatography (HPLC). Food and water intake was quantified, and peripheral biochemical indicators in serum were measured.
ResultsMothers with HCD/LPD had increased micro and macro vesicles of fat, necrosis, and inflammation in the liver on G5. The total concentration of hepatic amino acids increased by 40% on G1, 17% on G5, and 25% on G15; and, there was a 12% decrease on G20. The following increases were observed in the liver on G1: arginine 68%, histidine 75%, alanine 18%, methionine 71%, and phenylalanine 51% (p>0.05); on G5: arginine 12%, methionine 34%, and phenylalanine 83% (p>0.05); on G15: arginine and phenylalanine 66%, tryptophan 81% and histidine 60.4% (p>0.05); and on G20: arginine 32% (p>0.05). No weight loss, changes in food consumption, or hepatomegaly occurred.
ConclusionsHCD/LPD during pregnancy in primiparous mothers may promote development of fat vesicles. Possibly, this condition causes metabolic adaptations and nitrogen management reflected in decreased levels of serum urea and altered amino acid profiles in the liver.
Different nourishment protocols have been aimed at testing biochemical responses in a variety of physiological conditions such as pregnancy [1,2]. Pregnancy is a biological state in which rat dams are confronted with a metabolic challenge: to sustain their own vital functions and simultaneously channel nutrients to promote the development and growth of the brood [3,4]. Most reports regarding experimental variables during pregnancy are focused on the responses and alterations of the newborns; however, limited information has been published about the metabolic adaptations that take place in the mothers [5,6]; HCD/LPD has been used to mimic a prevalent social circumstance in industrialized countries where people are forced to consume a low quality diet for educational or economic reasons [13]. Experimentally, HCD/LPD has been applied to gain a better understanding of branched-chain amino acid (BCAA) supplementation, which affects muscle protein synthesis; in addition to understanding the hypoproteic diets consumed during pregnancy, which have adverse metabolic effects on lipid metabolism and development of hepatic steatosis in offspring, in adult life [7,8], but only some examples exist regarding the maternal adaptations to such a diet [9–12]. The liver is an important organ for handling nitrogen compounds. It is the principal site of urea production and is also important for the generation of glutamine, polyamines, and for the interconversion of sulfur-aminoacids [14]. In addition, the liver is the major producer of albumin, blood clotting factors, and a variety of peptide hormones [15].
The effect of HCD/LPD on the hepatic metabolism during pregnancy is unknown. The liver is a site of response to the synthesis of macronutrients such as proteins, and it has been suggested that liver function during pregnancy contributes to the synthesis of proteins necessary for fetal development; however, there is little evidence about protein restriction in the maternal environment. Therefore, the objective of this research was to evaluate the concentration of amino acids and alterations in the liver of pregnant mothers rats upon intake of an isocaloric HCD/LPD.
It has been observed that protein restriction in pregnant mothers alters the metabolism of fatty acids and modifies the accumulation of docosahexaenoic acid (DHA) in the fetal brain. It has been suggested that a lower intake of protein reduces DHA from the mother to the fetus, which may impair the development and function of the fetal brain. However, the amino acid profiles in the liver resulting from isocaloric diets during pregnancy has not been evaluated; thus, we aimed to understand the biochemical adaptations that occur in the liver with regards to the presence of free amino acids at various stages of pregnancy in primiparous mothers; as well as the amino acid profiles within the liver. Pregnancy is an important factor rheostasis for physiological and diet changes. We have hypothesis that amino acids play an important role in adapting to both a hypoproteic diet and to pregnancy itself. Results showed higher concentrations of amino acids in the liver of primiparous mothers with HCD/LPD during pregnancy, and increased micro and macro vesicles of fat, necrosis, and inflammation in the liver on day G5. Interestingly, we also detected by histological observation a clear increase in fat deposits in the liver, but without an evident dysregulation in liver function.
2Materials and methods2.1AnimalsWe used 68 female Wistar rats from 10 to 12 weeks of age, each weighing 250–300g, and we divided them randomly into 4 groups: Group 1. Control Nulliparous (not pregnant), n=16; Group 2. Control Primiparous, n=10 in longitudinal study and n=16 in cross-sectional study; Group 3. Primiparous Experimental (HCD/LPD), n=10 in longitudinal study and n=16 in cross-sectional study (Fig. 1). The animals used in this experiment where held in 12-h light/dark cycle, lights on at 7:00 am with ventilation, in suitable and clean cages. The procedures were carried out in accordance with Official Mexican Standard NOM-062-ZOO-1999, which provides guidelines and techniques for the reproduction, care, and use of laboratory animals. This study was reviewed and authorized by the research committee of Centro Universitario del Sur at Universidad de Guadalajara, with registration SA/CIP/053/2017-2014.
2.2Materials
Each female rat was kept alone in a transparent acrylic cage (21cm×23.5cm×38cm) with free access to water and food unless stated otherwise. The bottom of the cage was covered with sawdust that was replaced every day.
2.3Diet, food intake, and body weightThe control diet was Rodent Laboratory Chow 5001 Purina (58.3% carbohydrate, 5.7% fat, 23.9% protein). The experimental HCD/LPD diet was AIN-93W Test Diet (77.3% carbohydrate, 7.1% fat, 6% protein). Both diets are isocaloric.
All groups were exposed to their corresponding diets ad libitum during the entire experimental protocol. Food intake was recorded twice daily (07:00h and 19:00h), and the body weight of each animal subject was registered every 24h. On days G1, G5, G15 and G20, rats were decapitated to obtain blood samples, and the liver was dissected, weighed, and cut into slices for biochemical and histological processing.
All rats were given purified water ad libitum. In addition to peripheral markers, body fat and tissues (liver and blood) were extracted. Blood was collected in Eppendorf tubes, followed by centrifugation at 400g for 10min to obtain serum. Serum was stored at −20°C until analysis. Dissected livers were obtained and their weight was registered.
2.4Study design and procedureThe methodological procedure involved a longitudinal and a cross-sectional study. Vaginal smears were taken to identify the stage of proestrus-estrus. G1 was identified by the presence of a vaginal button. Throughout the rest of the experiment the female rats remained in individual cages. Once the adaptation period was over, during the next 20–22 days of gestation quantities of food and water, and body weight, were measured with a precision scale (A&D Weighing series GF-3000 scale).
2.5Histological analysisOnce livers were dissected and weighed, the organs were fixed with 4% formaldehyde to apply the hematoxylin eosin technique for histological analysis. Briefly, livers were embedded in paraffin and slices were made with a rotation microtome (Leica DSC1). Liver slices were placed on slides for histological staining: Paraffin sections were deparaffinized in xylol and rehydrated in ethanol in decreasing concentrations, then immersed in distilled water for 3min; the staining process took 10min, and dehydration in ethanol took place in increasing concentrations. The final clearing stage was performed with xylol. In order to determine hepatic morphologic changes, histological characteristics were analyzed, and the number of micro and macrovesicles of fat, as well as necrosis and degrees of inflammation, were evaluated as described by [16].
2.6Biochemical determinations in serum2.6.1InsulinEnzyme-linked immunosorbent assay (ELISA) kits for insulin (MexLab group CAT. 6001011, Mex Lab, ELISA, Mexico D.F.) were used in the study.
2.6.2CorticosteroneEnzyme-linked immunosorbent assay (ELISA) kits for corticosterone (Enzo ADI-900-097, Enzo Life Sciences, Plymouth meeting, PA, USA) were used in the study. Each serum sample was analyzed according to the manufacturer's instructions, with a detection level (range 32–20,000pg/ml) and sensitivity of 27.0pg/ml.
2.6.3Determination of liver enzymesGlutamic–pyruvic transaminase (ALT) and glutamate-oxaloacetate transaminase (AST) assays were determined using methods of [17]. ALT and AST activity was measured in serum with the colorimetric enzymatic method and spectrophotometry. These transaminases were used as markers of hepatic damage.
2.6.4Levels of urea and creatinine in serumTo determine urea and creatinine concentrations, the spectrophotometric method was used. Urea in the sample was hydrolyzed enzymatically into ammonia (NH4) and carbon dioxide (CO2). The creatinine test is based on the creatinine reaction with alkaline picrate to form a complex. The intensity of the color formed is proportional, at 505nm, to the concentration of creatinine [18].
2.6.5Determination of serum levels of triacylglycerides, glucose, total cholesterol, and high and low density lipoproteinsTo determine the values of glucose, the lipid profile, cholesterol, triacylglycerides, and high and low-density lipoproteins in serum, the following commercial kits from Spinreact, Santa Coloma, Spain, were used: Glucose-LQ Ref: 41010, Cholesterol-LQ Ref: 41020; Triacylglycerides-LQ Ref: 41030; high and low-density lipoproteins Ref: 1001096 and Ref: 4102.
2.6.6Sample preparation for HPLC amino acid analysisBefore measuring the concentrations of amino acids in liver, 0.2g were homogenized with perchloric acid (1:5, w/v) in a sonicator (QS-Q55, Biogen) for 20min. All samples were centrifuged at 12,000g for 5min at 4°C (Labnet, model C2500-R). The supernatant was used for HPLC measurement after filtration with a 0.22μM Millipore. Maternal plasma was passed through a 0.22μM Millipore filter before injection.
2.6.7HPLC analysis of amino acidsMaternal plasma or liver homogenates (0.5μL) were analyzed in a Zorbax Eclipse AAA 4.6×150mm, 5-μm column (Agilent Technologies, Palo Alto, California), after precolumn derivatization using o-phthalaldehyde (OPA) for primary amino acids and 9-fluorenylmethyl chloroformate (FMOC) for secondary amino acids in an Agilent 1200 HPLC (Agilent Technologies, Palo Alto, California). The mobile phases were A: 40mmol/l Na2HPO4, pH 7.8; and B: Acetonitrile:methanol:water (45:45:10, v/v/v). The gradient was set as follows: 0–1.9min, 0% B; 18.1min, 57% B; 18.6min, 100% B; 22.3min, 100% B; 23.2min, 0% B; 26min, 0% B. Flow was 2ml/min. The primary amino acids (OPA-derivatized) were monitored at 338nm, while the secondary amino acids (FMOC-derivatized) were monitored at 262nm. Amino acid standard (10pmol/μL to 1nmol/μL) calibration curves were used. All experiments were done in triplicate.
2.7Statistical analysisStatistical analyses were carried out using SPSS software (version 19), and a value of p<0.05 was considered statistically significant. To prove the normality of the chemical variables, the Kolmogorov–Smirnov test was used (p>0.05). To compare the Control Diet Group with the HCD/LPD Group, a Student's t-test was used, mediated by the Levene test.
3Results3.1Food and water intakeControl and HCD/LPD Groups were compared (Fig. 2). Only a 20% increase in caloric intake on day G10 in the HCD/LPD Group was observed, while in grams of food intake no differences were observed. When analyzing the daily macronutrient intake in the HCD/LPD Group, an increase of 20–33% was observed in the intake of carbohydrates, a 9–10% increase in lipids, and an 80–85% decrease in protein consumption (Fig. 2e–g). This representation allows us to check the composition of macronutrients in the HCD/LPD diet vs the control diet.
 Food intake, (c) water intake, (d) maternal weight, (e) carbohydrate intake, (f) lipid intake, (g) protein intake, during gestation (G1, G5, G15, G20). Data shown are mean=SEM. *p<0.05.")
In the HCD/LPD Group we observed decreases of 34, 36, 36, 27, 37, 24, 33, and 28% on days G1, G4, G6, G9, G15, G16, G18, and G19, respectively; therefore, on average, a 30% decrease in water intake was observed (Fig. 2c). There were no significant differences in body weight (Fig. 2d). Nonetheless, with the limitation in dietary protein content, the Experimental Group did not lose weight, possibly due to the increase in body fat.
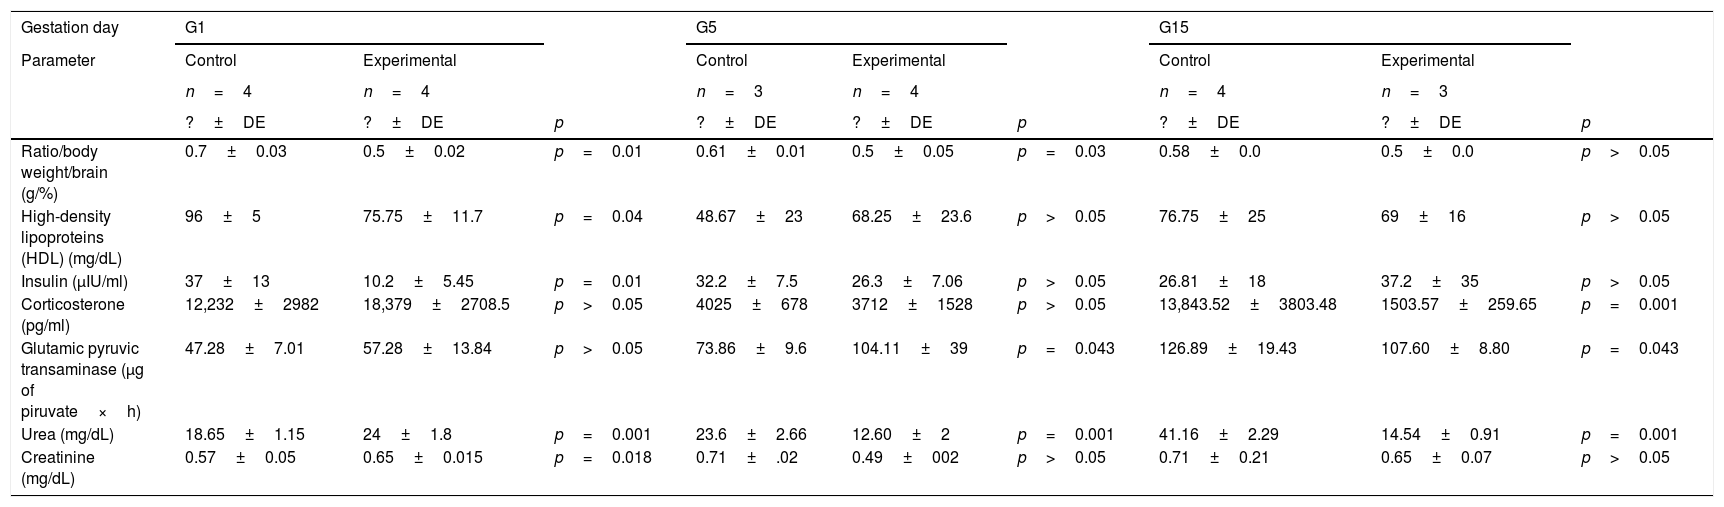
Levels of circulating triacylglycerides, glucose, cholesterol, LDL, HDL, insulin, and corticosterone in the HCD/LPD and Control Groups are shown in Table 1. On G1, a 20% decrease in HDL concentration (p=0.04) and 72% decrease of insulin (p=0.01) was observed in the HCD/LPD Group. In the intra-group analysis, a 19% increase in serum of triacylglycerides, when comparing G5 with G15 (p=0.006), and a 15% decrease in LDL concentrations, when comparing G5 with G15 were observed.
Biochemical marker in serum.
| Gestation day | G1 | G5 | G15 | ||||||
|---|---|---|---|---|---|---|---|---|---|
| Parameter | Control | Experimental | Control | Experimental | Control | Experimental | |||
| n=4 | n=4 | n=3 | n=4 | n=4 | n=3 | ||||
| ?±DE | ?±DE | p | ?±DE | ?±DE | p | ?±DE | ?±DE | p | |
| Ratio/body weight/brain (g/%) | 0.7±0.03 | 0.5±0.02 | p=0.01 | 0.61±0.01 | 0.5±0.05 | p=0.03 | 0.58±0.0 | 0.5±0.0 | p>0.05 |
| High-density lipoproteins (HDL) (mg/dL) | 96±5 | 75.75±11.7 | p=0.04 | 48.67±23 | 68.25±23.6 | p>0.05 | 76.75±25 | 69±16 | p>0.05 |
| Insulin (μIU/ml) | 37±13 | 10.2±5.45 | p=0.01 | 32.2±7.5 | 26.3±7.06 | p>0.05 | 26.81±18 | 37.2±35 | p>0.05 |
| Corticosterone (pg/ml) | 12,232±2982 | 18,379±2708.5 | p>0.05 | 4025±678 | 3712±1528 | p>0.05 | 13,843.52±3803.48 | 1503.57±259.65 | p=0.001 |
| Glutamic pyruvic transaminase (μg of piruvate×h) | 47.28±7.01 | 57.28±13.84 | p>0.05 | 73.86±9.6 | 104.11±39 | p=0.043 | 126.89±19.43 | 107.60±8.80 | p=0.043 |
| Urea (mg/dL) | 18.65±1.15 | 24±1.8 | p=0.001 | 23.6±2.66 | 12.60±2 | p=0.001 | 41.16±2.29 | 14.54±0.91 | p=0.001 |
| Creatinine (mg/dL) | 0.57±0.05 | 0.65±0.015 | p=0.018 | 0.71±.02 | 0.49±002 | p>0.05 | 0.71±0.21 | 0.65±0.07 | p>0.05 |
The insulin concentration decreased by 37% in the HCD/LPD Group on G1. The corticosterone concentration decreased by 92% on G15 Table 1.
Statistically significant differences of the following variables were not observed when comparing the control group with the experimental group: body weight, 246±11.9 vs 279±29.2g on G1, 29±10.7 vs 313±28.2g on G5 and 321±26 vs 316.67±14g on G15; liver and brain weight, 8.2±0.3 vs 9.9±0.70g on G1; 11.9±1 vs 13.0±1.77g on G5; 13.2±1.5 vs 11.7±1.7g on G15; and 1.82±0.02 vs 1.62±0.02g on G1; 1.83±0.01 vs 1.855±0.04g on G5; 1.87±0.0 vs 1.7767±0.0g on G20, respectively. In ratio body and liver weight, 3.3±0.5 vs 3±0.05g/% in G1, 4.0±0.3 vs 4±0.31g/% in G5 and 4.1±0.1 vs 3.7±0.3 in G15g/%; glucose, 132±11 vs 126.7±13.3mg/dL in G1, 132±14 vs 129.25±17.2mg/dL in G5 and 107.5±7.5 vs 120±20mg/dL in G15; triacylglycerides, 25.33±15 vs 60.5±36.5mg/dL on G1, 25.67±9.2 vs 54.25±18.0mg/dL on G5 and 67.5±50 vs 67.33±12mg/dL on G15; Cholesterol, 97.33±6 vs 47±32.7mg/dL on G1, 59±55 vs 90.25±61.6mg/dL on G5 and 59.75±28 vs 61.67±10mg/dL on G15; low density lipoprotein, 10±1 vs 11.75±1.70mg/dL on G1, 8±2.6 vs 12.5±2.38mg/dL on G5 and 17.5±22 vs 10.67±2mg/dL on G15; glutamate-oxaloacetate transaminase transaminase, 28±3 vs 37.52±8.02μg piruvate×h, in G1, 42.82±2.9 vs 32.11±2.9μg piruvate×h, in G5 and 70.76±15.37vs 42.79±3.38μg de piruvate×h, in G15. At 20G the samples were not completed, so it was not possible to perform the corresponding statistics, which is why the results of the analysis of the biochemical markers of day G20 were not integrated.
3.2Hepatic histologyResults showed a significant increase in micro and macro vesicles of fat, necrosis, and inflammation, as well as sinusoidal dilatation in the low-protein diet group on days G5 and G15. This means that liver fat and necrotic death are not generalized but rather episodic (Fig. 3).
 and HCD/LPD Primiparous Group (H/LPG) on (G1, G5, G15, G20), p value of <0.05 was considered statistically significant.")
Histologic liver injury scores. The mean values for each study group regarding the presence of gescles of fat, macrovesicles of fat, necrosis, and inflammation were: Control Primiparous Group (CPG) and HCD/LPD Primiparous Group (H/LPG) on (G1, G5, G15, G20), p value of <0.05 was considered statistically significant.
In the HCD/LPD Group, serum concentrations of the ALT enzyme increased by 14% on G5 and 11% on G15, whereas urea concentration increased by 13% on G1, and decreased by 19% on G5 and 29% on G15. Creatinine concentration increased by 11% on G1 (Table 1).
In the HCD/LPD Group there was increased activity of ALT on G5, a higher concentration of urea and creatinine on G1, and corticosterone levels increased on G15 (Table 1).
3.4Liver amino acid concentrationIn the HCD/LPD Group, the total concentration of hepatic amino acids increased by 40% on G1, 17% on G5, and 25% on G15, and decreased by 12% on G20, compared to the Control Group Fig. 4.

A 22% increase was observed in the concentration of non-essential amino acids in the liver in HCD/LPD Group on G1 (p=0.0005), and a 16% increase on G5 (p=0.0001), and a 20% decrease on G20 (p=0.0001). Regarding the concentration of essential amino acids in the liver, a 33% increase was observed on G1 (p=0.0005), a 20% increase on G5 (p=0.001), a 25% increase on G15 (p=0.001), and a 12% decrease on G20 (p=0.001) in the HCD/LPD Group compared to the Control Group. The concentration of branched-chain amino acids increased by 14% on G1 (p=0.0005) and decreased by 2% on G15 and 1.3% on G20 (p=0.001) compared to the Control Primiparous Group (Fig. 5).
, branched-chain amino acids (BCAA), and essential amino acids (EAA) in liver in mothers with high-carbohydrate and control diet during pregnancy. The values correspond to normalization of the concentration of amino acids that were significantly modified. *p<0.05.")
Concentration of non-essential amino acids (NEAA), branched-chain amino acids (BCAA), and essential amino acids (EAA) in liver in mothers with high-carbohydrate and control diet during pregnancy. The values correspond to normalization of the concentration of amino acids that were significantly modified. *p<0.05.
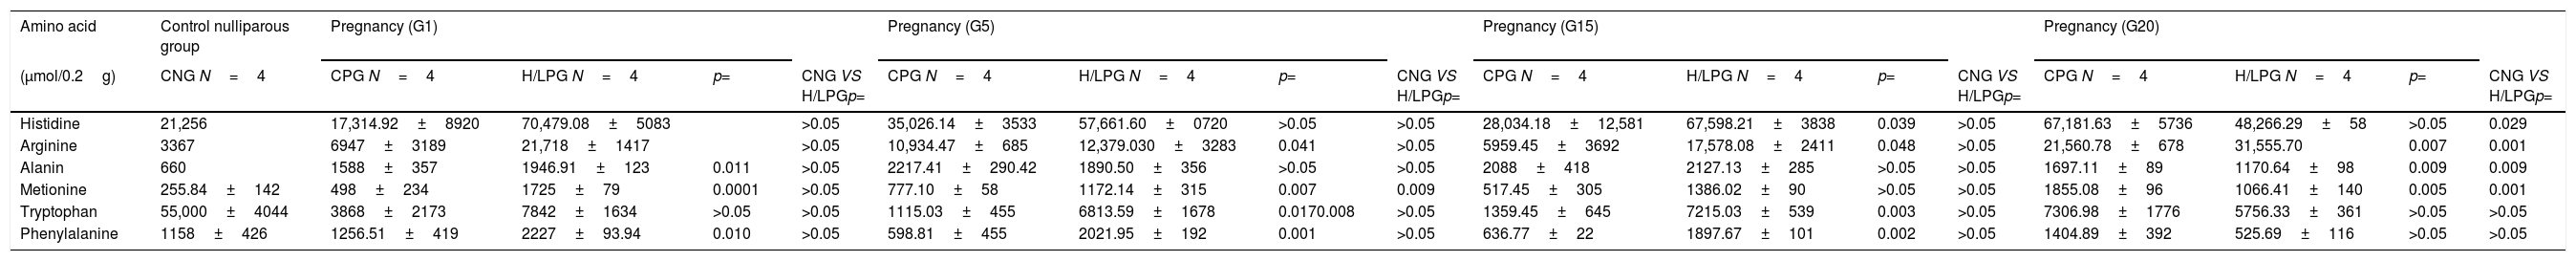
When comparing the livers of mothers in the HCD/LPD Group with those of the Control Group, increases were detected on G1 in arginine (68%), histidine (75%), alanine (18%), methionine (71%), and phenylalanine (51%); on G5 in arginine (12%), methionine (34%), and tryptophan (83%); on G15, in arginine (66%), phenylalanine (66%), and tryptophan (81%); and on G20, an increase was observed in arginine (32%) and a decrease in alanine (31%) and methionine (74%) (Fig. 6). In the intra-group comparisons, the HCD/LPD Primiparous Group presented a 7% increase in glutamate when comparing G1 with G5; a 31% increase in arginine when comparing G1 with G20; and a 76% decrease in phenylalanine throughout the gestational period (G1-G20) (Table 3 and Fig. 6).

Amino acid in liver during pregnancy.
| Amino acid | Control nulliparous group | Pregnancy (G1) | Pregnancy (G5) | Pregnancy (G15) | Pregnancy (G20) | ||||||||||||
|---|---|---|---|---|---|---|---|---|---|---|---|---|---|---|---|---|---|
| (μmol/0.2g) | CNG N=4 | CPG N=4 | H/LPG N=4 | p= | CNG VS H/LPGp= | CPG N=4 | H/LPG N=4 | p= | CNG VS H/LPGp= | CPG N=4 | H/LPG N=4 | p= | CNG VS H/LPGp= | CPG N=4 | H/LPG N=4 | p= | CNG VS H/LPGp= |
| Histidine | 21,256 | 17,314.92±8920 | 70,479.08±5083 | >0.05 | 35,026.14±3533 | 57,661.60±0720 | >0.05 | >0.05 | 28,034.18±12,581 | 67,598.21±3838 | 0.039 | >0.05 | 67,181.63±5736 | 48,266.29±58 | >0.05 | 0.029 | |
| Arginine | 3367 | 6947±3189 | 21,718±1417 | >0.05 | 10,934.47±685 | 12,379.030±3283 | 0.041 | >0.05 | 5959.45±3692 | 17,578.08±2411 | 0.048 | >0.05 | 21,560.78±678 | 31,555.70 | 0.007 | 0.001 | |
| Alanin | 660 | 1588±357 | 1946.91±123 | 0.011 | >0.05 | 2217.41±290.42 | 1890.50±356 | >0.05 | >0.05 | 2088±418 | 2127.13±285 | >0.05 | >0.05 | 1697.11±89 | 1170.64±98 | 0.009 | 0.009 |
| Metionine | 255.84±142 | 498±234 | 1725±79 | 0.0001 | >0.05 | 777.10±58 | 1172.14±315 | 0.007 | 0.009 | 517.45±305 | 1386.02±90 | >0.05 | >0.05 | 1855.08±96 | 1066.41±140 | 0.005 | 0.001 |
| Tryptophan | 55,000±4044 | 3868±2173 | 7842±1634 | >0.05 | >0.05 | 1115.03±455 | 6813.59±1678 | 0.0170.008 | >0.05 | 1359.45±645 | 7215.03±539 | 0.003 | >0.05 | 7306.98±1776 | 5756.33±361 | >0.05 | >0.05 |
| Phenylalanine | 1158±426 | 1256.51±419 | 2227±93.94 | 0.010 | >0.05 | 598.81±455 | 2021.95±192 | 0.001 | >0.05 | 636.77±22 | 1897.67±101 | 0.002 | >0.05 | 1404.89±392 | 525.69±116 | >0.05 | >0.05 |
Control nulliparous group=(CNG).
Control primiparous group=(CPG).
We observed changes in energy intake in the HCD/LPD Group only on G10 (10%). However, it has been reported that consumption of HCD/LPD during pregnancy is inadequate for the mother to regain body weight during lactation [19]. Dietary composition could be linked with regulating nutritional ingestion [21], in yet to be published results. However, other characteristics of food, like flavor and texture, can influence consumption. It is also known that LPDs during gestation are associated with hepatic steatosis in offspring and that they alter pancreatic cell function in the offspring during the postnatal stage and in adult life [36]. On the other hand, the consumption of obesogenic diets during pregnancy and their effect on offspring in the adult stage been studied. It is known that obesogenic diets promote the development of metabolic alterations [37], yet little is known about what happens to the mother's pathophysiology, which the current study aims to support. LPDs have been reported as related to liver damage, and the magnitude of that liver damage is associated with the developmental stage in which the malnutrition is produced in the offspring [20].
4.2Body weightRegarding body weight and food consumption, no significant changes were observed during gestation in the HCD/LPD Group. We suggest that pregnancy with HCD/LPD could involve metabolic adjustments to achieve development in the product of conception. Body weight alterations in the HCD/LPD Group were consistent with those reported by other authors, with a proportion of 10/73% protein and carbohydrates [19,22]. These authors suggest that the protein/carbohydrate ratio can sustain necessary weight gain in the mother.
The maternal environment requires a positive balance to promote the storage of energy resources in the face of metabolic demands. It is important to emphasize that the HCD/LPD Group did not lose weight during gestation and could come to term. Moreover, the proportion of the other micronutrients seemed sufficient to achieve birth and offer the necessary calories to gestational mothers in order to continue with the growth and development of their fetuses.
4.3Water intakeIn the present study we observed a 37% decrease in water consumption in the HCD/LPD Group. We did not find significant differences in water consumption during pregnancy in the HCD/LPD Nulliparous Group compared to the Control Nulliparous Group. We observed lower drinking water consumption in the HCD/LPD Primiparous Group, which could be related to metabolic and hormonal changes in gestation due to adaptation in dietary consumption.
4.4Circulating triacylglycerides, glucose, cholesterol, insulin, LDL, HDL, and corticosteroneThe increase in plasma lipid concentrations has been shown in pregnant women compared to non-pregnant women [24]. In normal pregnancy glycemia has been shown to remain constant during fasting, and in the postprandial period concentrations are variable [23]. The above is consistent with the results of this investigation. We suggest that the reductions in insulin and glucose during initial stages of gestation could favor lipolysis as an adaptive regulation to dietary consumption. It has been reported that serum triacylglycerides and very low density lipoproteins (VLDL) increase in physiological conditions during pregnancy and that triacylglycerides are liberated from the liver and released into circulation at the end of gestation. This increase might be related to a decrease in the activity of lipoprotein lipase, indicating a reduction in the elimination of circulating triacylglycerides by maternal tissues or redistribution in different tissues. During late gestation in rats, the lipoprotein lipase activity decreases in adipose tissue and liver [25]. During feeding the liver stores energy in the form of glycogen, and triacylglycerides are stored in adipose tissue. Blood glucose levels depend on diet and on the glycogenolytic and gluconeogenic enzymes [26]. Starvation in pregnancy directly impairs intrahepatic metabolic processes and consequently affects glucose supply. We suggest that changes in TG and HDL levels could be due to a response to nutritional stress during pregnancy. Here which is referring to nutritional stress of the offspring and achieve birth.
4.5Liver function markersAlterations in liver histology and in the hepatic enzymes ALT, AST, gamma-glutamyl transpeptidase (GGT), visceral adipose tissue, and lipid profiles, have been shown in postnatal rats. Hepatic steatosis is characterized by massive hepatic infiltration of microvesicular fat. It is suggested that when facing nutritional stress caused by an HCD/LPD diet during pregnancy, the liver responds to the lipid metabolism with the objective of ensuring development of the offspring and achieving birth. With this stimulus the liver compromises by storing fat and possibly produces an adaptive metabolic process and manages nitrogen, which could be reflected in the increased concentrations of amino acids, increased levels of ALT, and decreased urea levels.
4.6Liver amino acid concentrationSome modifications related to amino acid metabolism during pregnancy, reported previously, are the following:
The effects of glucagon during pregnancy may be predominantly hepatic, increasing the capacity for amino acid uptake. Nevertheless, amino acid metabolism in the maternal environment during gestation when exposed to HCD/LPD is still unknown; whereas protein restriction during pregnancy, which increases the rate of protein synthesis in liver, has previously been reported [34].
In the present study, we observed an increase in total concentrations of hepatic amino acids in the HCD/LPD Group on G1, G5, and G15, and a decrease on G20. We propose that changes in the liver during early and late pregnancy could be related to the increased synthesis and degradation of proteins during pregnancy.
It is known that with a normal diet during pregnancy, gluconeogenesis increases and decreases the metabolism of lipids in the liver [4,28]. In early pregnancy with a protein-restricted diet, a decrease in branched-chain amino acid and essential amino acid concentrations has been observed in plasma [22,27,29,30]. We observed an increase in the concentration of branched-chain amino acids in the liver in early gestation, and a decrease on G15 and G20; as well as a decrease in essential and non-essential amino acids on G20. The proportion of amino acids stemming from the diet are liberated in the tissues and suffer proteolysis, and that the effects of a low protein diet during gestation could result in a decrease in proteolysis in the early stages of gestation. We observed a decreased concentration of glutamate in livers of mothers exposed to the HCD/LPD diet during early gestation and elevated concentrations of phenylalanine during late gestation. Some authors suggest that the decrease in phenylalanine is related to nitrogen conservation [3]. The decrease in amino acid concentrations probably reflects a decrease in placental uptake and tissue biosynthesis. Methionine is key in developing the mammary gland and synthesizing liver proteins during gestation, and it also acts as a substrate for the antioxidant action of glutathione and taurine [31]. It has been reported that methionine may participate in late pregnancy and suppress the conversion of triacylglycerides to hepatic VLDL, which has been suggested as a risk factor for the development of metabolic diseases [32]. It is proposed that under conditions of gestational protein restriction there is an increase in transamination that changes as the pregnancy progresses. With respect to arginine, this amino acid is dependent on the enzyme N-acetylglutamate synthase, which is activated by arginine.
Glucogenic and ketogenic amino acids are associated with the production of ketone bodies in the liver [33,34]. A dietary protein insufficiency during pregnancy affects liver structure and the proliferative capacity of the liver cells in rat fetuses. In the mother, an alteration in weight occurs and increases the proportion of hepatocytes [35]. The amino acids could be involved in a decrease in transamination and nitrogen, which are related to low levels of alanine in the liver. In this study we neither evaluated the nitrogen balance nor assessed the percentage of muscle, which could be a future perspective for subsequent investigations.
5ConclusionsThe intake of HCD/LPD during pregnancy presents a process of maternal metabolic adaptation that promotes hepatic fat vesicles and an increase in concentrations of amino acids in the liver (arginine, tryptophan, and phenylalanine). We propose that hepatic fat vesicles are adjusted in the liver metabolism during pregnancy without impacting liver function tests, which we interpret as a rheostatic adaptation. It should be noted that despite the HCD/LPD and the metabolic challenge of pregnancy, there was no weight loss or hepatomegaly.
Author's contributionMónica Navarro-Meza: conceived and designed the study, analyzed/interpreted the data, participated in drafting the manuscript, performed experiments, analyzed chromatography and feeding behavior, and determined biochemical markers. Ana B. Cardador-Martínez: participated in amino acid determination and chromatography evaluation, interpreted the data, and participated in drafting the manuscript. Olivia Vazquez-Martínez: determined hepatic enzymes in analysis experiments. José A, Cruz-Ramos: performed histological evaluation of hepatic tissue. Felipe Santoyo-Telles: carried out the statistical analysis. Jesús A. Bejarano-Carrillo: participated in the determination of amino acids. Arianna J. Manzano-Hernández: participated in experiments on food consumption and body weight. Mauricio Díaz-Muñoz: conceived and designed the study, analyzed/interpreted the data, and critically reviewed all the work.
Financial supportThe financial support was provided by The Animal Care Facility (Bioterio) of the Institute of Neurobiology, UNAM; the Southern University Center (CUSUR), University of Guadalajara; and the Animal Care Facility (Bioterio) of the Faculty of Medicine (UASLP) in San Luis Potosí.
Conflict of interestThis submission has been approved by all co-authors, who have no conflicts of interest.
We give thanks to the following persons and institutions for their assistance and support in this study: Fernando López-Barrera, for his technical assistance at the Neurobiology Institute, UNAM. José Martín García Servín, MVZ, for the handling and care of the experimental model; the Animal Care Facility (Bioterio) of the Neurobiology Institute, UNAM; the Southern University Center, University of Guadalajara; and the Animal Care Facility (Bioterio) of the Faculty of Medicine (UASLP) in San Luis Potosí. Jessica González Norris for critically editing the manuscript.


