


Cause of mortality in patients with chronic liver diseases (CLDs) may differ based on underlying etiology of liver disease. Our aim was to assess different causes of death in patients with the most common types of CLD using a national database from the United States.
Materials and methodsDeath data from 2008 and 2018 from the National Vital Statistics System (NVSS) by the National Center for Health Statistics (NCHS) were used. The rank of cause-of-death for each etiology of CLDs was assessed. Causes of death were classified by the ICD-10 codes. Liver-related deaths included liver cancer, cirrhosis and CLDs.
ResultsAmong a total of 2,826,531 deaths in 2018, there were 85,807 (3.04%) with underlying CLD (mean age at death 63.0 years, 63.8% male, 70.8% white). Liver-related mortality was the leading cause of death for all types of CLD [45.8% in non-alcoholic fatty liver disease (NAFLD), 53.0% in chronic hepatitis C (CHC), 57.8% in chronic hepatitis B (CHB), 81.8% in alcoholic liver disease (ALD)]. This was followed by death from cardiac causes (NAFLD 10.3%, CHC 9.1%, CHB 4.6%, ALD 4.2%) and extrahepatic cancer (NAFLD 7.0%, CHC 11.9%, CHB 14.9%, ALD 2.1%). Although liver cancer was the leading cause of cancer death, lung, colorectal and pancreatic cancer were also common causes of cancer death.
ConclusionsAmong deceased patients with CLD, underlying liver disease was the leading cause of death. Among solid cancers, liver cancer was the leading cause of cancer-related mortality.
List of abbreviations
CLD: Chronic liver disease; HBV: hepatitis B virus; HCV: hepatitis C virus; NAFLD: non-alcoholic fatty liver disease; ALD: alcoholic liver disease; CVD: cardiovascular disease; NCHS: National Center for Health Statistics; NVSS: National Vital Statistics System; CHC: chronic hepatitis C; CHB: chronic hepatitis B; CDC: Centers for Disease Control; RR: relative risk.
IntroductionChronic liver disease (CLD) is a major cause of morbidity and mortality worldwide with an estimated 2 million deaths annually [1,2]. Among causes of CLD, infections with chronic hepatitis B virus (HBV) and hepatitis C virus (HCV), non-alcoholic fatty liver disease (NAFLD), and alcoholic liver disease (ALD) are the most common culprits [3,4].
Chronic liver diseases are not only associated with liver-related morbidity and mortality, but also associated with mortality from non-hepatic causes. In this context, extrahepatic diseases may vary among different causes of CLD. For instance, common extrahepatic diseases associated with CHC are mixed cryoglobulinemia, chronic kidney disease, B-cell lymphoma, lichen planus, Sjögren's syndrome, porphyria cutanea tarda and rheumatoid-like arthritis [5,6]. On the other hand, extrahepatic diseases associated with NAFLD are cardiovascular disease (CVD), sarcopenia, endocrinopathies and osteoporosis [7,8]. Additionally, extrahepatic malignancies such as colorectal cancers have been increasingly associated with NAFLD [9,10]. Although we have previously reported increasing mortality among NAFLD [11], a systematic assessment of extrahepatic causes of death among patients with NAFLD using a national database has not been undertaken.
In this context, cause-of-death ranking provides an important perspective for presenting the relative burden of cause-specific deaths. Since 1953, leading cause-of-death data for the U.S. population have been published by the National Center for Health Statistics (NCHS) [12,13]. Analyzing these data may provide insights for public health policies and prioritization of different types of preventative or therapeutic programs. Therefore, our aim was to report cause-of-death ranking for patients with CLD using a population-based mortality database from the United States.
Materials and methodsData sourcesWe utilized the U.S. multiple cause-of-death mortality data collected by the NCHS of the Centers for Disease Control (CDC) for 2008 and 2018 from death certificates filed in all 50 states and the District of Columbia and known as the National Vital Statistics System (NVSS) [14]. More than 99% of deaths in the U.S. are captured by this database, where the cause of death was coded according to the International Classification of Diseases (ICD) 10 codes [15] and the underlying cause of death as well as multiple conditions listed on the death certificate was reported. The underlying cause-of-death is defined by the World Health Organization as "the disease or injury which initiated the train of events leading directly to death, or the circumstances of the accident or violence which produced the fatal injury" [16]. Herein, multiple conditions not listed as underlying cause-of death were defined as contributory cause-of-death.
Definitions of individuals with a chronic liver diseaseWe defined individuals with CLD by having ICD 10 codes for NAFLD, chronic hepatitis C (CHC), chronic hepatitis B (CHB) and alcoholic liver disease (ALD) as underlying or contributing cause of death. Since NAFLD is typically under-coded in the clinical practice (ICD 10 codes: K76.0 and K75.81), we presumed that individuals who were coded for cryptogenic liver disease (K76.9 and K74.6) in the absence of any other causes of chronic liver diseases (CHB, CHC, ALD, autoimmune hepatitis, Wilson's disease, hemochromatosis, iron overload, alpha‐1‐antitrypsin deficiency), or excessive alcohol use, also had NAFLD. This definition has been described and validated in the previous studies [17,18]. For comparing the burden of each liver disease, individuals having multiple CLDs were excluded. Remaining chronic liver diseases were not considered. The ICD-10 codes used to identify other comorbidities, including hepatocellular carcinoma, cirrhosis, cardiovascular disease, diabetes, extrahepatic cancers, and others are shown in Supplementary Table 1.
Socio-demographic variables included age at the time of death, sex, race, marital status, and college degree. Race/ethnicity were categorized into six mutually exclusive groups: non-Hispanic white, non-Hispanic black, Hispanic, non-Hispanic Asian/Pacific Islander, non-Hispanic American Indian/Alaskan Native and a remaining “other race” that cover residual races.
Ranking of leading causes of deathThe ranking of causes of death is highly dependent on the list of causes and ranking rules. Therefore, we followed the procedures used by NCHS for ranking causes of death [19] that had broad appeal and acceptance in the general public health community. Along with the recommendations of the 1951 conference, the original cause list consists of the 64 Selected Causes of Death. With each subsequent ICD revision, the cause list has changed to reflect the improved classification system. As of 2006, the 51 rank-able causes were selected from “List of 113 Selected Causes of Death and Enterocolitis due to Clostridium difficile” to report the leading causes of death in the United States in national vital statistics reports. Among the 51 rankable causes, viral hepatitis, liver cancer, cirrhosis and chronic liver disease were categorized into liver-related disease and all cancers combined excluding liver cancer was defined as extrahepatic cancer. Herein, causes are ranked based on the number of deaths assigned to the 49 rank-able causes (Supplementary Table 2). The relative burden of cause-specific death was depicted by the proportion of total deaths from the rank-able causes. Similar procedures were applied to illustrate the relative burden of specific-cause of cancer deaths among individuals with CLD Changes in the number of deaths between 2008 and 2018 were tested for statistical significance.
Statistical methodsComparisons among individuals according to CLD were carried out by using a non-parametric Kruskal-Wallis test for continuous variables and chi-square test for categorical analysis. To compare the risk of cause-specific death across different liver disease groups, a modified Poisson regression was performed to estimate the relative risk (RR) and confidence intervals by using robust error variances, which is a proper estimate of the standard error of the RR after adjusting socio-demographic confounders. All analyses were performed using SAS version 9.4 (SAS Institute Inc., Cary, NC).
ResultsAmong a total of 2,826,531 deaths (aged 20 years or older) in 2018, there were 85,807 (3.04%) individuals with CLD (age at death: 63.0±12.8 years; male 63.8%; white 70.8%; black 9.8%; Hispanic 14.7%). Of patients with CLD death, 52.3% had NAFLD, 32.3% had ALD, 15.0% had CHC and 0.3% had CHB in 2018. The number of CLD death in 2018 were 4,380 more than in 2008. Additionally, there was a slight shift from 2008, when the proportions were 50.3% (NAFLD), 31.2% (ALD), 18.2% (VHV) and 0.3% (CHB), respectively (Supplementary Table 3). Demographic characteristics and health conditions of individuals with chronic liver disease were presented at Supplementary Table 4.
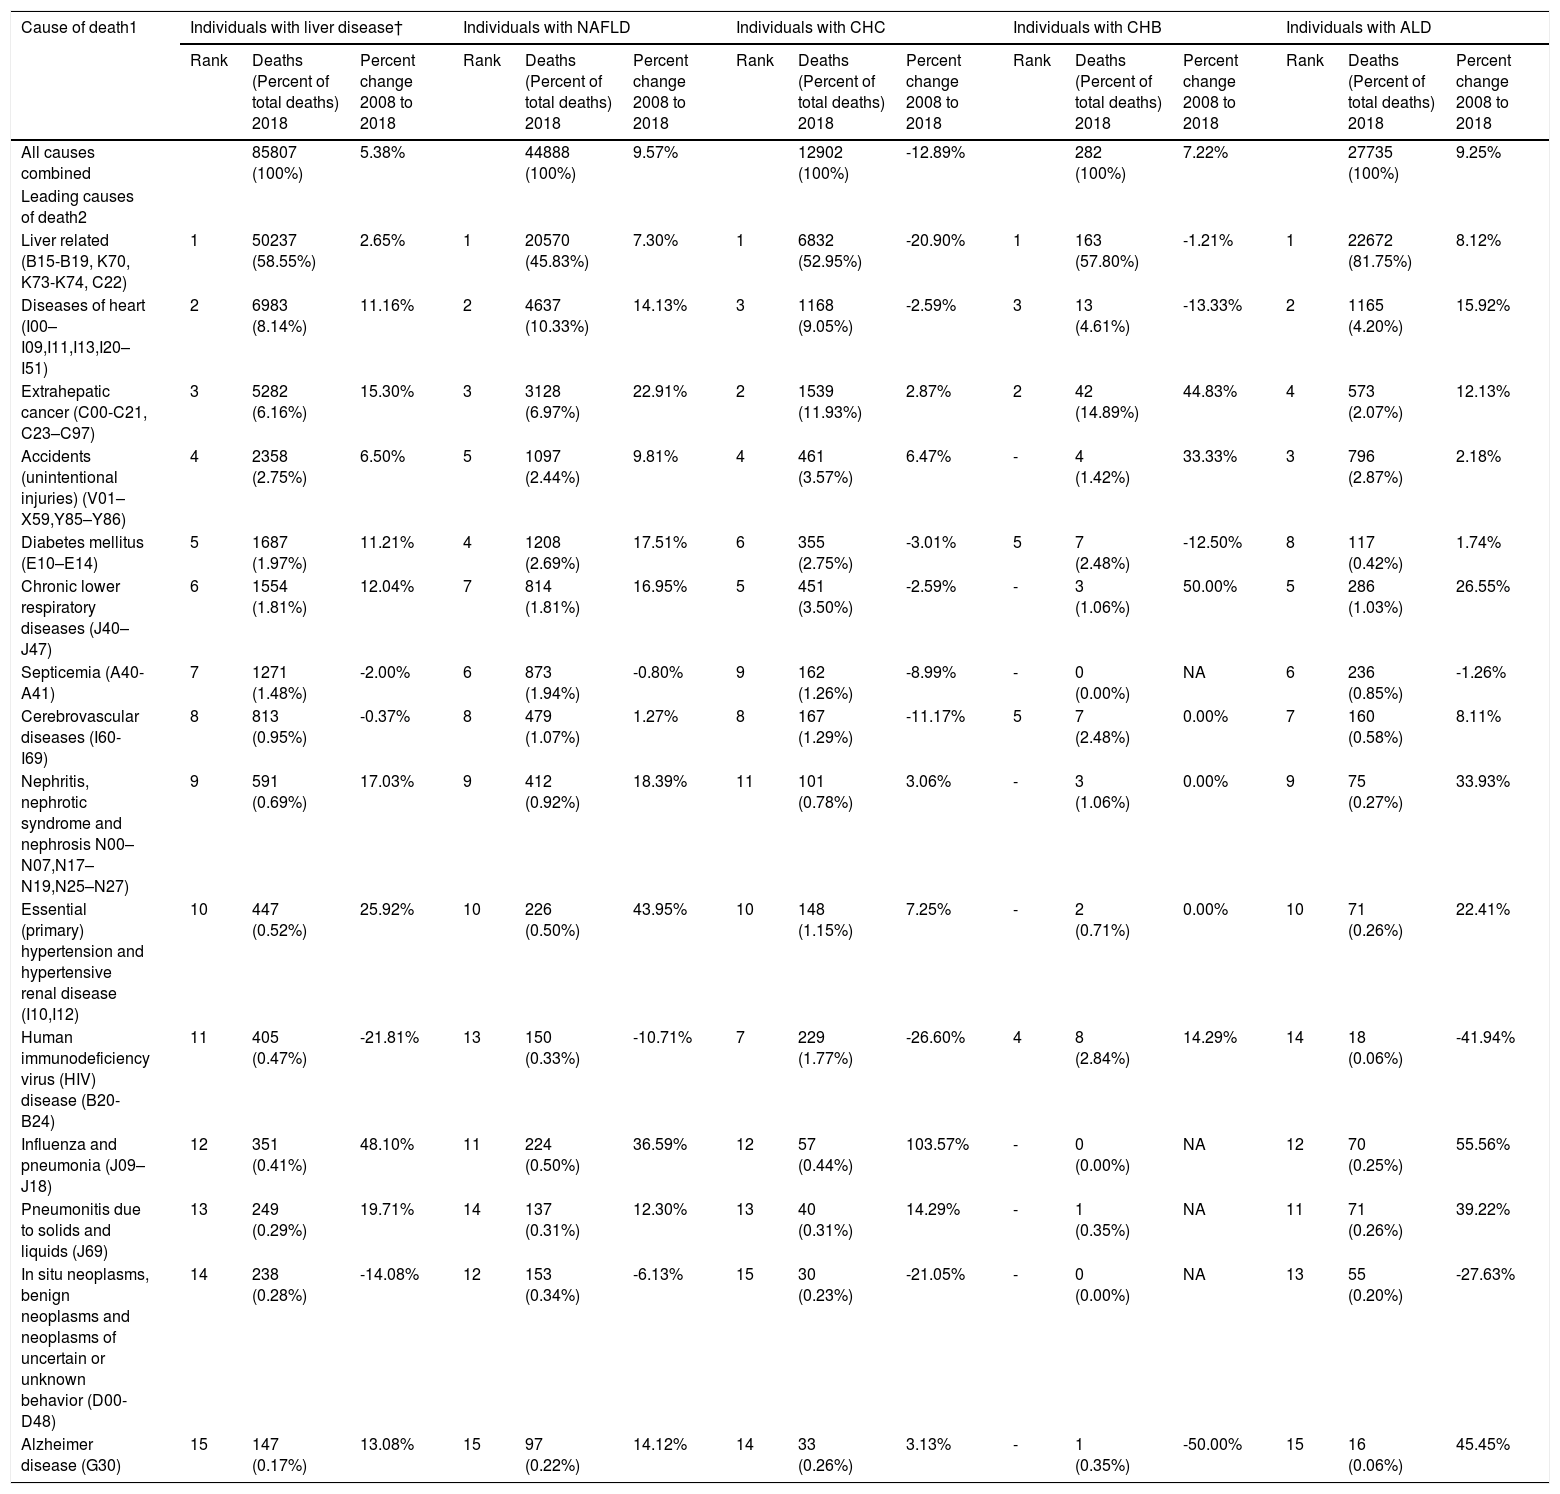
Leading causes of death by liver disease etiologyTable 1 shows the 15 leading causes of death in 2018 and percent changes in the number of deaths from 2008 to 2018. Those 15 leading causes of death accounted for 85.0% of all causes of death among individuals with CLD in the United States. The top three leading causes of death, liver-related disease (all liver cancer, cirrhosis, and liver diseases combined), CVD and extrahepatic cancers, combined, accounted for 72.9% of all deaths in 2018. Table 1 lists the other causes of death, as well as the percent changes in the study years.
Deaths and Percentage of Total Deaths and Percent Change for the 15 Leading Causes of Death: United States 2008 and 2018
Abbreviation: NA, Not applicable.
† NAFLD, CHC, CHB, ALD
rank not applicable because a limited number of cases (≤5)
1 Based on underlying cause of death.
2 Based on the 51 rankable causes selected by Centers for Disease Control and Prevention with the exception of liver-related and extrahepatic cancer.
Source: Centers for Disease Control and Prevention, National Center for Health Statistics, National Vital Statistics System. MortalityData. https://www.cdc.gov/nchs/nvss/deaths.htm. Updated January 2020. Accessed March 20, 2020).
* Statistically significant p<0.05
Liver-related mortality was by far the leading cause of death across all different types of CLD; it was responsible for 81.8% of deaths for patients with ALD, 57.8% for CHB, 53.0% for CHC and 45.8% for individuals with NAFLD (Table 1). In contrast, cardiac mortality among NAFLD was over 2 folds higher than ALD and HBV. In fact, cardiac mortality ranked second for NAFLD (10.3%) and ALD (4.2%) but third for CHC (9.1%) and CHB (4.6%).
Between 2008 and 2018, there was a 12.9% decline in CHC, while deaths due to ALD increased by 9.3% and 9.6% for NAFLD. Expectedly, among different causes of CLD, the rank of “other causes of death” varied. In addition to cardiac mortality, extrahepatic cancer ranked second for CHC (11.9%) and CHB (14.9%) but third for NAFLD (7.0%) and fourth for ALD (2.1%), with a significant increase for NAFLD by +22.9% and for CHC by -2.9% between 2008 and 2018. Individuals with NAFLD had a higher relative burden of mortality due to diabetes, which was the fourth leading cause of death (2.7%), but the sixth for CHC (2.8%) and CHB (2.5%) and the eighth for ALD (0.4%) (Table 1).
Cancer mortality among different chronic liver diseasesThe relative burden of deaths due to all cancers combined was 11.8% of all-cause deaths among individuals with NAFLD, 33.3% for CHC, 39.0% for CHB and 4.6% ALD. Fig. 1 present the distribution of causes of cancer deaths and percent change in the number of cancer deaths from 2008 to 2018 according to four different liver diseases. The majority of cancer deaths came from solid cancers, ranging from 88.3% of all cancer deaths in individuals with CHC to 79.9% in individuals with NAFLD.

As expected, liver cancer was the leading cause of cancer-related mortality across all four liver diseases. Liver cancer accounted for 41.2% of all cancer deaths in individuals with NAFLD, 64.2% in CHC, 61.8% in CHB and 55.1% in ALD. Lung, colorectal and pancreas cancers were the following three causes of cancer deaths for the four groups; together, these three causes accounted for 22.3% of cancer deaths in NAFLD, 15.2% in CHC, 13.6% in CHB and 17.0% ALD. For non-solid cancers, among different causes of chronic liver disease, individuals with NAFLD had a higher proportion of non-Hodgkin's lymphoma and leukemia than other liver diseases (3.5% for NAFLD vs. 2.0% for CHC, 1.8% for CHB and 1.3% for ALD for non-Hodgkin's lymphoma and 2.7% for NAFLD vs. 1.2% for CHC, 2.7% for CHB and 1.3% for ALD for leukemia) (Supplementary Table 5).
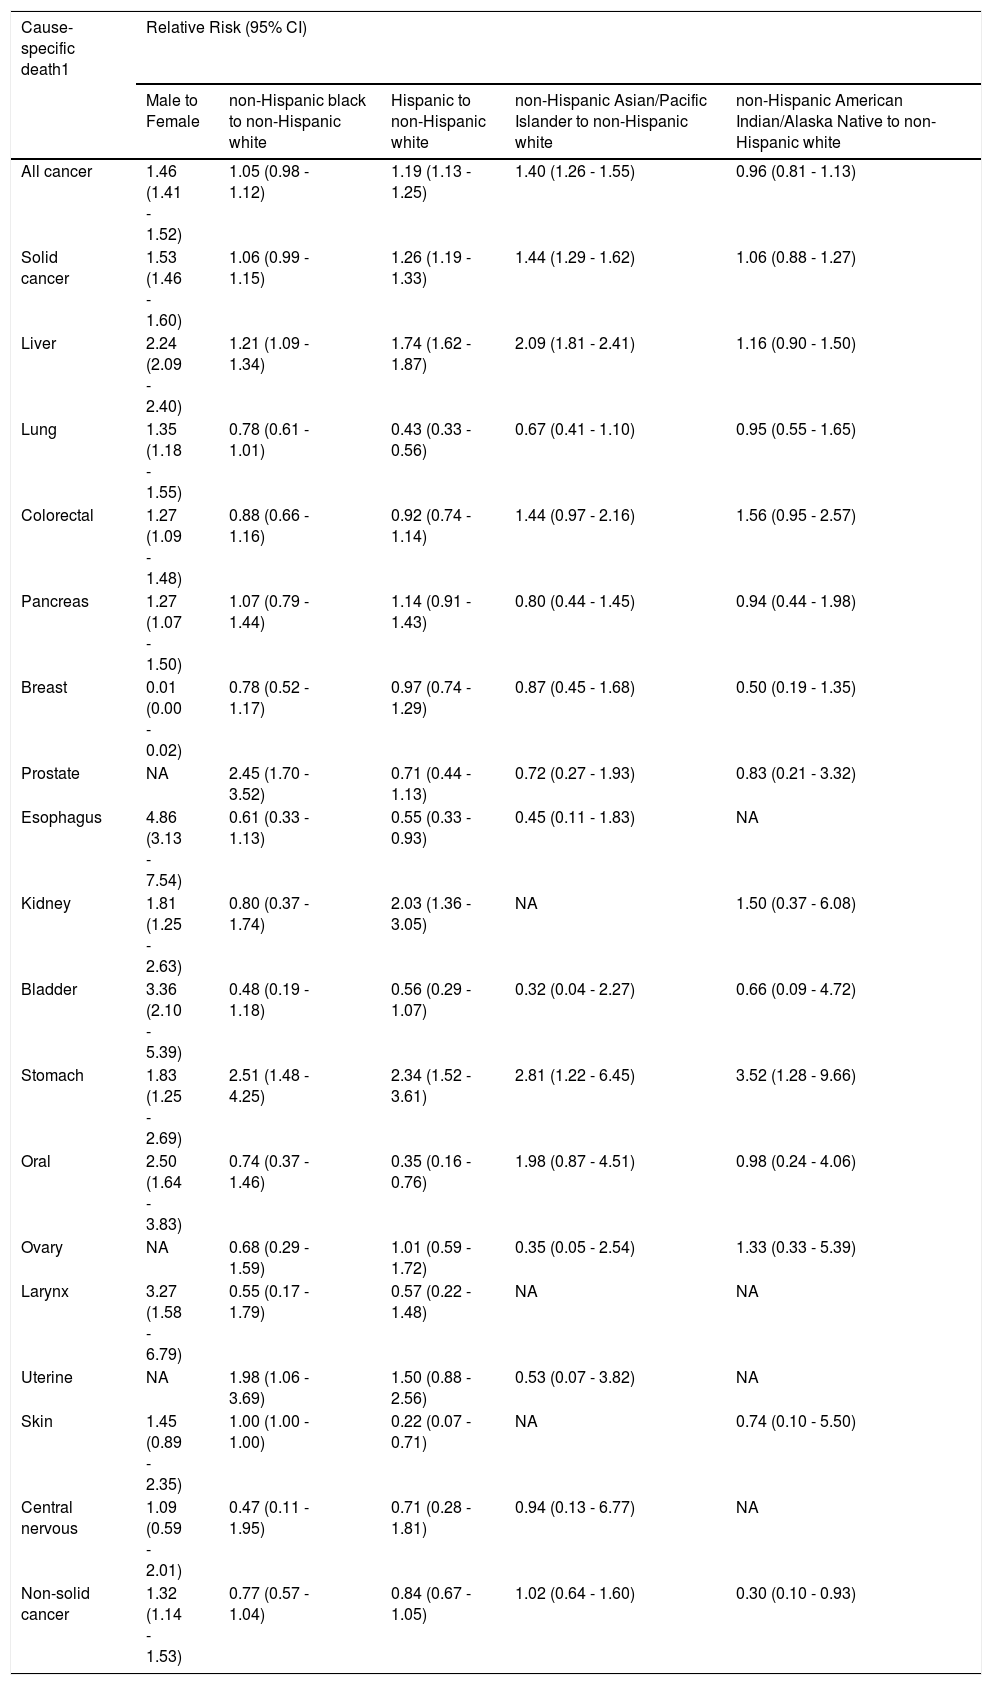
Sex and race/ethnicity differences for cancer deaths among individuals with NAFLDAmong individuals with NAFLD, the causes of cancer deaths were different between male and female individuals (Supplementary Fig. 1). The age-sex-race adjusted RR of cancer deaths among individuals with NAFLD are described in Table 2. The risk of death due to each cancer was 1.3-5 folds higher in male individuals than in female individuals, with the exceptions of breast, ovary and uterine.
Age-sex-race adjusted Relative Risk of Cancer Deaths Among Individuals with NAFLD: United States, 2018
Abbreviation: CI, confidence interval; NA, Not applicable. † Robust Poisson models were used while adjusting calendar age, sex, and race. 1 defined by using underlying cause of death
Compared to non-Hispanic whites, non-Hispanic black had an elevated risk of death due to liver cancer (RR 1.21 [95% CI: 1.06 - 1.34]), prostate (2.45 [1.70 - 3.52]), stomach (2.51 [1.48 - 4.25]) and uterine (1.98 [1.06 - 3.69]); Hispanic and non-Hispanic Asian experienced more death due to all cancers combined (1.19 [1.13 - 1.25]) and 1.40 [1.26 - 1.55]), respectively), solid cancers (1.26 [1.19 - 1.33] and 1.44 [1.29 - 1.62]), liver cancer (1.74 [1.62 - 1.87]) and 2.09 [1.81 - 2.41]), stomach answer (2.34 [1.52 - 3.61]) and 2.81 [1.22 - 6.45]); Hispanic were more likely to die due to kidney cancer (2.03 [1.36 - 3.05]); and non-Hispanic American/Indian were more likely to die due to stomach cancer (3.52 [1.28 - 9.66]).
Association of CLD with mortality due to liver-related disease, cardiovascular disease, cancer, and other diseasesDemographic characteristics and comorbidities of individuals with CLD by specific cause of death were shown in Supplementary Table 6. RR of specific cause of death assessed with the use of a multivariable modified Poisson model after adjustment for age, sex, race/ethnicity, marital status and college degree was shown in Supplementary Table 7. Individuals with NAFLD had an elevated risk of death due to cirrhosis (RR 3.65, 95% CI: 3.47 - 3.83), major CVD (RR 1.23, 95% CI: 1.16 - 1.31), diseases of heart (RR 1.38, 95% CI: 1.28 - 1.47), diabetes (RR 1.15, 95% CI: 1.01 - 1.30), septicemia (RR 1.78, 95% CI: 1.49 - 2.13) and kidney diseases (nephritis, nephrotic syndrome and nephrosis) (RR 1.37, 95% CI: 1.08 - 1.75) compared with individuals with CHC; and an elevated risk for death due to HCC (RR 1.44, 95% CI: 1.29 - 1.61), extrahepatic cancer (RR 2.89, 95% CI: 2.61 - 3.20), other cause of death, ranging from a RR of 1.41 for death due to CLRD (95% CI: 1.20 - 1.65) to 6.18 for death due to HIV (95% CI: 3.71 - 10.30) compared with individuals with ALD. Compared to individuals with NAFLD, individuals with CHC had an elevated risk of deaths due to liver-related disease (RR 1.29, 95% CI: 1.26 - 1.31), HCC (RR 4.81, 95% CI: 4.47 - 5.17), essential (primary) hypertension and hypertensive renal disease (RR 1.88, 95% CI: 1.49 - 2.38), extrahepatic cancer (RR 1.84, 95% CI: 1.73 - 1.97), accidents (RR 1.90, 95% CI: 1.05 - 3.47), CLRD (RR 1.81, 95% CI: 1.58 - 2.06), HIV (RR 2.99, 95% CI: 2.35 - 3.82) and Alzheimer (RR 2.75, 95% CI: 1.77 - 4.27).
DiscussionThe profile of chronic liver disease is changing in the United States and globally [1,20]. In fact, the prevalence and burden of NAFLD is increasing almost in every region of the world while the burden of chronic viral hepatitis is decreasing. This study provides an in-depth assessment of causes of death among the top 4 most common causes of CLD using population-based data from the United States.
Our data shows that in 2018, there were more than 2.8 million adult deaths in the United States with more than 85,000 deaths with underlying CLD. Among those who died with CLD, NAFLD was the most common etiology, affecting 52.3% of patients, followed by ALD (32.3%), CHC (15%) and CHB (0.3%). This finding is consistent with previous data suggesting that in the United States, NAFLD and ALD are increasing while viral hepatitis rates have been declining [21,22]. This unprecedented increase in NAFLD prevalence is largely driven by the epidemic of obesity and diabetes [23,24]. It is largely accepted that NAFLD, and its progressive form non-alcoholic steatohepatitis (NASH), are closely associated with metabolic risk factors. In this context, increasing number of metabolic abnormalities in patients with NAFLD lead to higher risk of mortality [25]. More importantly, NAFLD patients with diabetes have even higher risk of cirrhosis, hepatocellular cancer and liver mortality [26,27]. Indeed, NASH has become the fastest growing indication for liver transplantation in the United States [28, 29] and likely will be the leading indication in the near future [30]. In this context, our results are quite relevant, given the fact that more than half of patients who died with a CLD had NAFLD, and this rate has increased over one decade. Furthermore, our findings suggest that liver disease and CV mortality are among the top two leading causes of death among NAFLD patients, which is in agreement with previous data [27,31,32]. This finding may suggest that patients who were identified as NAFLD were most likely those with more advanced liver disease, causing “liver disease” to be the main cause of mortality. In terms of cancer mortality, liver cancer was responsible for 41.2% of all cancer deaths among patients with NAFLD in our study, which is parallel to recent studies demonstrating the increasing contribution of NAFLD to hepatocellular carcinoma in the global scale [33–35].
In addition to NAFLD, alcoholic liver disease is another chronic liver disease that is on the rise. Our study showed that in 2018, among persons who died from a liver related disease, ALD ranked the second, following NAFLD, with a rate of 32.3%. However, different from NAFLD, ALD patients had higher mortality, given that among patients who had ALD and later died, 81.8% died because of their underlying liver disease. These findings are supported by recent studies demonstrating the growing burden of ALD in the CLD pool. Some experts even suggested that ALD might become the leading cause of liver disease in the United States, if ground-breaking changes took place in NAFLD management [36]. Studies demonstrated a substantial increase in ALD-related hospitalizations and healthcare utilization in the last decades [37], which made ALD one of the top indications for liver transplantation [38,39]. Similar to NAFLD, liver cancer was the leading cause of cancer-related mortality among ALD patients, which was previously reported in a recent study [34]. These are indisputable proof that solid prevention strategies and addiction programs be implemented in the population level to preclude the rising trend of ALD.
An important advance in the last decade was the relative control of viral hepatitis due to development of direct antiviral regimens, which caused disease burden of CHC and CHB to be stable or trending down in the United States [23,35]. Based on our findings, in 2018, viral hepatitis was the leading cause of mortality only in 15.3% of patients who died of liver disease, significantly lower than NAFLD or ALD. However, different from NAFLD and ALD, the impact of liver cancer was slightly higher in viral hepatitis, as liver cancer was responsible for 64.2% and 61.8% of all cancer deaths in patients with CHC and CHB, respectively. These are in agreement with previous studies demonstrating the trend changes in different etiologies of CLD, specifically emphasizing the decreasing trends in viral hepatitis [23,35]. However, due to the aging cohort effect, asymptomatic nature of carriage state, and insufficient screening despite recommendations, some projections anticipate a slight increase in HCV burden in the coming years, before it is eradicated [39,40].
It is important to point out some potential limitations of this study. First, we restricted our analysis to individuals with liver disease listed as the ICD-10 underlying or contributory cause of death codes on the death certification; therefore, true mortality rates for individuals with liver disease might be underestimated. Second, this study was conducted with a national database abstracted from the death certification, which may not be accurate – often completed by one other than the primary physician. Third, we included cryptogenic cirrhosis cases to the NAFLD pool for this study, as previous studies reported that the majority of those cases likely had burnt-out NASH [41]. However, it is also widely accepted that defining NAFLD with ICD 10 codes of K76.0 and K75.81 highly underestimates the true prevalence of NAFLD [42] and including cryptogenic cirrhosis cases to NAFLD cohort might not correct this indecipherable bias. Fourth, the rank order of cause-specific death is heavily depending on the list of causes. To maintain consistency in the reporting of leading causes by federal and state agencies, we adopted the standard method and causes lists, established by the National Center for Health Statistics (NCHS). Awareness that differences in cause of death ranking may be due to random variability when the number of events is small (≤ 100) should be considered.
In conclusion, chronic liver disease continues to be a significant health problem in the United States, with NAFLD and ALD becoming the leading etiologies among patients who died from a liver related cause. The underlying liver disorder is the main driver of mortality in patients with CLD. As expected, all four etiologies suffer heavily from liver cancer mortality, which is the most common solid cancer in those disorders.
Financial supportNone


