


The optimal blood pressure (BP) range for patients with metabolic dysfunction-associated fatty liver disease (MAFLD) is currently unknown. This study aimed to explore the relationship between stratified BP levels and MAFLD progression.
Patients and MethodsThe data of adults who underwent yearly health check-ups were screened to establish both a cross-sectional and a 6-year longitudinal cohort of individuals with MAFLD. BP was classified into the following categories optimal, normal, high-normal, and hypertension. Liver fibrosis was diagnosed with fibrosis-4 (FIB-4) score, nonalcoholic fatty liver disease fibrosis score (NFS), and aspartate aminotransferase-to-platelet ratio index (APRI).
ResultsA total of 10,232 individuals were included in the cross-sectional cohort. In the MAFLD population, individuals with liver fibrosis had significantly higher BP levels and hypertension prevalence (P < 0.001) than those without. Furthermore, liver fibrosis score was significantly associated with BP levels (P < 0.001). In the 6-year longitudinal cohort of 3661 individuals with MAFLD without liver fibrosis, the incidence rates of liver fibrosis increased with increasing BP levels as follows optimal=11.20%, normal=13.90%, high-normal=19.50%, hypertension=26.20% (log-rank 22.205; P < 0.001). Cox regression analysis showed that both baseline high-normal BP (hazard ratio [HR], 1.820; P=0.019) and hypertension (HR, 2.656; P < 0.001) were predictive of liver fibrosis.
ConclusionsBP stratification may be useful in predicting the progression of MAFLD. Individuals having MAFLD with concurrent hypertension or high-normal BP are at a higher risk of liver fibrosis. These findings may provide a criteria for early intervention of MAFLD to prevent liver fibrosis.
The worldwide incidence of hypertension and nonalcoholic fatty liver disease (NAFLD) has continued to rise over the past 20 years owing to overnutrition and sedentary lifestyles, which are emerging as two major global public health problems [1,2]. NAFLD is associated with the development of nonalcoholic steatohepatitis marked by liver inflammation and can progress to advanced cirrhosis, hepatocellular carcinoma, and even liver failure. Obesity, dyslipidemia, type 2 diabetes mellitus (T2DM), and metabolic syndrome are established risk factors for NAFLD progression [3]. However, these risk factors often coexist with hypertension in NAFLD, which makes it difficult to determine specific correlations between hypertension and NAFLD. A recent study indicated that NAFLD may serve as an independent risk factor and a driving force in the development and progression of hypertension [4]. However, further clinical evidence is necessary to prove this causality.
Recently, a consensus of international experts proposed changing the disease acronym from NAFLD to metabolic dysfunction-associated fatty liver disease (MAFLD), and it was supported by many experts around the world [5]. The diagnostic criteria for MAFLD are hepatic steatosis with the coexistence of T2DM or overweight/obesity or hepatic steatosis combined with metabolic disorder in the normal-weight/lean population [6]. A recent meta-analysis showed that the prevalence of MAFLD is 38.77%, affecting more than one third of the global population [7]. The disease spectrum is similar to that of NAFLD, encompassing all stages from steatosis to steatohepatitis, fibrosis, cirrhosis, and hepatocellular carcinoma. However, MAFLD places a greater emphasis on the role of metabolic dysfunction in this disease, and the multidisciplinary care of patients with metabolic diseases now tends to include treatment of fatty liver [8]; thus, closer attention to the correlation between metabolic factors such as blood pressure (BP) and MAFLD progression may be required.
In 2018, the European Society of Cardiology recommended a novel classification of BP into the categories of “optimal,” “normal,” “high-normal,” and “hypertension” as part of their clinical practice guidelines[9]. However, the most appropriate BP stratification system for individuals with MAFLD remains unclear. Liver fibrosis is a remarkable progression of MAFLD and has been generally accepted as a key predictor of overall or liver-related death rates in patients with this disease [9–12]. Thus, the purpose of this study was to clarify the relationship between stratified BP levels (according to the above BP classification system [13]) and the incidence of MAFLD-associated liver fibrosis in Chinese adults.
2Patients and Methods2.1Study participantsData from individuals who received health check-ups, including physical examinations, laboratory tests, and abdominal ultrasonography, at least twice between January 1, 2013, and December 31, 2020, at the Affiliated Hospital of Hangzhou Normal University were collected. The exclusion criteria were as follows: evidence of chronic liver diseases other than MAFLD; history of malignancy; and missing information such as BP, weight, and height. To establish a 6-year longitudinal cohort, the data of individuals who received continuous yearly health check-ups after the first survey were also included during data collection.
2.2Physical examination, biochemical tests, and ultrasonographyDiastolic BP (DBP), systolic BP (SBP), height, and body weight were measured by physicians according to standard protocols. Blood samples were collected after 12 h of fasting for routine hematological and biochemical tests, including assessment of platelet count and fasting plasma glucose (FPG), triglycerides (TG), total cholesterol (TC), high/low-density lipoprotein cholesterol (HDL-c/LDL-c), alanine aminotransferase (ALT), gamma-glutamyl transferase (GGT), aspartate aminotransferase (AST), glycated hemoglobin (HbA1c), and serum uric acid (SUA) levels. Biochemical analyses were performed using the automated biochemical analyzer (AU5821+ISE, OLYMPUS, Tokyo, Japan). Ultrasound examination was performed by two specialized physicians using an ultrasound machine (Toshiba Nemio 20, Toshiba, Tokyo, Japan) with a 3.5-MHz probe. Hepatic steatosis was diagnosed according to characteristic echo patterns on ultrasound examination [14].
2.3Diagnostic criteria for MAFLD and noninvasive evaluation of liver fibrosisDiagnosis of MAFLD was based on evidence of hepatic steatosis (from imaging techniques or blood biomarkers and scores) with overweight/obesity or T2DM or hepatic steatosis with at least two metabolic risk abnormalities in normal-weight or lean individuals [6,15]. The metabolic risk abnormalities included the following: (1) TG ≥1.70 mmol/L or specific medication; (2) HDL-c<1.0 mmol/L for men and <1.3 mmol/L for women or specific medication; (3) BP ≥130/85 mmHg or specific medication; and (4) prediabetes (FPG 5.6–6.9 mmol/L, HbA1c 5.7–6.4%, or 2-h post-load plasma glucose level 7.8–11.0 mmol/L). Waist circumference, high-sensitivity C-reactive protein (SCRP), and homeostasis model assessment index insulin resistance (HOMA-IR) were not available for data collection.
The noninvasive measures of liver fibrosis included the NAFLD fibrosis score (NFS), AST-to-platelet ratio index (APRI), and fibrosis-4 (FIB-4) score and were calculated as follows: NFS=−1.675+[0.037 × age] + [0.094 × body mass index (BMI)] +1.13 × impaired fasting glucose/diabetes mellitus (yes=1 or no=0)+[0.99 × AST/ALT]–[0.013 × platelet count]–[0.66 × albumin]; APRI=100 AST/upper normal limit)/platelet count (× 109); FIB-4=[AST (IU/L) × age (years)]/[platelet count (× 109/L) × ALT−0.5(IU/L)]; a value >1.45 indicating potential liver fibrosis [16,17].
2.4BP stratificationBP was categorized as follows: optimal BP (DBP <80 mmHg and SBP <120 mmHg); normal BP (DBP 80–85 mmHg or SBP 120–129 mmHg); high-normal BP (DBP 85–89 mmHg or SBP 130–139 mmHg); and hypertension (SBP ≥140 mmHg or DBP ≥90 mmHg or currently taking antihypertensive medication) [13]. Individuals with a BMI <23 kg/m2 were deemed normal weight or lean thin according to Asian population standards [15,18].
2.5Statistical methodsThe continuous variables were analyzed using Student's t-test or the Mann–Whitney U-test for two groups and a one-way analysis of variance or Dunnett's test for more than two groups. The chi-square test was used to compare categorical variables. Univariate and multivariate Cox regression analysis was conducted to analyze contributors to liver fibrosis. We estimated the adjusted hazard ratios (HRs) and relevant 95% confidence intervals using the parametric proportional hazard model. Additionally, we plotted Kaplan–Meier curves for presenting time-to-outcome events in the MAFLD group according to different BP stratifications and compared them using log-rank testing. SPSS 26.0 software (IBM Corp, Armonk, NY, USA) was used for all statistical analyses, with P < 0.05 indicating statistical significance.
2.6Ethical statementThis study conformed to the ethical guidelines of the Declaration of Helsinki and was approved by the Ethics Committee of the Affiliated Hospital of Hangzhou Normal University (approval number/ID:2020(02)-KS-022). As this was an observational retrospective study, the requirement for informed consent was waived by the ethics committee.
3Results3.1Establishment of study cohorts and groupsA total of 10,564 individuals were initially included for screening, from which 332 with fatty liver were excluded as they did not meet the diagnostic criteria for MAFLD (Fig. 1). Of the 10,232 individuals included, 41.15% (4,210/10,232) were diagnosed with MAFLD (group 1) and the remaining 58.85% (6,022/10,232) were classified as non-MAFLD (group 2). Among those with MAFLD, 549 had evidence of liver fibrosis (group 3). The 3,661 individuals with MAFLD without liver fibrosis (group 4) were included as a longitudinal cohort for tracking the progression of MAFLD over a 6-year follow-up period. In addition, the baseline variables of T2DM, BP, and grade of hypertension were used for further grouping.
3.2Laboratory and clinical features of the non-MAFLD, MAFLD with liver fibrosis, and MAFLD without liver fibrosis groups
Individuals in the MAFLD with liver fibrosis group were significantly older (61.15 ± 10.95 years) and had a significantly higher prevalence of hypertension (57.73%) than those in the non-MAFLD (39.09 ± 12.35 years, 11.96%) and MAFLD without liver fibrosis (42.88 ± 11.13 years, 33.35%) groups (P < 0.001) (Table 1). Furthermore, individuals in the MAFLD with liver fibrosis group had significantly higher levels of SBP, DBP, AST, ALT, GGT, SUA, and FPG and worse lipid profiles (elevated TC/TG/LDL-c, whereas declined HDL-c levels).
Comparison of baseline clinical and laboratory characteristics between patients having non-MAFLD, MAFLD with fibrosis, and MAFLD without fibrosis.
| Variables | Non-MAFLD | MAFLD without fibrosis | MAFLD with fibrosis | P-value |
|---|---|---|---|---|
| N (male sex) | 6022 (2790) | 3661 (2850) | 549 (407) | < 0.001‡ |
| Age (years) | 39.09 ± 12.35 | 42.88 ± 11.13 | 61.15 ± 10.95 | < 0.001 |
| BMI (kg/m2) | 21.98 ± 2.54 | 26.56 ± 2.75 | 25.96 ± 2.53 | < 0.001 |
| SBP (mmHg) | 120.14 ± 15.88 | 132.51 ± 17.63 | 141.12 ± 20.55 | < 0.001 |
| DBP (mmHg) | 73.09 ± 10.34 | 81.72 ± 11.25 | 84.64 ± 11.61 | < 0.001 |
| SUA (μmol/L) | 306.13 ± 80.51 | 381.80 ± 87.06 | 383.29 ± 87.55 | < 0.001 |
| FPG (mmol/L) | 5.26 ± 0.80 | 5.72 ± 1.38 | 6.18 ± 1.50 | < 0.001 |
| TG (mmol/L) | 1.07 (0.81–1.43) | 1.39 (1.90–2.63) | 1.89 (1.38–2.62) | < 0.001† |
| TC (mmol/L) | 4.72 ± 0.84 | 5.15 ± 0.91 | 5.10 ± 0.93 | < 0.001 |
| LDL-c (mmol/L) | 2.61 ± 0.69 | 3.17 ± 0.73 | 3.04 ± 0.74 | < 0.001 |
| HDL-c (mmol/L) | 1.47 ± 0.32 | 1.22 ± 0.27 | 1.29 ± 0.31 | < 0.001 |
| ALT (U/L) | 17.00 (13.00–23.00) | 31.00 (22.00–45.00) | 26.00 (18.00–40.00) | < 0.001† |
| AST (U/L) | 19.00 (16.00–22.00) | 22.00 (18.00–28.00) | 26.00 (21.00–34.00) | < 0.001† |
| GGT (U/L) | 17.00 (13.00–24.00) | 35.00 (23.00–55.00) | 35.00 (22.00–59.00) | < 0.001† |
| HbA1c | 5.43 ± 0.46 | 5.80 ± 0.81 | 6.02 ± 0.91 | < 0.001 |
| BP categories | ||||
| Optimal (n, %) | 3094 (51.37%) | 784 (21.41) | 73 (13.30) | < 0.001‡ |
| Normal (n, %) | 1322 (21.95%) | 794 (21.69) | 76 (13.84) | < 0.001‡ |
| High-normal (n, %) | 886 (14.71%) | 862 (23.55) | 105 (19.13) | < 0.001‡ |
| Hypertension (n, %) | 720 (11.96%) | 1221 (33.35) | 295 (53.73) | < 0.001‡ |
Note: Data are expressed as mean ± standard deviation or median (interquartile range).
BP, blood pressure; BMI, body mass index; MAFLD, metabolic dysfunction-associated fatty liver disease; SBP, systolic blood pressure; DBP, diastolic blood pressure; SUA, serum uric acid; FPG, fasting plasma glucose; TG, triglycerides; TC, total cholesterol; LDL-c, low-density lipoprotein cholesterol; HDL-c, high-density lipoprotein cholesterol; ALT, alanine aminotransferase; AST, aspartate aminotransferase; GGT, gamma-glutamyl transferase; HbA1c, glycated hemoglobin.
Spearman correlation analysis showed that the SBP (r = 0.184, P < 0.001), DBP (r = 0.135, P < 0.001), FPG (r = 0.149, P < 0.001), and HDL-c (r = 0.124, P < 0.001) levels were significantly correlated to the risk of liver fibrosis, while BMI (r = -0.129, P < 0.001) and LDL-c (r = -0.070, P < 0.001) were negatively correlated with the FIB-4 score (Fig. 2A). The prevalence of liver fibrosis significantly increased with SBP levels ranging from 130 to 180 mmHg (R = 0.158, P < 0.001) (Fig. 2B) and slightly increased with increasing DBP levels (Fig. 2C). The prevalence of liver fibrosis significantly increased with increasing BP stratification levels, from 8.52% in optimal, 8.74% in normal, 10.86% in high-normal, to 19.46% in hypertension (Fig. 2D).
 Spearman correlation analysis of metabolic indicators with noninvasive liver fibrosis index; (B) Liver fibrosis prevalence stratified by SBP level; (C) Liver fibrosis prevalence stratified by DBP level; (D) Liver fibrosis prevalence stratified by BP NFS, nonalcoholic fatty liver disease fibrosis score; FIB-4, fibrosis-4 score; BP, blood pressure; APRI, AST-to-platelet ratio index; BMI, body mass index; SBP, systolic blood pressure; DBP, diastolic blood pressure; SUA, serum uric acid; FPG, fasting plasma glucose; TG, triglycerides; TC, total cholesterol; LDL-c, low-density lipoprotein cholesterol; HDL-c, high-density lipoprotein cholesterol.")
Correlation between liver fibrosis and BP level. (A) Spearman correlation analysis of metabolic indicators with noninvasive liver fibrosis index; (B) Liver fibrosis prevalence stratified by SBP level; (C) Liver fibrosis prevalence stratified by DBP level; (D) Liver fibrosis prevalence stratified by BP
NFS, nonalcoholic fatty liver disease fibrosis score; FIB-4, fibrosis-4 score; BP, blood pressure; APRI, AST-to-platelet ratio index; BMI, body mass index; SBP, systolic blood pressure; DBP, diastolic blood pressure; SUA, serum uric acid; FPG, fasting plasma glucose; TG, triglycerides; TC, total cholesterol; LDL-c, low-density lipoprotein cholesterol; HDL-c, high-density lipoprotein cholesterol.
In addition, the noninvasive parameters of liver fibrosis (FIB-4 score, APRI, and NFS) significantly increased across all BP categories (P < 0.05) (Fig. 3A–C).
 Comparison of FIB-4 scores segregated by BP stratification; (B) Comparison of APRI segregated by BP stratification; (C) Comparison of NFS segregated by BP stratification; *P < 0.05. NFS, nonalcoholic fatty liver disease fibrosis score; FIB-4, fibrosis-4 score; BP, blood pressure; APRI, AST-to-platelet ratio index.")
Comparison of liver fibrosis prevalence and noninvasive fibrosis scores segregated by BP stratification. (A) Comparison of FIB-4 scores segregated by BP stratification; (B) Comparison of APRI segregated by BP stratification; (C) Comparison of NFS segregated by BP stratification; *P < 0.05. NFS, nonalcoholic fatty liver disease fibrosis score; FIB-4, fibrosis-4 score; BP, blood pressure; APRI, AST-to-platelet ratio index.
To analyze the contributors to liver fibrosis, individuals with MAFLD without liver fibrosis at baseline were followed for six years. Univariate Cox regression analysis results identified that age >40 years (HR, 12.423; P < 0.001), hypertension (HR, 1.753; P < 0.001), and T2DM (HR, 1.601; P=0.02) were risk factors for liver fibrosis, while male sex (HR, 0.469; P < 0.001) was a protective factor (Table 2). After adjustment for metabolic factors at baseline (model 1), multivariate regression analysis showed that hypertension (HR, 1.798; P < 0.001) and T2DM (HR, 1.495; P=0.050) were risk factors for liver fibrosis. In addition, after adjustment for sex and age (model 2), multivariate regression analysis showed that the male sex (HR, 0.517; P < 0.001) was a protective factor, whereas age >40 years (HR, 11.352; P < 0.001) and hypertension (HR, 1.361; P < 0.001) were risk factors.
Risk factors associated with liver fibrosis in the longitudinal MAFLD cohort.
Model 1 was adjusted for BMI, hypertension, T2DM, hypertriglyceridemia, hypercholesterolemia, hyperuricemia, high LDL-c, and low HDL-c levels at baseline.
Model 2 was adjusted for Model 1 factors plus age and sex at baseline.
MAFLD, metabolic dysfunction-associated fatty liver disease; BMI, body mass index; T2DM, type 2 diabetes mellitus; LDL-c, low-density lipoprotein cholesterol; HDL-c, high-density lipoprotein cholesterol; HR, hazard ratio; CI, confidence interval.
During the 6-year follow-up period, the total incidence of liver fibrosis was 19.20% (Fig. 4A). Kaplan–Meier curves and log-rank testing showed that the incidence rates significantly increased with increasing BP stratification levels, from 11.20% in optimal, 13.90% in normal, 19.50% in high-normal, to 26.20% in hypertension (log-rank 22.205; P < 0.001) (Fig. 4B). The exclusion of individuals with baseline T2DM did not statistically impact this prevalence (11.30% in optimal, 13.80% in normal, 18.00% in high-normal, 26.10% in hypertension, log-rank 23.211; P < 0.001) (Fig. 4C). In addition, there was no significant difference in the incidence of liver fibrosis according to different hypertension grades during the 6-year follow-up (log-rank 1.844, P=0.398) (Fig. 4D).
 Liver fibrosis incidence in individuals with MAFLD; (B) Liver fibrosis incidence stratified by BP level; (C) Liver fibrosis incidence stratified by BP level after removing baseline T2DM; (D) Liver fibrosis incidence stratified by hypertension grade BP, blood pressure; T2DM, type 2 diabetes mellitus; MAFLD, metabolic dysfunction-associated fatty liver disease.")
Cumulative incidence of liver fibrosis during the 6-year follow-up by Kaplan–Meier curves. (A) Liver fibrosis incidence in individuals with MAFLD; (B) Liver fibrosis incidence stratified by BP level; (C) Liver fibrosis incidence stratified by BP level after removing baseline T2DM; (D) Liver fibrosis incidence stratified by hypertension grade
BP, blood pressure; T2DM, type 2 diabetes mellitus; MAFLD, metabolic dysfunction-associated fatty liver disease.
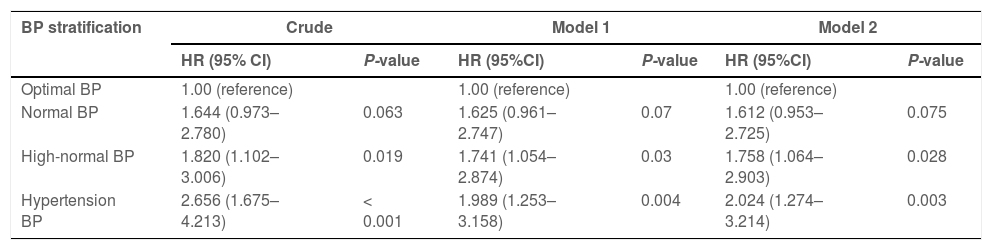
The relative risks of liver fibrosis associated with stratified BP were further analyzed using HR analysis with multistep adjustments (Table 3). Individuals with MAFLD with both hypertension and high-normal BP had significantly higher HRs for liver fibrosis (HR, 2.656 and 1.820, respectively) than those with optimal BP (HR, 1.000; P < 0.05) in crude analysis. Adjustment for sex and age did not impact these HRs (Model 1: HR, 1.989 (hypertension), 1.741 (high-normal), 1.000 (optimal); P < 0.05). Further adjustment of model 1 for baseline metabolic factors, including BMI, hypertension, T2DM, hypertriglyceridemia, hypercholesterolemia, hyperuricemia, high LDL-c, and low HDL-c levels did not impact the significance (HR, 2.024 (hypertension), 1.758 (high-normal), 1.000 (optimal); P < 0.05).
Relative risks of liver fibrosis based on stratified BP in MAFLD during follow-up.
Model 1 was adjusted for age and sex at baseline. Model 2 was adjusted for Model 1 factors plus BMI, hypertension, T2DM, hypertriglyceridemia, hypercholesterolemia, hyperuricemia, high LDL-c, and low HDL-c levels at baseline.
BP, blood pressure; MAFLD, metabolic dysfunction-associated fatty liver disease; BMI, body mass index; T2DM, type 2 diabetes mellitus; LDL-c, low-density lipoprotein cholesterol; HDL-c, high-density lipoprotein cholesterol; HR, hazard ratio; CI, confidence interval.
The transition from NAFLD to the new name and definition of MAFLD represents an important milestone and has great potential to positively impact diagnosis and treatment [19]. A recent study demonstrated that MAFLD better identifies patients at high risk for atherosclerotic cardiovascular disease [20]. However, hypertension often coexists with other metabolic abnormalities in MAFLD, which makes it difficult to verify whether hypertension is independently associated with MAFLD, as well as its progression. In the present study, we revealed that BP stratification level was closely associated with the incidence of liver fibrosis in MAFLD. In addition, we found that both high-normal BP and hypertension were associated with an increased risk of liver fibrosis over a 6-year follow-up period.
Owing to wide variations in nutrition, lifestyle, physical activity levels, sedentary behavior patterns, and socioeconomic and genetic backgrounds, the prevalence of MAFLD varies widely across the Asia-Pacific regions [21,22]. In this study population, MAFLD had a high prevalence of 41.15% (Table 1), which may relate to the well-developed economy in southeast China, where the cohort was located. Additionally, consistent with a previous study [23], the prevalence of MAFLD increased with higher BP levels and was higher among men than women. In individuals with MAFLD, the baseline prevalence of liver fibrosis was 13.04%, and the cumulative incidence of liver fibrosis over six years was 19.20%. Since liver fibrosis is a predictor of cirrhosis or hepatocellular carcinoma [9], the risk factors for MAFLD-related liver fibrosis requires further analysis.
We also assessed the status of liver fibrosis in individuals with MAFLD through noninvasive methods such as the FIB-4 score, NFS, and APRI [16,17,24]. Consistent with a previous study, our data showed that BP levels were closely related to noninvasive liver fibrosis scores and were significantly related to liver fibrosis prevalence in individuals with MAFLD (Figs. 2 and 3). A previous animal study demonstrated that hypertension was related to a higher incidence of liver fibrosis in hepatic steatosis [20]; however, it remains unclear how BP is associated with MAFLD outcomes in humans. In this longitudinal study, we confirmed that baseline stratified BP levels are closely related to the occurrence of liver fibrosis in MAFLD (Fig. 4B).
Because MAFLD is associated with multiple metabolic abnormalities (Table 1), it is difficult to determine whether BP alone is an independent risk factor for liver fibrosis. While previous studies have confirmed that T2DM is a risk factor for liver fibrosis in NAFLD [25–29], univariate and multivariate analyses in the present study showed that both hypertension and T2DM were risk factors for liver fibrosis (Table 2). By adjusting our analyses for T2DM, we demonstrated that BP stratification is a valuable tool for predicting liver fibrosis among individuals with MAFLD (Fig. 4B, C). In addition to hypertension, our analysis showed that high-normal BP is also predictive of increased liver fibrosis incidence (Table 3). The renin-angiotensin-aldosterone system is well recognized for its essential role in the physiological regulation of blood volume, BP, and sodium homeostasis [30,31]. Increasing evidence demonstrates that this system is overactive at different stages of liver fibrosis [30,32], which may explain the association between BP and liver fibrosis.
A limitation of this retrospective study is that three metabolic indices (HOMA-IR, waist circumference, and SCRP) were unavailable for data analysis. In addition to hepatic steatosis, the presence of at least two of seven metabolic abnormalities is required to diagnose MAFLD in lean and normal-weight individuals [6]. Therefore, the absence of these data may have resulted in an underestimation of the MAFLD incidence in this particular group. Nonetheless, only 7% of individuals (332 of 4,542) with fatty liver did not meet the diagnostic criteria for MAFLD in the lean/normal-weight population (Fig. 1), suggesting that the scope for underestimation was limited. Another limitation was that although liver biopsy for histology is the reference standard for assessing liver fibrosis, it was not readily used in this study because of its invasiveness. Therefore, we used the noninvasive methods of FIB-4 score, NFS, and APRI to assess liver fibrosis. Recently, these noninvasive indicators have been demonstrated to be reliable surrogate markers for predicting histologically confirmed advanced fibrosis [14–16]. Additionally, since FIB-4 score and NFS can be influenced by age, we adjusted for age in the analysis of follow-up outcomes (Table 3).
5ConclusionsIn conclusion, based on data from both cross-sectional and longitudinal cohorts, we found that the risk of liver fibrosis among individuals with MAFLD increased with increasing BP levels. Thus, BP control strategies, with a focus on maintaining BP within the optimal range, may be beneficial in delaying MAFLD progression. Individuals with MAFLD and hypertension, including those with BP in the high-normal range, should be closely monitored for signs of liver fibrosis to ensure early diagnosis and management. Therefore, this study may present a diagnostic criterion for early intervention of MAFLD to prevent the progression of liver fibrosis.
Author contributionsJing Liu: data curation, writing – original draft, writing – review & editing, visualization. Haifeng Lv: data curation, writing – original draft, writing – review & editing, visualization. Jie Wang: investigation, methodology. Qianru Zhu: investigation, methodology. Gongying Chen: data curation. Yanming Jiang: data curation. Ke Zhao: software. Li Shao: software. Junping Shi: resources, project administration, supervision. Xiaoben Pan: resources, project administration, writing – original draft, writing – review & editing.
Data availability statementThe datasets used and/or analyzed during the current study are available from the corresponding author upon reasonable request.
FundingThis research was funded by the National Natural Science Foundation of China (grant number 82070610) and the Zhejiang Provincial Department of Health Project (grant number 2020KY715).
This research was funded by the National Natural Science Foundation of China (grant number 82070610) and the Zhejiang Provincial Department of Health Project (grant number 2020KY715).


