


Introduction. Primary sclerosing cholangitis (PSC) is an idiopathic hepatobiliary disorder associated with an increased risk for cholangiocarcinoma (CCA) and a median survival time of 12 years. Reliable predictors of CCA and other major adverse events in PSC are currently lacking. Recently, serum IgE was found to be associated with CCA in a Japanese cohort of PSC patients. Our aim in this study was to determine whether IgE levels predict time to CCA, liver transplantation, or death in a Western (USA-based) cohort of PSC patients.
Material and methods. Thirty-eight patients with PSC and IgE levels were identified and categorized into low or high IgE groups based on the sample median. Groups were compared with respect to clinical characteristics and adverse endpoint-free survival, and the association between IgE and endpoints was assessed with multivariate proportional-hazards models.
Results. The median sample age at PSC diagnosis was 41 years, and median serum IgE level was 47.6 kU/L. Low and high IgE groups differed significantly only with respect to IgG subclasses, which were higher among the latter (p < 0.05). There were no significant differences in composite endpoint-free (p = 0.83) or CCA-free survival (p = 0.20). In multivariate analyses, only Mayo PSC risk score and MELD score were significant predictors of endpoint-free survival (p < 0.05).
Conclusions. Serum IgE level is associated with several IgG subclass levels but not time to CCA, liver transplantation, or death among PSC patients in a USA-based cohort. While Mayo PSC risk score and MELD score can predict these outcomes, more specific predictors of CCA are needed.
Primary sclerosing cholangitis (PSC) is an incurable, fibro-inflammatory cholangiopathy of unknown etiopathogenesis.1,2 It leads to cirrhosis, represents a risk factor for cholangiocarcinoma (CCA), and carries a median liver transplant-(LT) free survival of 12 years.3–5 An ongoing challenge in PSC management is accurate prediction of CCA as well as other major adverse clinical endpoints. Although the Mayo PSC risk score and model for endstage liver disease (MELD) score can be helpful for general prognostic purposes,6–8 more clinically-useful predictors of risk are needed.
In a recent study of Japanese patients with PSC, patients with lower serum IgE levels were found to have a higher proportion of CCA cases, and it was thus suggested that PSC patients be categorized based on IgE level.9 Although potentially of clinical promise, to date, the generalizability and strength of this putative association remains unknown.
Our aim was to determine whether there are differences in clinical features and time to CCA, LT, and/or death between patients with low serum IgE compared to high serum IgE levels in a USA-based cohort of PSC patients.
Material and MethodsPatientsAfter obtaining institutional review board approval, medical records of patients with PSC from 1995-2011 were reviewed to abstract demographic, laboratory, and other pertinent clinical data and outcomes. PSC was diagnosed by: serum alkaline phosphatase (ALK) > 1.5x the upper limit of normal, cholangiography demonstrating biliary strictures or irregularity consistent with PSC, and/or liver histology.10,11 Exclusion criteria were: concomitant liver disease (e.g. hepatitis C), secondary sclerosing cholangitis or IgG4-related disease, active allergic disease or helminthic infection, and no serum IgE data.
Study outcomes and variablesThe primary outcome was time to the composite endpoint of CCA, LT, or death. The secondary outcome was differences in clinical features.
In addition to serum IgE level, the following predictors were collected: age at PSC diagnosis, sex, race, inflammatory bowel disease (IBD), history of immunosuppression, colectomy, or variceal bleeding, serum laboratory tests including albumin, aspartate aminotransferase (AST), creatinine, international normalized ratio (INR), sodium, and bilirubin, levels of other serum immunoglobulins including IgA, IgM, total IgG, IgG1, IgG2, IgG3, and IgG4, Mayo PSC and MELD scores. When more than one value was available (e.g. for biochemical tests), the one closest to PSC diagnosis was used.
Reference ranges for serum immunoglobulins (measured by nephelometry) were: IgA 50-400, IgM 50-300, IgG 767-1590, IgG1 490-1140, IgG2 150-640, IgG3 20-110, IgG4 8-140. Notably, because serum IgE levels are severely positively skewed,12 we primarily used the sample median to distinguish between low and high serum IgE levels.
Statistical analysisPatients in the low and high IgE groups were compared with respect to demographic, biochemical, and clinical features and outcomes. Mann-Whitney and Chi-square or Fisher’s exact tests were used to compare continuous and categorical variables, respectively. Kaplan-Meier curves were generated to evaluate time to composite endpoint as well as to CCA. Univariate and multivariate proportionalhazards models were constructed to assess the association between time to composite endpoint and serum IgE level as well as other potential predictors. Variables adjusted for in the proportionalhazards models were those that were significant in univariate analysis or known to be associated with outcomes based on prior studies.6–8,13
Tests of significance were two-sided with an alpha level of 0.05 and were performed using JMP statistical software (version 8.0, SAS, NC).
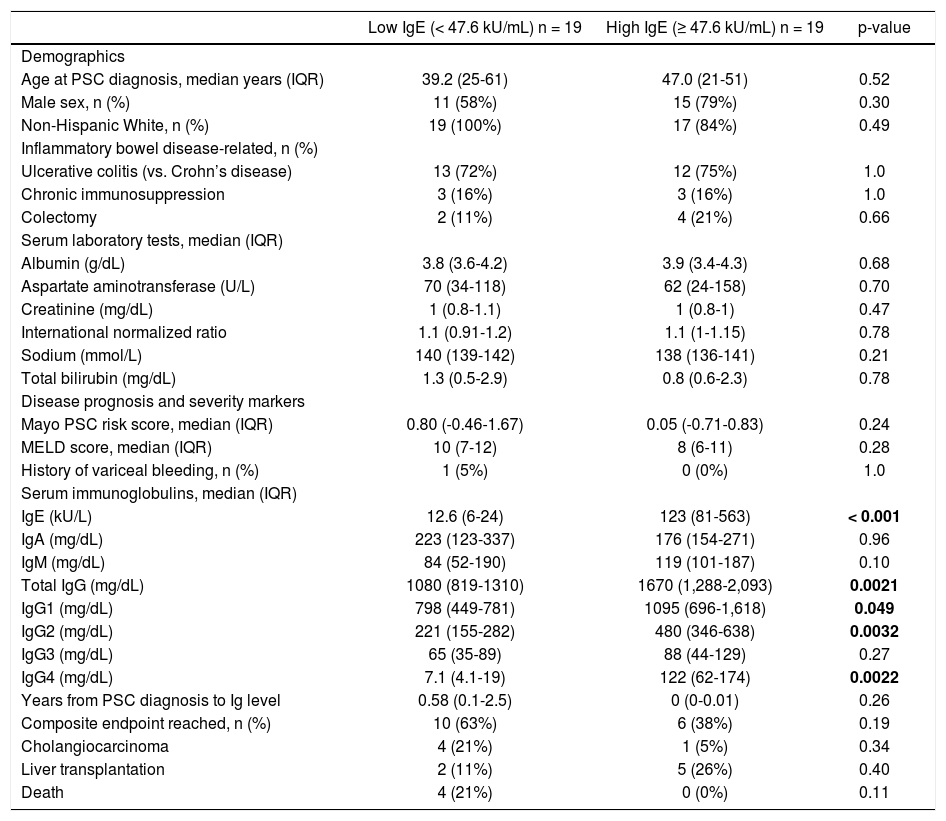
ResultsThirty-eight PSC patients met criteria for study inclusion. The median serum IgE level was 47.6 kU/L, median age at PSC diagnosis was 42.7 years, 68% of patients were male, and 95% were non-Hispanic White. Table 1 compares these and other characteristics between the low and high IgE groups. Importantly, there were no significant differences in characteristics between the two groups except for other serum Ig levels. Specifically, the high serum IgE group also had significantly higher total IgG (p = 0.002), IgG1 (p = 0.049), IgG2 (p = 0.003), and IgG4 (p = 0.002).
Baseline characteristics and comparison of PSC patients in low and high serum IgE groups.
| Low IgE (< 47.6 kU/mL) n = 19 | High IgE (≥ 47.6 kU/mL) n = 19 | p-value | |
|---|---|---|---|
| Demographics | |||
| Age at PSC diagnosis, median years (IQR) | 39.2 (25-61) | 47.0 (21-51) | 0.52 |
| Male sex, n (%) | 11 (58%) | 15 (79%) | 0.30 |
| Non-Hispanic White, n (%) | 19 (100%) | 17 (84%) | 0.49 |
| Inflammatory bowel disease-related, n (%) | |||
| Ulcerative colitis (vs. Crohn’s disease) | 13 (72%) | 12 (75%) | 1.0 |
| Chronic immunosuppression | 3 (16%) | 3 (16%) | 1.0 |
| Colectomy | 2 (11%) | 4 (21%) | 0.66 |
| Serum laboratory tests, median (IQR) | |||
| Albumin (g/dL) | 3.8 (3.6-4.2) | 3.9 (3.4-4.3) | 0.68 |
| Aspartate aminotransferase (U/L) | 70 (34-118) | 62 (24-158) | 0.70 |
| Creatinine (mg/dL) | 1 (0.8-1.1) | 1 (0.8-1) | 0.47 |
| International normalized ratio | 1.1 (0.91-1.2) | 1.1 (1-1.15) | 0.78 |
| Sodium (mmol/L) | 140 (139-142) | 138 (136-141) | 0.21 |
| Total bilirubin (mg/dL) | 1.3 (0.5-2.9) | 0.8 (0.6-2.3) | 0.78 |
| Disease prognosis and severity markers | |||
| Mayo PSC risk score, median (IQR) | 0.80 (-0.46-1.67) | 0.05 (-0.71-0.83) | 0.24 |
| MELD score, median (IQR) | 10 (7-12) | 8 (6-11) | 0.28 |
| History of variceal bleeding, n (%) | 1 (5%) | 0 (0%) | 1.0 |
| Serum immunoglobulins, median (IQR) | |||
| IgE (kU/L) | 12.6 (6-24) | 123 (81-563) | < 0.001 |
| IgA (mg/dL) | 223 (123-337) | 176 (154-271) | 0.96 |
| IgM (mg/dL) | 84 (52-190) | 119 (101-187) | 0.10 |
| Total IgG (mg/dL) | 1080 (819-1310) | 1670 (1,288-2,093) | 0.0021 |
| IgG1 (mg/dL) | 798 (449-781) | 1095 (696-1,618) | 0.049 |
| IgG2 (mg/dL) | 221 (155-282) | 480 (346-638) | 0.0032 |
| IgG3 (mg/dL) | 65 (35-89) | 88 (44-129) | 0.27 |
| IgG4 (mg/dL) | 7.1 (4.1-19) | 122 (62-174) | 0.0022 |
| Years from PSC diagnosis to Ig level | 0.58 (0.1-2.5) | 0 (0-0.01) | 0.26 |
| Composite endpoint reached, n (%) | 10 (63%) | 6 (38%) | 0.19 |
| Cholangiocarcinoma | 4 (21%) | 1 (5%) | 0.34 |
| Liver transplantation | 2 (11%) | 5 (26%) | 0.40 |
| Death | 4 (21%) | 0 (0%) | 0.11 |
Reference ranges for serum biochemical tests provided in the methods section. Ig: immunoglobulin. IQR: interquartile range. MELD: model for end-stage liver disease. PSC: primary sclerosing cholangitis.
With respect to outcomes, 10 patients experienced the composite endpoint in the low IgE group compared to 6 in the high IgE group (Table 1). The two groups did not differ significantly in the proportion of patients who developed the composite endpoint or any of its individual components (all p > 0.05). Moreover, there was no significant difference in composite endpointfree survival between the low and high IgE groups as demonstrated in figure 1 (p = 0.83). In addition, CCA-free survival was also not significantly different between groups (p = 0.20, data not shown).
. When an IgE cut-off of 170 kU/L (as previously published) was used instead, there was again no significant difference in time to the composite endpoint (p = 0.91, Wilcoxon test).")
Kaplan-Meier curves comparing time to the composite endpoint between the low and high IgE groups. Kaplan-Meier curves demonstrate no significant difference in time to death, cholangiocarcinoma, or liver transplantation between the low IgE group and the high IgE group (cutoff based on sample median). When an IgE cut-off of 170 kU/L (as previously published) was used instead, there was again no significant difference in time to the composite endpoint (p = 0.91, Wilcoxon test).
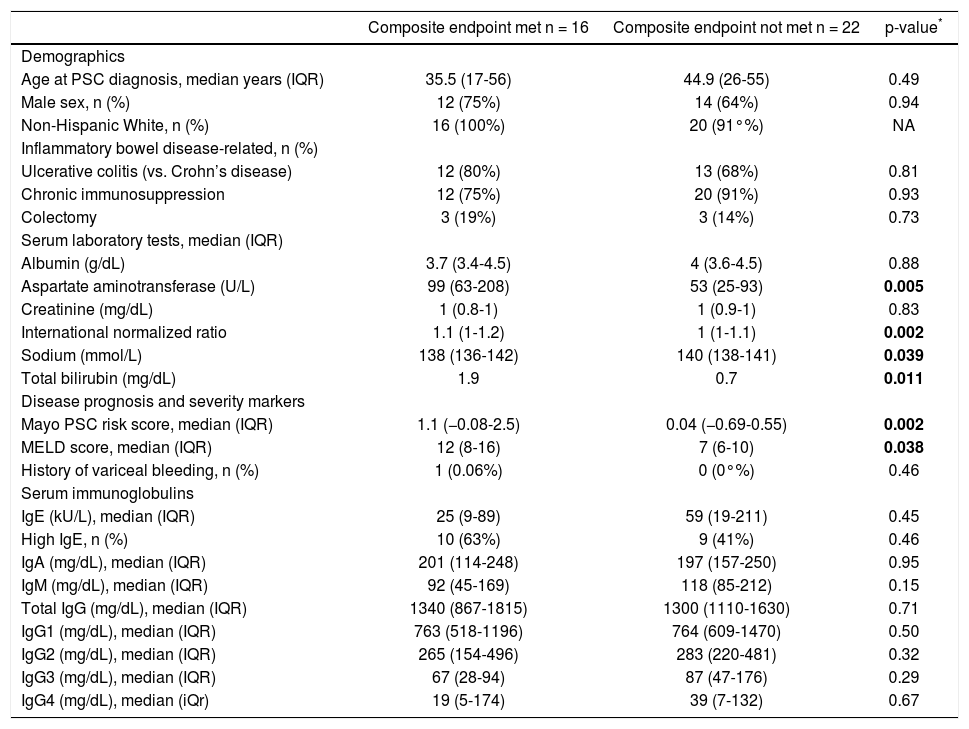
Patients who did (n = 16) and who did not (n = 22) experience the composite endpoint had similar baseline characteristics, including serum IgE level (Table 2). Furthermore, IgE level was not a significant predictor of time to the composite endpoint in univariate analysis, while serum AST, INR, sodium, bilirubin, and Mayo PSC risk and MELD score were (Table 2).
Characteristics of PSC patients who did and did not meet the composite endpoint.
| Composite endpoint met n = 16 | Composite endpoint not met n = 22 | p-value* | |
|---|---|---|---|
| Demographics | |||
| Age at PSC diagnosis, median years (IQR) | 35.5 (17-56) | 44.9 (26-55) | 0.49 |
| Male sex, n (%) | 12 (75%) | 14 (64%) | 0.94 |
| Non-Hispanic White, n (%) | 16 (100%) | 20 (91°%) | NA |
| Inflammatory bowel disease-related, n (%) | |||
| Ulcerative colitis (vs. Crohn’s disease) | 12 (80%) | 13 (68%) | 0.81 |
| Chronic immunosuppression | 12 (75%) | 20 (91%) | 0.93 |
| Colectomy | 3 (19%) | 3 (14%) | 0.73 |
| Serum laboratory tests, median (IQR) | |||
| Albumin (g/dL) | 3.7 (3.4-4.5) | 4 (3.6-4.5) | 0.88 |
| Aspartate aminotransferase (U/L) | 99 (63-208) | 53 (25-93) | 0.005 |
| Creatinine (mg/dL) | 1 (0.8-1) | 1 (0.9-1) | 0.83 |
| International normalized ratio | 1.1 (1-1.2) | 1 (1-1.1) | 0.002 |
| Sodium (mmol/L) | 138 (136-142) | 140 (138-141) | 0.039 |
| Total bilirubin (mg/dL) | 1.9 | 0.7 | 0.011 |
| Disease prognosis and severity markers | |||
| Mayo PSC risk score, median (IQR) | 1.1 (−0.08-2.5) | 0.04 (−0.69-0.55) | 0.002 |
| MELD score, median (IQR) | 12 (8-16) | 7 (6-10) | 0.038 |
| History of variceal bleeding, n (%) | 1 (0.06%) | 0 (0°%) | 0.46 |
| Serum immunoglobulins | |||
| IgE (kU/L), median (IQR) | 25 (9-89) | 59 (19-211) | 0.45 |
| High IgE, n (%) | 10 (63%) | 9 (41%) | 0.46 |
| IgA (mg/dL), median (IQR) | 201 (114-248) | 197 (157-250) | 0.95 |
| IgM (mg/dL), median (IQR) | 92 (45-169) | 118 (85-212) | 0.15 |
| Total IgG (mg/dL), median (IQR) | 1340 (867-1815) | 1300 (1110-1630) | 0.71 |
| IgG1 (mg/dL), median (IQR) | 763 (518-1196) | 764 (609-1470) | 0.50 |
| IgG2 (mg/dL), median (IQR) | 265 (154-496) | 283 (220-481) | 0.32 |
| IgG3 (mg/dL), median (IQR) | 67 (28-94) | 87 (47-176) | 0.29 |
| IgG4 (mg/dL), median (iQr) | 19 (5-174) | 39 (7-132) | 0.67 |
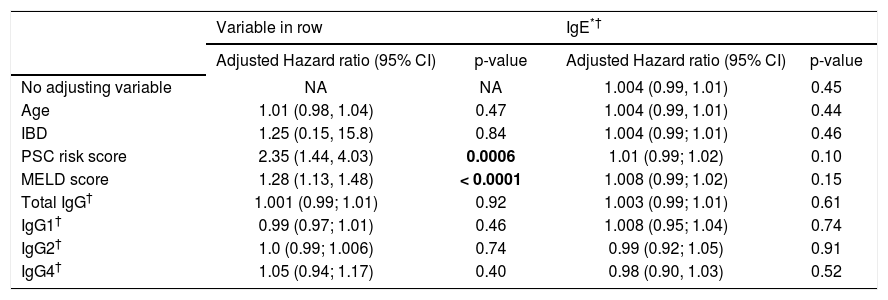
In multivariate analysis, IgE level was not a significant predictor of time to the composite endpoint in any of the models assessed and regardless of the IgE cutoff used (Table 3). Mayo PSC risk score and MELD score were the only significant predictors of the composite endpoint.
Multivariate models for predicting time to composite endpoint.
| Variable in row | IgE*† | |||
|---|---|---|---|---|
| Adjusted Hazard ratio (95% CI) | p-value | Adjusted Hazard ratio (95% CI) | p-value | |
| No adjusting variable | NA | NA | 1.004 (0.99, 1.01) | 0.45 |
| Age | 1.01 (0.98, 1.04) | 0.47 | 1.004 (0.99, 1.01) | 0.44 |
| IBD | 1.25 (0.15, 15.8) | 0.84 | 1.004 (0.99; 1.01) | 0.46 |
| PSC risk score | 2.35 (1.44, 4.03) | 0.0006 | 1.01 (0.99; 1.02) | 0.10 |
| MELD score | 1.28 (1.13, 1.48) | < 0.0001 | 1.008 (0.99; 1.02) | 0.15 |
| Total IgG† | 1.001 (0.99; 1.01) | 0.92 | 1.003 (0.99; 1.01) | 0.61 |
| IgG1† | 0.99 (0.97; 1.01) | 0.46 | 1.008 (0.95; 1.04) | 0.74 |
| IgG2† | 1.0 (0.99; 1.006) | 0.74 | 0.99 (0.92; 1.05) | 0.91 |
| IgG4† | 1.05 (0.94; 1.17) | 0.40 | 0.98 (0.90, 1.03) | 0.52 |
Each row represents a separate Cox proportional-hazards model including IgE and the variable shown on that row of the table. Variables adjusted for were determined a priori as described in the statistical analysis section; laboratory tests incorporated in the PSC risk score (e.g. aspartate aminotransferase) and MELD score (e.g. total bilirubin) were not included individually.
PSC is a complex, heterogeneous disorder with variable clinical course which carries a 15-20% lifetime occurrence of CCA.5,14 Annual CCA surveillance is recommended for patients with PSC given the paucity of reliable predictors,4 but methods to better identify those at highest risk of developing CCA could improve existing surveillance strategies. Here we aimed to determine whether Western PSC patients with low serum IgE level may represent a unique subset with a higher risk of CCA and other adverse endpoints. Our results suggest that among USA-based PSC patients:
- •
Those with low serum IgE differ from those with high IgE with respect to total IgG, IgG1, IgG2, and IgG4 but not other biochemical or clinical variables.
- •
Serum IgE level is not a significant predictor of time to the composite endpoint of CCA, LT, or death or to CCA alone, and
- •
Time to the composite endpoint is predicted by Mayo PSC risk score and MELD score.
To date, few studies of (non-IgG4) Ig levels in patients with PSC exist.15 Elevated serum IgM, IgA, and total IgG was found in 45, 10, and 25% of 20 PSC patients, respectively, over 30 years ago.16 Another study found a subset to have elevated IgG1,17 and two recent studies have found elevated serum IgE levels in 38-42% of PSC patients.9,18 These elevations can be observed irrespective of allergic or immune-mediated diseases.9 Although the relevance of these Ig isotype and subclass hyperglobulinemias remain uncertain, it is conceivable that some may potentially have as of yet unrecognized prognostic and/or pathophysiologic implications in PSC.20,21
In this study, we focused on IgE given the recent report that PSC patients with low serum IgE may represent a subgroup with increased risk of CCA.9 We, however, found no significant association between serum IgE and time to CCA, LT, or death or to CCA alone. This discrepancy may be due to several factors, including geographic differences seen in various aspects of PSC (e.g. human leukocyte antigen variations, IBD)1,19 and small sample size; indeed, unlike in our study, proportional-hazards analysis of the association between IgE and CCA was not performed in the previous study9 due to the limited number of events, and thus the unadjusted/ adjusted hazard ratios associated with IgE level and time to event were not determined therein. With that in mind, we too observed what appeared to possibly be a trend toward a difference in endpoints based on raw proportions, but this did not persist in the more relevant time-to-event analyses.
It is noteworthy that patients in the low IgE group also had significantly lower total IgG, IgG1, IgG3, and IgG4 (Table 1); although the clinical significance of these differences remains unknown, they raise the question as to whether the increased CCA incidence attributed to low serum IgE levels in the prior study was potentially driven by confounding variables, such as other Ig levels, which weren’t assessed in said study.9 Indeed, in an exploratory analysis, we found that of all the Igs evaluated, IgG1 had the strongest association with time to CCA (HR 0.97, 95% CI 0.92-1.0, p = 0.060). More CCA events and larger sample size will be needed, however, to further explore this observation.
There are several limitations to this study. The first is its retrospective design. Secondly, albeit representing the largest study of serum IgE levels in Western patients with PSC, sample size remained small and is a reflection of the rarity of PSC and the lack of widely-available IgE values among these patients; as a result, statistical power was limited. Nonetheless, the findings of this study are important and suggest that the prior findings among Japanese patients with PSC should not yet be applied to practice, particularly among Western cohorts, until more data are available. Lastly, our results come from a tertiary care center and may not be generalizable to other patient care settings.
In summary, serum IgE appears to be associated with some IgG subclasses but does not predict time to CCA, LT, or death in US patients with PSC. These outcomes can be predicted with the Mayo PSC risk and MELD scores. Prospective studies are needed to better delineate the potentially complex relationship between serum Igs and the pathogenesis and outcomes of PSC and to identify more specific biomarkers of CCA.
Abbreviations- •
AST: aspartate aminotransferase.
- •
CCA: cholangiocarcinoma.
- •
Ig: immunoglobulin.
- •
INR: international normalized ratio.
- •
LT: liver transplant.
- •
MELD: model for endstage liver disease.
- •
PSC: primary sclerosing cholangitis.
National Institutes of Health T32 training grant (T32DK007198) support for J.H.T. and National Center for Advancing Translational Sciences grant (UL1TR000135, to the Mayo Center for Clinical and Translational Sciences).
DisclosuresThe abstract herein has been presented at the 2013 American College of Gastroenterology meeting in San Diego, CA. No other relevant disclosures or conflicts of interest.


