


Although many studies have tried to clarify the association between hepatitis C virus (HCV) infection and metabolic syndrome, few studies have comprehensively assessed their relationship stratified by different demographic characteristics. We aimed to investigate the correlation between metabolic syndrome and anti-HCV seropositivity in Taiwan. This study enrolled consecutive subjects who had received health check-up services at Taipei Veterans General Hospital from 2002 to 2009. Metabolic syndrome was diagnosed according to the criteria defined by the International Diabetes Federation Task Force on Epidemiology and Prevention. Among the 30616 subjects enrolled in this study, the prevalence of positive anti-HCV serology was 2.7%, and 28.8% were diagnosed with metabolic syndrome. By multivariate analysis, metabolic syndrome was associated with higher body mass index, older age, male sex, a higher level of alanine aminotransferase, gamma-glutamyltransferase, platelet count and the presence of fatty liver whereas anti-HCV seropositivity was not an independent variable for metabolic syndrome. Further stratifying the subjects by age and sex, and there was still no significant difference in HCV status between those with and without metabolic syndrome. Moreover, the stage of liver fibrosis represented by aspartate aminotransferase to platelet ratio index was also not correlated with metabolic syndrome in the subjects with anti-HCV seropositivity. In conclusion, although subjects with anti-HCV seropositivity had higher fasting glucose levels and lower cholesterol and triglyceride levels compared to those with negative anti-HCV test, anti-HCV seropositivity was not associated with metabolic syndrome based on the current diagnostic criteria irrespective of age, gender and the stage of hepatic fibrosis.
The prevalence of hepatitis C virus (HCV) infection has been estimated to be 1.6% in the US and to ranges from 1.6 to 19.6% in Taiwan.1,2 HCV infection may progress to cirrhosis and hepatocellular carcinoma (HCC),3 and has been reported to cause several extra-hepatic manifestations including mixed cryoglobulinemia, non-Hodgkin lymphoma, thyroid diseases, sialoadenitis, porphyria cutanea tarda and lichen planus.4 HCV has also been reported to induce metabolic disorders even in the absence of significant liver fibrosis.5,6
Insulin resistance is central to the metabolic syndrome, and the severity of obesity, serum levels of triglycerides (TG), and fasting glucose levels are included in the diagnostic criteria for metabolic syndrome.7–9 Molecular studies have provided insights into mechanisms by which HCV infection affects glucose tolerance, and lipid metabolism has also been reported to be related with HCV infection.10 The HCV life cycle is known to depend on lipid metabolism, especially in the stages of replication, assembly and release.11 Moreover, HCV core protein has been reported to inhibit microsomal triglyceride transfer protein, which in turn reduces the secretion of very low density lipoprotein.11,12 A Taiwanese community study showed compatible results in that HCV infection was correlated with lower TG and cholesterol levels.13 Moreover, obesity and diabetes mellitus have been proven to play an important role in the progression of chronic HCV infection to HCC.14 Nevertheless, the Third National Health and Nutrition Examination Survey reported that HCV was not associated with metabolic syndrome, and a population based study also concluded that metabolic syndrome did not vary significantly by HCV status, while HCV infection with severe fibrosis of the liver was independently associated with metabolic syndrome in another study.15–17
Although many studies have tried to clarify the association between HCV infection and metabolic syndrome, very few studies have comprehensively focused on the relationship between HCV and metabolic syndrome by demographic variables such as age, sex and surrogate markers of liver fibrosis. The present study aimed to investigate the correlation between these two diseases in a large-scale cohort in Taiwan.
Material and MethodsStudy populationIn total, 34,346 subjects received health check-up services provided by the internists in the Healthcare Center without hospitalization at the Taipei Veterans General Hospital from 2002 to 2009.18 Those who had hepatitis B virus (HBV) infection and HBV/HCV dual infections were excluded, and the remaining 30,616 subjects were included in the final analysis (Figure 1). All of them received complete clinical evaluations, laboratory examinations and abdominal sonography. Body mass index (BMI) was calculated as the body weight (in kilograms) divided by the square of body height (in meters). Blood pressure (BP) was measured after the subjects had been seated for more than 5 min. The means of three consecutive readings were recorded as systolic and diastolic BP with a difference in systolic BP < 10 mmHg. Three of the following five abnormal findings were required for a diagnosis of metabolic syndrome according to the joint interim statement of the International Diabetes Federation Task Force on Epidemiology and Prevention:8
- •
Elevated waist circumference (WC, men ≥ 90 cm or women ≥ 80 cm).
- •
TG ≥ 150 mg/dL.
- •
Low high-density lipoprotein-cholesterol (HDL) (men < 40 mg/dL or women < 50 mg/dL).
- •
Systolic BP ≥ 130 mmHg and/or diastolic BP ≥ 85 mmHg; and
- •
Fasting glucose ≥ 100 mg/dL.

Aspartate aminotransferase (AST) to platelet ratio index (APRI) was calculated as:
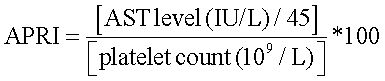
To represent the liver fibrosis.19
An APRI value of more than 0.7 represented significant fibrosis, and more than 1 represented severe fibrosis or cirrhosis.20 Ultrasonography with Aloka SSD 4000, 5000 and Philips HD15 was used to diagnose fatty liver by the practice guideline of the American Gastroenterological Association.21
This study followed the standards of the Declaration of Helsinki and was approved by the Institutional Review Board of Taipei Veterans General Hospital. As the dataset used in this study consisted of de-identified data from a retrospective cohort, the requirement for written informed consent was waived.
Biochemical and serological markersVenous blood samples were collected after an overnight fast. A radioimmunoassay (Abbott Laboratories, North Chicago, IL, USA) was used to test for serum HBV surface antigen (HBsAg), and a second-generation enzyme immunoassay (Abbott Laboratories) was used to test for antibodies to HCV (anti-HCV). The serum biochemical markers were measured with a Roche/Hitachi Modular Analytics System (Roche Diagnostics GmbH, Mannheim, Germany).
Statistical analysisThe study cohort was first stratified by anti-HCV seropositivity and metabolic syndrome, and then further by age and sex. Pearson chi-squared and Student t-test analysis was performed to compare categorical and continuous variables with two samples, respectively. Variables with a P value < 0.1 in univariate analysis were included into multivariate analysis using a logistic regression model with the forward stepwise selection procedure. A P value < 0.05 was considered to be statistically significant.
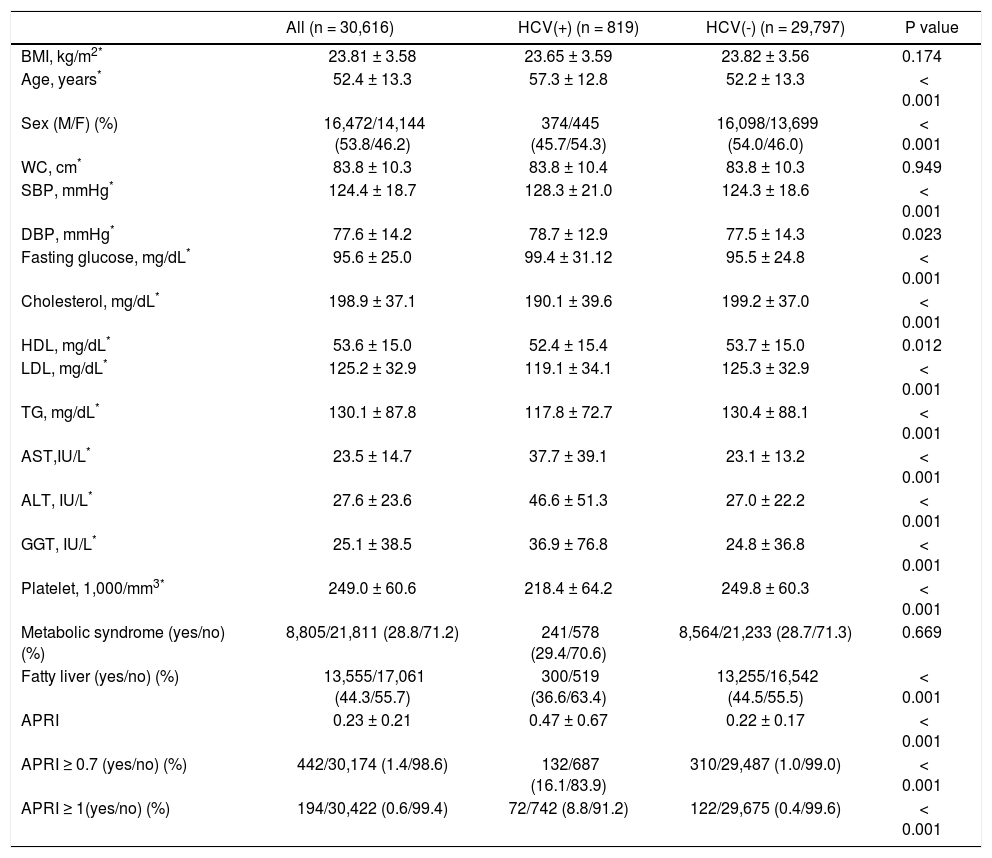
ResultsSubject characteristics stratified by anti-HCV seropositivityThe demographic data of all subjects are summarized in table 1. The mean age of the whole population was 52.4 years, with a male prevalence rate of 53.8%. Metabolic syndrome was diagnosed in 28.8% of the whole population. Patients with anti-HCV were older in age and more predominantly female, with higher serum alanine aminotransferase (ALT), AST, gamma-glutamyltransferase (GGT), and higher fasting glucose levels, higher systolic and diastolic BP, and lower cholesterol, HDL, low-density lipoprotein (LDL), TG levels, and lower platelet count, and a lower rate of fatty liver. APRI, a noninvasive serum marker for the stage of hepatic fibrosis, was significantly higher in the patients with anti-HCV, and more significant and severe fibrosis was also found in the HCV patients. However, the rates of metabolic syndrome were comparable between the HCV and non-HCV groups (29.4 vs. 28.7%, p = 0.669) (Figure 2A).
Factors associated with HCV and non-HCV subjects.
| All (n = 30,616) | HCV(+) (n = 819) | HCV(-) (n = 29,797) | P value | |
|---|---|---|---|---|
| BMI, kg/m2* | 23.81 ± 3.58 | 23.65 ± 3.59 | 23.82 ± 3.56 | 0.174 |
| Age, years* | 52.4 ± 13.3 | 57.3 ± 12.8 | 52.2 ± 13.3 | < 0.001 |
| Sex (M/F) (%) | 16,472/14,144 (53.8/46.2) | 374/445 (45.7/54.3) | 16,098/13,699 (54.0/46.0) | < 0.001 |
| WC, cm* | 83.8 ± 10.3 | 83.8 ± 10.4 | 83.8 ± 10.3 | 0.949 |
| SBP, mmHg* | 124.4 ± 18.7 | 128.3 ± 21.0 | 124.3 ± 18.6 | < 0.001 |
| DBP, mmHg* | 77.6 ± 14.2 | 78.7 ± 12.9 | 77.5 ± 14.3 | 0.023 |
| Fasting glucose, mg/dL* | 95.6 ± 25.0 | 99.4 ± 31.12 | 95.5 ± 24.8 | < 0.001 |
| Cholesterol, mg/dL* | 198.9 ± 37.1 | 190.1 ± 39.6 | 199.2 ± 37.0 | < 0.001 |
| HDL, mg/dL* | 53.6 ± 15.0 | 52.4 ± 15.4 | 53.7 ± 15.0 | 0.012 |
| LDL, mg/dL* | 125.2 ± 32.9 | 119.1 ± 34.1 | 125.3 ± 32.9 | < 0.001 |
| TG, mg/dL* | 130.1 ± 87.8 | 117.8 ± 72.7 | 130.4 ± 88.1 | < 0.001 |
| AST,IU/L* | 23.5 ± 14.7 | 37.7 ± 39.1 | 23.1 ± 13.2 | < 0.001 |
| ALT, IU/L* | 27.6 ± 23.6 | 46.6 ± 51.3 | 27.0 ± 22.2 | < 0.001 |
| GGT, IU/L* | 25.1 ± 38.5 | 36.9 ± 76.8 | 24.8 ± 36.8 | < 0.001 |
| Platelet, 1,000/mm3* | 249.0 ± 60.6 | 218.4 ± 64.2 | 249.8 ± 60.3 | < 0.001 |
| Metabolic syndrome (yes/no) (%) | 8,805/21,811 (28.8/71.2) | 241/578 (29.4/70.6) | 8,564/21,233 (28.7/71.3) | 0.669 |
| Fatty liver (yes/no) (%) | 13,555/17,061 (44.3/55.7) | 300/519 (36.6/63.4) | 13,255/16,542 (44.5/55.5) | < 0.001 |
| APRI | 0.23 ± 0.21 | 0.47 ± 0.67 | 0.22 ± 0.17 | < 0.001 |
| APRI ≥ 0.7 (yes/no) (%) | 442/30,174 (1.4/98.6) | 132/687 (16.1/83.9) | 310/29,487 (1.0/99.0) | < 0.001 |
| APRI ≥ 1(yes/no) (%) | 194/30,422 (0.6/99.4) | 72/742 (8.8/91.2) | 122/29,675 (0.4/99.6) | < 0.001 |
HCV: hepatitis C virus. BMI: body mass index. M: male. F: female. WC: waist circumference. SBP: systolic blood pressure. DBP: diastolic blood pressure. HDL: high-density lipoprotein. LDL: low-density lipoprotein. TG: triglyceride. AST: aspartate aminotransferase. ALT: alanine aminotransferase. GGT: gamma-glutamyltransferase. APRI: AST to platelet ratio index.

A. Distribution of metabolic syndrome stratified by HCV status. The standard errors of HCV and metabolic syndrome patients in the whole population, in men, in women, in those aged over 50 years, and in those aged below 50 years were 0.016, 0.025, 0.019, 0.019, and 0.025, respectively. * In the multivariate analysis, the P value of metabolic syndrome by HCV status in women was 0.136. B. Distribution of metabolic syndrome stratified by APRI. The standard errors of those with metabolic syndrome and APRI ≥ 0.7 in the whole population, in men, in women, in those aged over 50 years, and in those aged below 50 years were 0.024, 0.030, 0.036, 0.027, and 0.050, respectively. The standard errors of those with metabolic syndrome and APRI < 0.7 in the whole population, in men, in women, in those aged over 50 years, and in those aged below 50 years were 0.003, 0.004, 0.003, 0.004, and 0.004, respectively. C. Distribution of metabolic syndrome in HCV patients stratified by APRI. The standard errors of those with metabolic syndrome and APRI ≥ 0.7 with positive anti HCV, in men, in women, in those aged over 50 years, and in those aged below 50 years with HCV infection were 0.041, 0.062, 0.048, 0.045, and 0.074, respectively. The standard errors of those with metabolic syndrome and APRI ≥ 0.7 with positive anti HCV, in men, in women, in those aged over 50 years, and in those aged below 50 years with HCV infection were 0.017, 0.027, 0.021, 0.022, and 0.026, respectively.
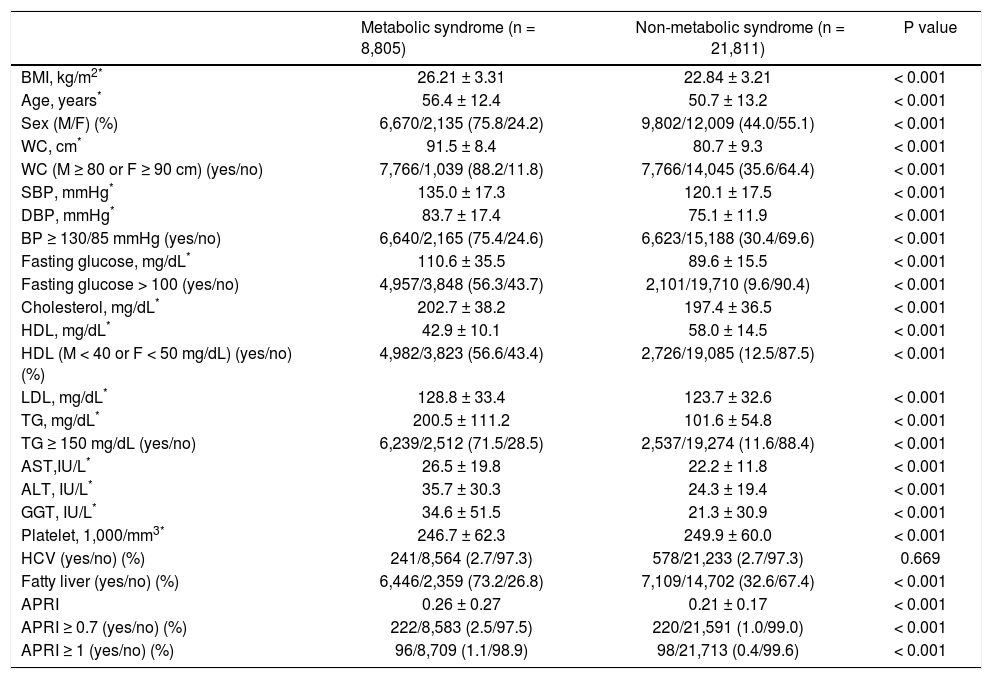
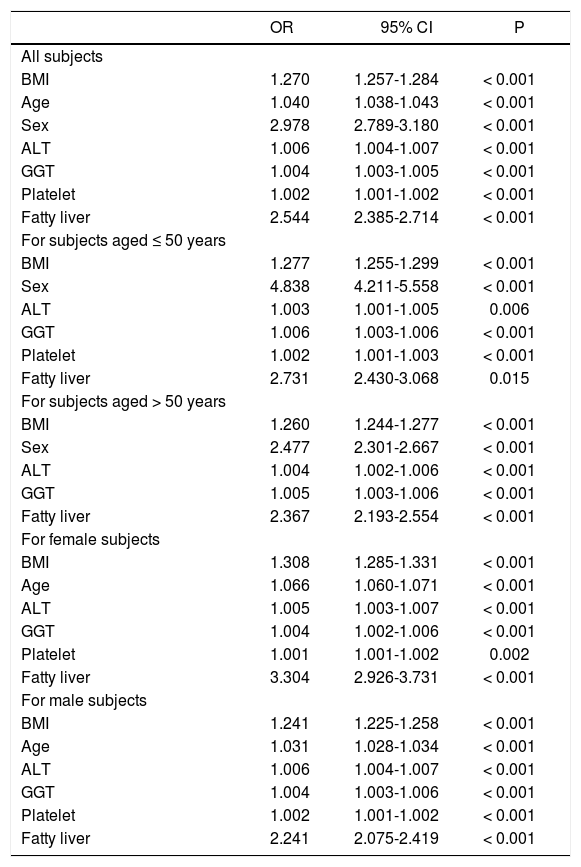
As shown in table 2, the subjects with metabolic syndrome were older in age, more male, with higher BMI, larger WC, higher systolic and diastolic BP, higher serum cholesterol, LDL, TG, ALT, AST, GGT, fasting glucose levels, and a higher rate of fatty liver but lower platelet count and serum HDL level compared to those without metabolic syndrome (all P < 0.001) The prevalence of anti-HCV positivity was similar among patients with and without metabolic syndrome. Multivariate analysis showed that higher BMI, older age, male sex, a higher level of ALT, GGT, platelet count and the presence of fatty liver were independent variables associated with metabolic syndrome (Table 3).
Characteristics between patients with and without metabolic syndrome.
| Metabolic syndrome (n = 8,805) | Non-metabolic syndrome (n = 21,811) | P value | |
|---|---|---|---|
| BMI, kg/m2* | 26.21 ± 3.31 | 22.84 ± 3.21 | < 0.001 |
| Age, years* | 56.4 ± 12.4 | 50.7 ± 13.2 | < 0.001 |
| Sex (M/F) (%) | 6,670/2,135 (75.8/24.2) | 9,802/12,009 (44.0/55.1) | < 0.001 |
| WC, cm* | 91.5 ± 8.4 | 80.7 ± 9.3 | < 0.001 |
| WC (M ≥ 80 or F ≥ 90 cm) (yes/no) | 7,766/1,039 (88.2/11.8) | 7,766/14,045 (35.6/64.4) | < 0.001 |
| SBP, mmHg* | 135.0 ± 17.3 | 120.1 ± 17.5 | < 0.001 |
| DBP, mmHg* | 83.7 ± 17.4 | 75.1 ± 11.9 | < 0.001 |
| BP ≥ 130/85 mmHg (yes/no) | 6,640/2,165 (75.4/24.6) | 6,623/15,188 (30.4/69.6) | < 0.001 |
| Fasting glucose, mg/dL* | 110.6 ± 35.5 | 89.6 ± 15.5 | < 0.001 |
| Fasting glucose > 100 (yes/no) | 4,957/3,848 (56.3/43.7) | 2,101/19,710 (9.6/90.4) | < 0.001 |
| Cholesterol, mg/dL* | 202.7 ± 38.2 | 197.4 ± 36.5 | < 0.001 |
| HDL, mg/dL* | 42.9 ± 10.1 | 58.0 ± 14.5 | < 0.001 |
| HDL (M < 40 or F < 50 mg/dL) (yes/no) (%) | 4,982/3,823 (56.6/43.4) | 2,726/19,085 (12.5/87.5) | < 0.001 |
| LDL, mg/dL* | 128.8 ± 33.4 | 123.7 ± 32.6 | < 0.001 |
| TG, mg/dL* | 200.5 ± 111.2 | 101.6 ± 54.8 | < 0.001 |
| TG ≥ 150 mg/dL (yes/no) | 6,239/2,512 (71.5/28.5) | 2,537/19,274 (11.6/88.4) | < 0.001 |
| AST,IU/L* | 26.5 ± 19.8 | 22.2 ± 11.8 | < 0.001 |
| ALT, IU/L* | 35.7 ± 30.3 | 24.3 ± 19.4 | < 0.001 |
| GGT, IU/L* | 34.6 ± 51.5 | 21.3 ± 30.9 | < 0.001 |
| Platelet, 1,000/mm3* | 246.7 ± 62.3 | 249.9 ± 60.0 | < 0.001 |
| HCV (yes/no) (%) | 241/8,564 (2.7/97.3) | 578/21,233 (2.7/97.3) | 0.669 |
| Fatty liver (yes/no) (%) | 6,446/2,359 (73.2/26.8) | 7,109/14,702 (32.6/67.4) | < 0.001 |
| APRI | 0.26 ± 0.27 | 0.21 ± 0.17 | < 0.001 |
| APRI ≥ 0.7 (yes/no) (%) | 222/8,583 (2.5/97.5) | 220/21,591 (1.0/99.0) | < 0.001 |
| APRI ≥ 1 (yes/no) (%) | 96/8,709 (1.1/98.9) | 98/21,713 (0.4/99.6) | < 0.001 |
BMI: body mass index. M: male. F: female. WC: waist circumference. SBP: systolic blood pressure. DBP: diastolic blood pressure. HDL: high-density lipoprotein. LDL: low-density lipoprotein. TG: triglyceride. AST: aspartate aminotransferase. ALT: alanine aminotransferase. GGT: gamma-glutamyltransferase.
Factors associated with metabolic syndrome in different populations by multivariate analysis
| OR | 95% CI | P | |
|---|---|---|---|
| All subjects | |||
| BMI | 1.270 | 1.257-1.284 | < 0.001 |
| Age | 1.040 | 1.038-1.043 | < 0.001 |
| Sex | 2.978 | 2.789-3.180 | < 0.001 |
| ALT | 1.006 | 1.004-1.007 | < 0.001 |
| GGT | 1.004 | 1.003-1.005 | < 0.001 |
| Platelet | 1.002 | 1.001-1.002 | < 0.001 |
| Fatty liver | 2.544 | 2.385-2.714 | < 0.001 |
| For subjects aged ≤ 50 years | |||
| BMI | 1.277 | 1.255-1.299 | < 0.001 |
| Sex | 4.838 | 4.211-5.558 | < 0.001 |
| ALT | 1.003 | 1.001-1.005 | 0.006 |
| GGT | 1.006 | 1.003-1.006 | < 0.001 |
| Platelet | 1.002 | 1.001-1.003 | < 0.001 |
| Fatty liver | 2.731 | 2.430-3.068 | 0.015 |
| For subjects aged > 50 years | |||
| BMI | 1.260 | 1.244-1.277 | < 0.001 |
| Sex | 2.477 | 2.301-2.667 | < 0.001 |
| ALT | 1.004 | 1.002-1.006 | < 0.001 |
| GGT | 1.005 | 1.003-1.006 | < 0.001 |
| Fatty liver | 2.367 | 2.193-2.554 | < 0.001 |
| For female subjects | |||
| BMI | 1.308 | 1.285-1.331 | < 0.001 |
| Age | 1.066 | 1.060-1.071 | < 0.001 |
| ALT | 1.005 | 1.003-1.007 | < 0.001 |
| GGT | 1.004 | 1.002-1.006 | < 0.001 |
| Platelet | 1.001 | 1.001-1.002 | 0.002 |
| Fatty liver | 3.304 | 2.926-3.731 | < 0.001 |
| For male subjects | |||
| BMI | 1.241 | 1.225-1.258 | < 0.001 |
| Age | 1.031 | 1.028-1.034 | < 0.001 |
| ALT | 1.006 | 1.004-1.007 | < 0.001 |
| GGT | 1.004 | 1.003-1.006 | < 0.001 |
| Platelet | 1.002 | 1.001-1.002 | < 0.001 |
| Fatty liver | 2.241 | 2.075-2.419 | < 0.001 |
BMI: body mass index. ALT: alanine aminotransferase. GGT: gamma-glutamyltransferase.
The significant hepatic fibrosis represented by the surrogate marker, APRI, was not associated with metabolic syndrome as shown in figure 2B. Subgroup analysis also showed that the significant fibrosis defined as APRI > 0.7 was not correlated with metabolic syndrome irrespective of age or gender.
Correlation of anti-HCV and metabolic syndrome stratified by age, sex, and stage of hepatic fibrosisSubsequently, we further assessed the association of anti-HCV seropositivity with metabolic syndrome stratified by age, gender and the stage of hepatic fibrosis. The results showed that metabolic factors, but not positive anti-HCV, were associated with metabolic syndrome whether the patients were over or under the age of 50 years (Figure 2A and Table 3). Similarly, for male subjects, the prevalence rates of metabolic syndrome were comparable between those with and without positive anti-HCV serology. For the female subjects, although those with HCV antibody had a higher rate of metabolic syndrome than those without HCV antibody in univariate analysis, anti-HCV seropositivity had insignificant difference between patients with or without metabolic syndrome in multivariate analysis.
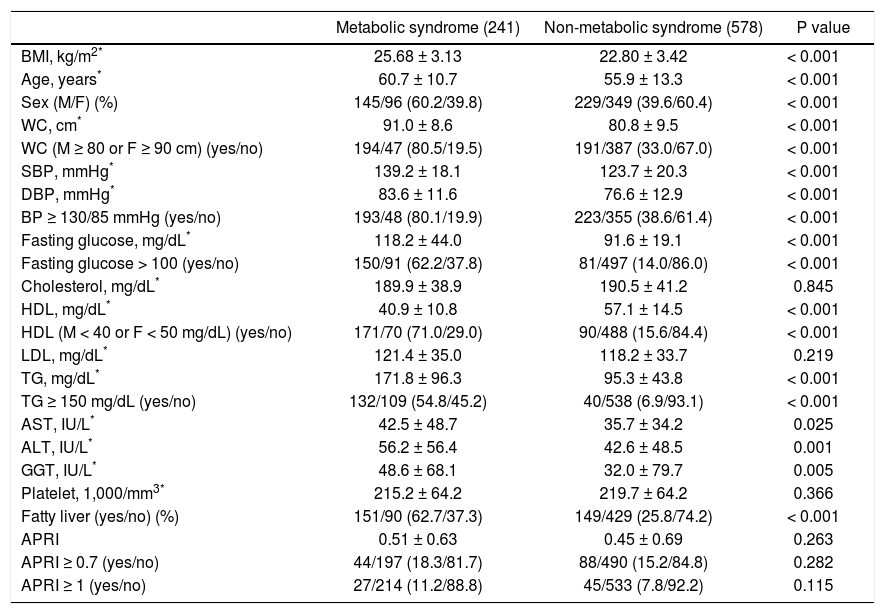
Factors associated with metabolic syndrome in patients with positive HCV antibodyPatients with positive anti-HCV serology were further selected to analyze the association of metabolic syndrome and other factors. The prevalence of metabolic syndrome in those with anti-HCV seropositivity was 29.4%. The results showed that the patients with anti-HCV seropositivity with metabolic syndrome were older in age, more predominantly male, with higher BMI, larger WC, higher systolic and diastolic BP, and higher serum LDL, TG, ALT, AST, GGT, fasting glucose levels, and a higher rate of fatty liver, but lower platelet count and HDL (Table 4). The average APRI was slightly higher in the patients with metabolic syndrome, although this difference did not reach statistical significance. In addition, there was no difference in significant and severe fibrosis, represented by APRI ≥ 0.7 and ≥ 1, respectively, between the patients with and without metabolic syndrome. After stratifying the patients by gender, the P values of metabolic syndrome between APRI ≥ 0.7 and < 0.7 in men and women were 0.801 and 0.593, respectively. In age stratification, there was no difference in metabolic syndrome by APRI value between the patients aged over or less than 50 years (Figure 2C).
Characteristics between HCV patients with and without metabolic syndrome.
| Metabolic syndrome (241) | Non-metabolic syndrome (578) | P value | |
|---|---|---|---|
| BMI, kg/m2* | 25.68 ± 3.13 | 22.80 ± 3.42 | < 0.001 |
| Age, years* | 60.7 ± 10.7 | 55.9 ± 13.3 | < 0.001 |
| Sex (M/F) (%) | 145/96 (60.2/39.8) | 229/349 (39.6/60.4) | < 0.001 |
| WC, cm* | 91.0 ± 8.6 | 80.8 ± 9.5 | < 0.001 |
| WC (M ≥ 80 or F ≥ 90 cm) (yes/no) | 194/47 (80.5/19.5) | 191/387 (33.0/67.0) | < 0.001 |
| SBP, mmHg* | 139.2 ± 18.1 | 123.7 ± 20.3 | < 0.001 |
| DBP, mmHg* | 83.6 ± 11.6 | 76.6 ± 12.9 | < 0.001 |
| BP ≥ 130/85 mmHg (yes/no) | 193/48 (80.1/19.9) | 223/355 (38.6/61.4) | < 0.001 |
| Fasting glucose, mg/dL* | 118.2 ± 44.0 | 91.6 ± 19.1 | < 0.001 |
| Fasting glucose > 100 (yes/no) | 150/91 (62.2/37.8) | 81/497 (14.0/86.0) | < 0.001 |
| Cholesterol, mg/dL* | 189.9 ± 38.9 | 190.5 ± 41.2 | 0.845 |
| HDL, mg/dL* | 40.9 ± 10.8 | 57.1 ± 14.5 | < 0.001 |
| HDL (M < 40 or F < 50 mg/dL) (yes/no) | 171/70 (71.0/29.0) | 90/488 (15.6/84.4) | < 0.001 |
| LDL, mg/dL* | 121.4 ± 35.0 | 118.2 ± 33.7 | 0.219 |
| TG, mg/dL* | 171.8 ± 96.3 | 95.3 ± 43.8 | < 0.001 |
| TG ≥ 150 mg/dL (yes/no) | 132/109 (54.8/45.2) | 40/538 (6.9/93.1) | < 0.001 |
| AST, IU/L* | 42.5 ± 48.7 | 35.7 ± 34.2 | 0.025 |
| ALT, IU/L* | 56.2 ± 56.4 | 42.6 ± 48.5 | 0.001 |
| GGT, IU/L* | 48.6 ± 68.1 | 32.0 ± 79.7 | 0.005 |
| Platelet, 1,000/mm3* | 215.2 ± 64.2 | 219.7 ± 64.2 | 0.366 |
| Fatty liver (yes/no) (%) | 151/90 (62.7/37.3) | 149/429 (25.8/74.2) | < 0.001 |
| APRI | 0.51 ± 0.63 | 0.45 ± 0.69 | 0.263 |
| APRI ≥ 0.7 (yes/no) | 44/197 (18.3/81.7) | 88/490 (15.2/84.8) | 0.282 |
| APRI ≥ 1 (yes/no) | 27/214 (11.2/88.8) | 45/533 (7.8/92.2) | 0.115 |
HCV: hepatitis C virus. BMI: body mass index. M: male. F: female. WC: waist circumference. SBP: systolic blood pressure. DBP: diastolic blood pressure. HDL: high-density lipoprotein. LDL: low-density lipoprotein. TG: triglyceride. AST: aspartate aminotransferase. ALT: alanine aminotransferase. GGT: gamma-glutamyltransferase. APRI: AST to platelet ratio index.
HCV has been proven to induce insulin resistance by many molecular pathways, such as activation of proteasome activator 28 γ and upregulation of protein phosphatase 2A.10,22 Insulin resistance is also considered as the main pathogenic factor in the development of other features of metabolic syndrome carrying a cardiovascular risk.7 However, the association between HCV infection, hepatic fibrosis and metabolic syndrome is still unclear.16 In the present study, we observed no significant association between anti-HCV seropositivity and metabolic syndrome, although HCV was related with some metabolic derangements such as higher fasting glucose levels and lower cholesterol and TG levels. Moreover, the stage of hepatic fibrosis represented by APRI was also unrelated to metabolic syndrome.
The prevalence of serum anti-HCV in the United States has been reported to be 1.6%, with 85% of those cases having HCV viremia, while the seroprevalence rate of HCV antibodies in Taiwan has been reported to range from 1.6 to 19.6% depending on the area.1,2 The prevalence of anti-HCV in the present study was 2.7%, which is compatible with the previous studies. Lipid metabolism is crucial in the production of HCV particles, especially in the stages of replication and assembly.11,23 Perlemuter, et al. showed that HCV has the ability to influence lipid metabolism by inhibiting microsomal TG transfer protein activity and very low-density lipoprotein secretion from the liver, thereby reducing levels of serum TG.12 One population-based study from Taiwan also demonstrated that patients with HCV viremia have significantly lower serum cholesterol and triglyceride levels.13 In the current cohort composed of healthy subjects receiving health check-up services, lower levels of cholesterol and TG in the subjects with anti-HCV seropositivity were also observed.
The prevalence of metabolic syndrome in the USA has been reported to be 27% in those aged more than 25 years,24 and approximately 12% between 1999 and 2002 in Taiwan.17 However, the prevalence of metabolic syndrome was much higher in the current study (28%), which may be due to westernization of diet, greater awareness of the syndrome, or higher socioeconomic status of the subjects.
HCV is known to affect glucose homeostasis by inducing insulin resistance even in the absence of significant liver fibrosis,5 and the fasting glucose levels in the current study were actually higher in the HCV patients. In addition, insulin resistance is known to play a major role in metabolic syndrome.7 Nevertheless, the association between HCV infection and metabolic syndrome is still controversial. Lonardo, et al. suggested the condition that HCV patients suffer from insulin resistance but are spared from metabolic syndrome may be related with the current diagnostic criteria of metabolic syndrome even though both diseases (HCV infection and metabolic syndrome) are correlated with insulin resistance.25 The results from the NHANES III study also showed that the prevalence of metabolic syndrome did not vary by HCV status.16 In the current study, the prevalence of metabolic syndrome did not significantly differ by the presence of HCV antibody, and the prevalence of antibody to HCV did not significantly vary by the presence of metabolic syndrome (Tables 1 and 2). After stratification by age and gender, the association between anti-HCV seropositivity and metabolic syndrome was still insignificant (Figure 2).
Liver biopsy is still the gold standard for the assessment of liver histology, however it carries the risks of complications and sampling errors.26,27 Accordingly, APRI was developed to evaluate the severity of fibrosis in HCV patients.19 In stratification by HCV status in the current study, the results showed that the APRI value did not vary significantly by the status of metabolic syndrome, and that significant and severe fibrosis was not associated with metabolic syndrome in the patients with positive anti-HCV.
The strengths of this study are the large sample size and detailed biochemistry data. However, there are several limitations. First, the study population had a higher socioeconomic status and could afford the expense of a physical check-up so the results may not represent the general population. Besides, the result can only apply to the set of infected individuals who are asymptomatic, and thus it may not represent the group of symptomatic or already diagnosed patients. This group may be smaller in number, but represent what we are seeing in our clinics. Second, the dataset did not document medication uses. Nevertheless drug-induced liver injury is rare both in Taiwan and in Western countries, with an incidence of only 14 cases per 100,000 inhabitants per year in a population-based prospective study.28,29 This suggests that taking medication may have had little influence on the results. Third, the gold standard for the assessment of liver histology is liver biopsy. However, the invasiveness of that procedure is not justified for surveillance in the general population. Therefore, we used the APRI to represent the severity of liver fibrosis. Fourth, our study is cross-sectional, so the prognosis of the population was unattainable. Fifth, a second generation enzyme immunoassay was utilized to test the antibody of HCV, and the proportion of false-positive results would be high in a population with anti-HCV prevalence lower than 10% even though the test carried specificity near 99%.30,31 Furthermore, the lack of HCV RNA impeded the distinction whether patients had spontaneous resolution or were chronically infected of HCV. HCV genotypes were not tested in the study as well. These limitations led to difficulty in further analysis with regard to these viral factors.
ConclusionIn conclusion, although subjects with anti-HCV had higher fasting glucose levels and lower cholesterol and TG levels compared to those without anti-HCV, anti-HCV seropositivity was not associated with metabolic syndrome based on the current diagnostic criteria irrespective of age, gender and the stage of hepatic fibrosis.
Disclosure of InterestThe authors declare that they have no conflicts of interest concerning this article.
There are no potential conflicts of interest involved in this paper.
Grant SupportThis study was supported by grants from the National Science Council (NSC 101-2314-B-075-014) and Taipei Veterans General Hospital (V102C-151).
Author ContributionYuan-Lung Cheng: study concept and design; analysis and interpretation of data; drafting of the manuscript; Yuan-Chen Wang: study concept and design; analysis and interpretation of data; Keng-Hsin Lan: study concept and design; analysis and interpretation of data; critical revision of the manuscript for important intellectual content and final drafting of the manuscript; Teh-Ia Huo: study concept and design, valuable discussion and support; Yi-Hsiang Huang: study concept and design, valuable discussion; Chien-Wei Su: overall study concept and design; analysis and interpretation of data; drafting of the manuscript; critical revision of the manuscript for important intellectual content and final drafting of the manuscript; Han-Chieh Lin: study concept and design, valuable discussion and support; Fa-Yauh Lee: study concept and design, valuable discussion and support; Jaw-Ching Wu: overall study concept and design; valuable discussion and support; Shou-Dong Lee: study concept and design, valuable discussion and support.


