


Quantitative digital imaging analysis to evaluate liver fibrosis is accurate, but its clinical use is limited by its high cost and lack of standardization. We aimed to validate an inexpensive digital imaging analysis technique for fibrosis quantification in chronic hepatitis B patients.
Material and methodsIn total, 142 chronic hepatitis B patients who underwent liver biopsy and analysis of serum fibrosis markers were included. Images of Sirius red stain sections were captured and processed using Adobe Photoshop CS3 software. The percentage of fibrosis (fibrosis index) was determined by the ratio of the fibrosis area to the total sample area, expressed in pixels, and calculated automatically.
ResultsA strong correlation between the fibrosis index and the Ishak, Metavir, and Laennec histological staging systems were observed (r = 0.83, 0.86, and 0.84, respectively; p < 0.001). The cutoff value associated with cirrhosis was 7.7% with an area under the receiver operating characteristic curve (AUROC) of 0.95 (95% confidence interval [CI], 0.92-0.99, p < 0.001). Furthermore, the fibrosis index yielded a cutoff value of 8.9% (AUROC, 0.74; 95% CI, 0.66-0.86), 12% (AUROC, 0.84; 95% CI, 0.75-0.93), and 14% (AUROC, 0.97; 95% CI, 0.92-1.0) for the diagnosis of cirrhosis 4a, 4b, and 4c, respectively. No serum markers or fibrosis models were correlated with the fibrosis index in Metavir F2-F4.
ConclusionsThe present digital imaging analysis technique is reproducible and available worldwide, allowing its use in clinical practice, and can be considered as a complementary tool to traditional histological methods.
Hepatitis B virus (HBV) infection is a global health problem that causes a spectrum of conditions ranging from a clinically asymptomatic carrier to cirrhosis and complications, including hepatocellular carcinoma and end-stage liver disease.1,2 The accurate assessment of hepatic fibrosis is vital to determine antiviral treatment and prognosis. Currently, liver biopsy is still considered the gold standard for fibrosis staging. Histological staging systems such as the Ishak3 and Metavir4 scoring systems have been the reference standard to assess liver fibrosis for a long time. However, these traditional staging systems are semi-quantitative and have high rates of intra- and inter-observer variability. Moreover, important additional his-tological features, especially in advanced fibrosis and cirrhosis, may be ignored. For instance, in the setting of cirrhosis, nodular size and fibrous septa thickness, which were shown to be independently associated with the presence of clinically significant portal hypertension,5 were not evaluated in traditional staging systems. Understanding the potential value of additional information obtained by new histological methods is essential to better predict outcomes and individualize therapy.6
Recently, methods to quantify liver fibrosis through a computer-based technology, called quantitative digital image analysis (DIA), have been developed.7,8 DIA measures the collagen and remaining liver tissue areas and calculates the collagen proportional area (CPA), defined as the proportion of the biopsy area that is occupied by collagen. Unlike traditional histological staging systems, which mainly depend on the degree of architectural distortion, DIA measures the amount of fibrosis as a continuous vari-able.8,9 The advantage of this method is that DIA is truly a quantitative method and more reproducible as it is not influenced by the observer's visual interpretation.9 Recent data showed that in cirrhosis patients, the CPA could provide additional information regarding risk stratification for adverse clinical outcomes independent of the Metavir stage.10,11 This new technology has been applied to estimate liver fibrosis in chronic viral hepatitis patients.12,13 However, DIA has a high cost, and its use is usually limited to specialized centers. Therefore, there is a need to develop a more feasible DIA technique and thus broaden the clinical use of the CPA. Recently, Campos, et al.14 developed an inexpensive DIA technique for fibrosis quantification in chronic hepatitis C patients; however, this new method requires further validation.
The primary objective of the present study was to validate an inexpensive DIA technique for fibrosis quantification in liver biopsies of patients with chronic hepatitis B (CHB). The secondary objectives were to evaluate the correlations between this new CPA measurement and the Laennec19 (a modified Metavir system) and Ishak systems and to establish the cutoff values for sub-classifying cirrhosis.
Material and MethodsA total of 142 CHB patients from the Liver Center of Zhejiang People's Provincial Hospital who underwent liver biopsy between December 1, 2013 and December 1, 2015 were prospectively included. All patients meeting the following inclusion criteria were enrolled: age ≥ 18 years, diagnosis of CHB defined by positive hepatitis B virus surface antigen for more than 6 months and detectable HBV-DNA with a level > 2 x 10³ IU/mL, and no previous or concomitant anti-HBV therapy. Exclusion criteria were as follows: liver comorbidity including hepatitis delta superinfection, hepatitis C virus co-infection, chronic alcohol consumption (< 30 g of pure alcohol per day), Wilson disease, HIV co-infection, or autoimmune hepatitis. The study protocol was reviewed and approved by the ethics committee of our hospital. The present study was performed in accordance with the ethical standards laid down in the 1964 Declaration of Helsinki (as revised in Brazil 2013). Informed consent to participate in the study was obtained from each patient.
Liver biopsy and histological analysisAll patients underwent percutaneous liver biopsy guided by ultrasonography. Liver biopsies were performed using 16G biopsy needles. The specimens were fixed, paraffin-embedded, and stained with hematoxylin and eosin and Masson's trichrome. Staging was carried out according to the Ishak, Metavir, and Laennec fibrosis scoring system. In addition, tissue was cut and stained with Sirius red for image analysis. A minimum of 1.5 cm of liver tissue with at least 9 portal tracts was required for diagnosis. A single pathologist (G.Q.R.) blinded to the clinical data and DIA results evaluated all samples.
Digital imaging analysisThe digital imaging system consisted of a megapixels camera Picostage PSC603-20C (TianJian, China) attached by an adapter to a trinocular Nikon Ellipse-80i microscope (Nikon, Melville, NY, USA). Liver biopsies were stained with Sirius red. Each sample was digitalized in a sequential way, respecting the linear distribution of microscopic fields of the core needle biopsies, using a 40 x magnification objective. The images were captured using automatic adjustments for white and luminosity of the camera, with maximal resolution (3748 × 2736 pixels), and saved as 24-bit RGB images in joint photographic Experts Group (JPEG) format. Depending on the size of the sample, 6 to 12 images were captured and saved in folders identified with each sample number, in a personal computer. Using Adobe Photoshop (Adobe Corporation, San Jose, CA, USA), running in a Windows 7 environment, the folder containing the captured images of each individual biopsy was identified.
In the checkboxes, the options “Auto” in the “layout” space and blend images together in source fields and a wide panoramic image representing the entire area of the biopsy stain with Sirius red was constructed. The wide panoramic image was saved in JPEG format and represented a totally digitalized virtual image of the biopsy.
Using the command “extract” in the filters tool menu, the background and undesired elements such as the liver capsule and large portal tracts were extracted from the biopsy images as these did not represent disease-related collagen. Using the auto levels action, following the technique described by Campos, et al.14 Afterwards, the “selective color” command option was selected in the selective color dialogue box. The red and blue colors were chosen sequentially, and their green component was expanded to ≥ 50 and ≤ 170, while the red component was expanded to ≥ 50 and ≤ 255. The blue colors were selected, and the blue component was expanded to ≥ 0 and ≤ 255.
For the automatic calculation of the pixels corresponding to the total area of the sample, using the “magic wand tool”, the extracted background was selected. Using the command “select inverse”, the area corresponding to the biopsy tissue stained in green was selected. The histogram of the selected area, which represented the totality of pixels of the sample, comprised the total area of the digitalized biopsy in pixels. Next, similar commands were applied again, and all the red/magenta area of the sample, corresponding to the fibrosis tissue, was selected. The fi-brosis index (FI) was expressed as a percentage of red pixels to green pixels. The FI reproducibility was tested by repeating the analysis two times on one slide.
The result of this process is shown in figure 1. The FI was calculated as the total area of fibrosis divided by the area of the section multiplied by 100, as shown by Dahab, et al.20
Clinical data. Fibrosis area = 11,069 pixels. Total area = 74,854 pixels. Fibrosis index = 11,069 x 100/74854 = 14.79%.")
Clinical and laboratory data of patients, including age, sex, aspartate aminotransferase (AST), alanine aminotrans-ferase (ALT), alkaline phosphatase (ALP), gamma-glutamyl transferase (GGT), bilirubin, albumin, and complete blood counts, were obtained from the medical database. APRI results were calculated as AST (U/L)/up-per normal limit x 100/platelet count (109/L). FIB-4 results were calculated as age (years) x AST (U/L)/platelets (109/L) x ALT (U/L)1/2.
Statistical analysisThe correlation between the FI and the Metavir and Ishak stage was determined by Spearman's correlation coefficient. The correlation between the FI and serum fibrosis markers was determined by Pearson's correlation coefficient. The receiver operating characteristic (ROC) curve and area under the ROC curve (AUROC) were applied to establish the association between the FI and fibrosis stages. Statistical analysis was performed using SPSS for Windows (version 11.5; SPSS Inc., Chicago, IL, USA).
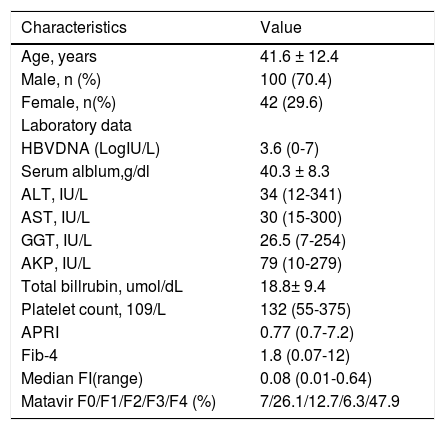
ResultsBaseline characteristicsA total of 142 patients were initially included, among whom 100 were men (70.4%) and 42 were women (29.6%), with a mean age of 42 years. Metavir F0, F1, F2, F3, and F4 was diagnosed in 7% (10/142), 26.1% (37/142), 12.7% (18/142), 6.3% (9/142), and 47.9% (68/142) of patients, respectively. All patient characteristics are summarized in table 1.
Patient characteristics.
| Characteristics | Value |
|---|---|
| Age, years | 41.6 ± 12.4 |
| Male, n (%) | 100 (70.4) |
| Female, n(%) | 42 (29.6) |
| Laboratory data | |
| HBVDNA (LogIU/L) | 3.6 (0-7) |
| Serum alblum,g/dl | 40.3 ± 8.3 |
| ALT, IU/L | 34 (12-341) |
| AST, IU/L | 30 (15-300) |
| GGT, IU/L | 26.5 (7-254) |
| AKP, IU/L | 79 (10-279) |
| Total billrubin, umol/dL | 18.8± 9.4 |
| Platelet count, 109/L | 132 (55-375) |
| APRI | 0.77 (0.7-7.2) |
| Fib-4 | 1.8 (0.07-12) |
| Median FI(range) | 0.08 (0.01-0.64) |
| Matavir F0/F1/F2/F3/F4 (%) | 7/26.1/12.7/6.3/47.9 |
AKP: Alkaline phosphatase. GGT: γ-glutamyltransferase. ALT: Alanine ami-notransferase. AST: Aspartate aminotransferase. APRI: Aspartate aminotransferase platelet ratio index. FI: Fibrosis index. Continuous variables are presented as mean and standard deviation.
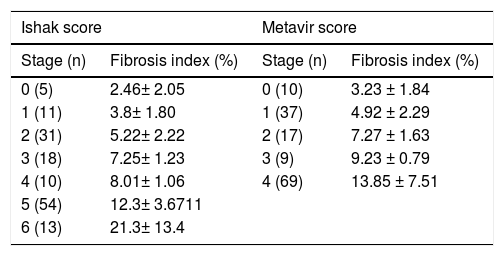
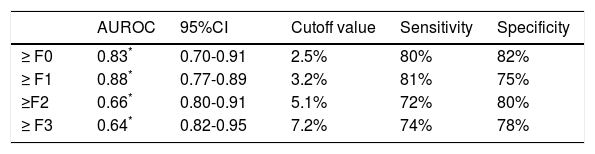
The FI increased significantly across the Metavir scoring system, with mean values in stage 0 vs. 1 vs. 2 vs. 3 vs. 4 of 0.03 ± 0.01, 0.05 ± 0.02, 0.07 ± 0.01, 0.09 ± 0.01, and 0.14 ± 0.07, respectively (p < 0.001) (Figure 2). The same trend in the FI was found across the Ishak scoring system (Figure 3). The FI values obtained by DIA according to the Ishak and Metavir scores are shown in table 2. The FI was strongly correlated with the Metavir and Ishak system (r = 0.83 and 0.86, respectively, p < 0.001). The ROC analysis was used to establish the cutoff value for the diagnosis of fibrosis stage according to the Metavir system. As showed in table 3, the cutoff values for diagnosis F0,F1,F2, and F3 were 2.5%, 3.2%, 5.1%, and 7.2%.


Fibrosis Index according to staging by Ishak and Mata-vir score system.
| Ishak score | Metavir score | ||
|---|---|---|---|
| Stage (n) | Fibrosis index (%) | Stage (n) | Fibrosis index (%) |
| 0 (5) | 2.46± 2.05 | 0 (10) | 3.23 ± 1.84 |
| 1 (11) | 3.8± 1.80 | 1 (37) | 4.92 ± 2.29 |
| 2 (31) | 5.22± 2.22 | 2 (17) | 7.27 ± 1.63 |
| 3 (18) | 7.25± 1.23 | 3 (9) | 9.23 ± 0.79 |
| 4 (10) | 8.01± 1.06 | 4 (69) | 13.85 ± 7.51 |
| 5 (54) | 12.3± 3.6711 | ||
| 6 (13) | 21.3± 13.4 | ||
Histological cirrhosis was diagnosed in 68 patients. Cirrhosis was sub-classified as 4a, 4b, and 4c. The FI was strongly correlated with the Laennec scoring system (r = 0.84, p < 0.01). The FI increased across the Laennec scoring system, with mean values in stage 4a vs. 4b vs. 4c of 0.11 ± 0.03, 0.15 ± 0.05, and 0.28 ± 0.17, respectively (p < 0.01).
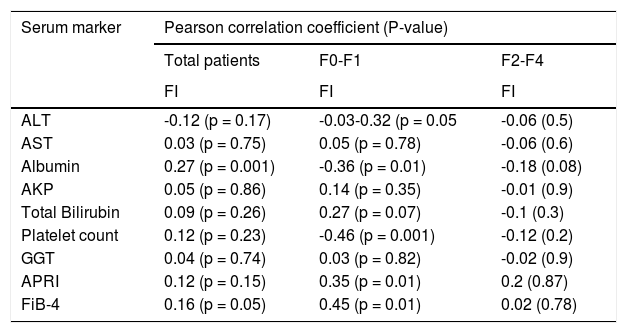
Correlation between the FI and serum fibrosis markersThe correlations between the FI and 7 serum markers (total bilirubin, GGT, ALT, AST, platelet count, ALP, and albumin) were analyzed. Using univariate analysis, only albumin showed a significant correlation with the FI. After stratification by the Metavir stage, albumin and platelet count were significantly correlated with the FI only in Metavir F0-F1. No serum marker was found to be significantly correlated with the FI in Metavir F2-F4. Neither serum fibrosis model (APRI nor FIB-4) was significantly correlated with the FI in all patients. Moreover, APRI and FIB-4 were only found to be significantly correlated with the FI in Metavir F0-F1. No model was significantly correlated with the FI in Metavir F2-F4 (Table 4).
Correlation between serum markers and FI.
| Serum marker | Pearson correlation coefficient (P-value) | ||
|---|---|---|---|
| Total patients | F0-F1 | F2-F4 | |
| FI | FI | FI | |
| ALT | -0.12 (p = 0.17) | -0.03-0.32 (p = 0.05 | -0.06 (0.5) |
| AST | 0.03 (p = 0.75) | 0.05 (p = 0.78) | -0.06 (0.6) |
| Albumin | 0.27 (p = 0.001) | -0.36 (p = 0.01) | -0.18 (0.08) |
| AKP | 0.05 (p = 0.86) | 0.14 (p = 0.35) | -0.01 (0.9) |
| Total Bilirubin | 0.09 (p = 0.26) | 0.27 (p = 0.07) | -0.1 (0.3) |
| Platelet count | 0.12 (p = 0.23) | -0.46 (p = 0.001) | -0.12 (0.2) |
| GGT | 0.04 (p = 0.74) | 0.03 (p = 0.82) | -0.02 (0.9) |
| APRI | 0.12 (p = 0.15) | 0.35 (p = 0.01) | 0.2 (0.87) |
| FiB-4 | 0.16 (p = 0.05) | 0.45 (p = 0.01) | 0.02 (0.78) |
AKP: Alkaline phosphatase. GGT: γ-glutamyltransferase. ALT. Alanine aminotransferase. AST: Aspartate aminotransferase. APRI: Aspartate. FI: Fibrosis index. APRI: Aspartate aminotransferase platelet ratio index.
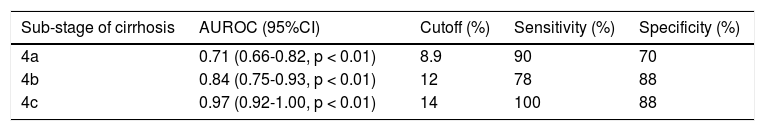
The ROC analysis was used to establish the cutoff value for the diagnosis of cirrhosis according to the Metavir system and for sub-classifying cirrhosis according to the Laennec scoring system. The FI yielded an optimum cutoff value of 7.7% with an AUROC of 0.95 (95% confidence interval [CI], 0.92-0.99, p < 0.001) for the histological diagnosis of stage F4 cirrhosis with a 94% sensitivity and 88% specificity according to the Metavir score (Figure 4). Furthermore, for the sub-classification of cirrhosis according to the Laennec scoring system, the FI yielded a cutoff value of 8.9% (AUROC, 0.74; 95% CI, 0.66–0.86), 12% (AUROC, 0.84; 95% CI, 0.75-0.93), and 14% (AU-ROC, 0.97; 95% CI, 0.92-1.0) for the diagnosis of cirrhosis 4a, 4b, and 4c, respectively (Table 5).

To date, the clinical use of CPA has been limited by the high cost of measuring this parameter. In the present study, we have validated an inexpensive DIA technique for fibrosis quantification in liver biopsies of patients with CHB. We have systemically evaluated the reliability of this simple, new fibrosis quantification technique. This inexpensive technology is available worldwide and will permit the application of this method in most pathology laboratories. A small amount of training time and minimal knowledge in informatics are enough to reproduce the method described in our study.
Sirius red staining has been shown to specifically stain collagen types I, II, and III, and to be highly sensitive in detecting small amounts of collagen.21 A previous study showed that image analysis of liver collagen using Sirius red staining was more accurate than that using tri-chrome.22 This staining method was thus used in the present study. A perfect contrast between fibrous tissue stained in red and parenchyma stained in yellow was obtained following the “selective color” procedure described in the methodology. The Adobe Photoshop imaging software, which is largely used in the biomedical field and easily acquired from the world wild web, allows the digitalization of the whole sample without needing expensive glass-scanning devices.
We were able to reproduce the DIA method developed by Campos, et al., confirming that the method is time-effective for routine practice. This DIA method is inexpensive and can be used in the current clinical practice. We consider that this new DIA technique should be considered as a complementary tool to traditional histological methods. For instance, in CHB patients with cirrhosis, after successful antiviral treatment, besides improvement in cirrhosis from F4C to F4A based on the Laennec system, the variation in the FI could estimate additional objective information about the improvement of advanced fibrosis.
Cirrhosis is the end result of CHB. Cirrhosis has different clinical stages in terms of severity. Because there is wide histological variability in cirrhosis, further sub-classification of the histology is necessary. Previous studies have demonstrated that the Laennec fibrosis scoring system is correlated with the clinical severity of cirrhosis and thus may be useful to determine the prognosis of pa-tients.23,24 Moreover, recent studies have shown that the CPA was superior to other histological methods for sub-classifying cirrhosis and determining the prognosis.11,24 For this reason, we evaluated the correlation between the DIA technique and the Laennec system. Our results demonstrated a strong correlation between the DIA and the Laennec score system (r = 0.84, p < 0.01). Moreover, important clinical cutoff points for sub-classifying cirrhosis according to the Laennec system were established in this study. The cutoff values for predicting fibrosis stage in our study were not consistent with those found in the study by Campos, et al. The reason for this inconsistency may be the differences in tissue staining method and etiology of the liver disease between both studies. Our findings suggest that patients with an FI higher than 14% would have a worse prognosis, and these patients require careful surveillance. However, the role of these cutoff points in the clinical practice should be further investigated in future studies. Another issue is that the FI has not been validated against clinical outcome. Whether the FI is superior to the Laennec system to predict the portal pressure and prognosis of cirrhosis patients requires further investigation.
The association between the FI and 7 serum markers (GGT, ALT, AST, ALP, total bilirubin, platelet count, and albumin) was evaluated in our study. Overall, the FI was significantly correlated with serum albumin. However, no serum marker was found to be significantly correlated with the FI in Matavir F2-F4. The widespread Metavir stages and FI values in this study allow for a better interpretation of the association between serum markers and FI values in a broad clinical setting. Furthermore, in this study, 2 serum fibrosis models (APRI and FIB-4) were found to be correlated with the FI in Metavir F0-F1. In particular, the FI was not significantly correlated with the 2 models in Metavir F2-F4. This suggested that in addition to detecting advanced fibrosis or cirrhosis in patients with CHB, serum markers and fibrosis models might have a limited ability to provide extra information within each Metavir stage, which is consistent with the findings of Fontana, et al.24
In summary, an inexpensive fibrosis quantification technique was reproduced using Sirius red staining methods. The FI was strongly correlated with the Metavir and Laennec staging systems, but was not significantly correlated with serum markers and fibrosis models in patients with advanced fibrosis. The DIA technique is a reliable method for liver fibrosis quantification that can be used in the clinical practice as a complementary tool to traditional histological methods.
Abbreviations- •
APRI: the aspartate aminotransferase (AST)/platelet radio index.
- •
AUROC: area under the ROC curve
- •
CPA: collagen proportional area
- •
DIA: quantitative digital image analysis
- •
FI: fibrosis index
- •
HBV: hepatitis B virus
All authors declare that they have no conflict of interest.
Financial SupportThe study was funded by project of Science and Technology department of Zhejiang province (NO 2014C33128) and by a grant from Zhejiang provincial health and Family Planning Commission. No 2007A009 and No C2015W162.


