


Introduction. Recent studies suggest that serum alkaline phosphatase may represent a prognostic biomarker in patients with primary sclerosing cholangitis. However, this association remains poorly understood. Therefore, the aim of this study was to investigate the prognostic significance and clinical correlates of alkaline phosphatase normalization in primary sclerosing cholangitis.
Material and methods. This was a retrospective cohort study of patients with a new diagnosis of primary sclerosing cholangitis made at an academic medical center. The primary endpoint was time to hepatobiliaryneoplasia, liver transplantation, or liver-related death. Secondary endpoints included occurrence of and time to alkaline phosphatase normalization. Patients who did and did not achieve normalization were compared with respect to clinical characteristics and endpoint-free survival, and the association between normalization and the primary endpoint was assessed with univariate and multivariate Cox proportional-hazards analyses.
Results. Eighty-six patients were included in the study, with a total of 755 patient-years of follow-up. Thirty-eight patients (44%) experienced alkaline phosphatase normalization within 12 months of diagnosis. Alkaline phosphatase normalization was associated with longer primary endpoint-free survival (p = 0.0032) and decreased risk of requiring liver transplantation (p = 0.033).
Persistent normalization was associated with even fewer adverse endpoints as well as longer survival. In multivariate analyses, alkaline phosphatase normalization (adjusted hazard ratio 0.21, p = 0.012) and baseline bilirubin (adjusted hazard ratio 4.87, p = 0.029) were the only significant predictors of primary endpoint-free survival.
Conclusions. Alkaline phosphatase normalization, particularly if persistent, represents a robust biomarker of improved long-term survival and decreased risk of requiring liver transplantation in patients with primary sclerosing cholangitis.
Primary sclerosing cholangitis (PSC) is a cholestatic, fibro-inflammatory hepatobiliary disease of unknown etiopathogenesis.1-4 PSC generally progresses to end-stage cirrhosis, represents a major risk factor for hepatobiliary and colonic carcinogenesis, and carries a median liver transplant (LT) free survival of approximately 15 years.3,5-7 An ongoing challenge in PSC management for both patients and providers is accurate prediction of major adverse clinical endpoints, in particular hepatobiliary neoplasia, need for LT, and death.8 Although the Mayo PSC risk score and model for end-stage liver disease (MELD) score are helpful for research purposes and organ allocation, respectively,9-11 more clinically specific and applicable biochemical markers for PSC-related prognosis are needed.
Persistent elevation of serum alkaline phosphatase (ALP) is a characteristic biochemical finding in patients with PSC. It is routinely measured during clinical follow-up and remains elevated in a majority of patients; in a small proportion, though, it can normalize over time,12-14 and recent preliminary studies by us and others suggest that this phenomenon may be associated with better long-term outcomes. Despite these findings, however, it is known that major adverse events can still occur in patients who have experienced ALP-N; therefore, the utility of ALP as prognostic biomarker in PSC, while promising, remains uncertain.
In the present study, our aim was to better understand the potential role of ALP in the natural history of patients with PSC. In particular, we examined, in a well-characterized cohort of patients with PSC:
- •
The frequency of ALP-N.
- •
Clinico-demographic, biochemical, and histologic features of patients who experience ALP-N.
- •
PSC-related outcomes of patients who experience ALP-N and the potential importance of time to, degree, and persistence of ALP-N, and
- •
Whether ALP-N is an independent predictor of decreased adverse outcomes after adjusting for other relevant variables.
Our collective findings herein support and extend the current knowledge regarding the role of ALP as a potential prognostic biomarker in patients with PSC.
Material and MethodsPatientsAfter obtaining Mayo Foundation institutional review board approval, electronic medical records from the Mayo Clinic in Rochester, MN were reviewed to identify all patients who received a new diagnosis of PSC at Mayo Clinic between January 1, 1997 and December 31, 2001. The diagnosis of PSC was made based on: serum ALP >1.5x the upper limit of normal (ULN), endoscopic retrograde (ERC) or magnetic resonance cholangiography demonstrating biliary ductal irregularity consistent with PSC, and/or liver histology compatible with PSC.15,16 Exclusion criteria included:
- •
Age < 18 years at diagnosis.
- •
Presence of concomitant or overlap liver disease (e.g. autoimmune hepatitis), and
- •
Evidence of hepatobiliary neoplasia (cholangiocarcinoma [CCA], hepatocellular carcinoma [HCC], or gallbladder carcinoma [GBCA]), need for (or prior) LT, or death within 1 year of PSC diagnosis.
In addition, because patients with small duct-only PSC, by definition, do not have detectable cholangiographic abnormalities, and given their natural history is known to be significantly different compared to those with large duct PSC, they were excluded from this study.
Study endpoints and variablesThe primary endpoint was time to the composite outcome of hepatobiliary neoplasia (CCA, HCC, or GBCA), LT (due to liver failure), or death. Secondary endpoints included occurrence of and time to ALP-N (defined as at least 1 normal ALP value after the diagnosis of PSC) as well as occurrence of persistent ALP-N (i.e. sustained normal ALP levels after initial normalization).
In addition to the above endpoints, the following data were abstracted: age at PSC diagnosis, sex, race, inflammatory bowel disease (IBD), use and dose of ursodeoxycholic acid (UDCA), body mass index (BMI) at diagnosis and 1 year thereafter, baseline serum laboratory tests (e.g. aspartate aminotransferase [AST], international normalized ratio [INR], creatinine, and total and direct bilirubin), revised Mayo PSC risk9 (MRS) and MELD11 scores, histologic stage,17 nadir and peak ALP and AST values post-diagnosis of PSC, persistent ALP-N, occurrence of AST normalization, need for ERC, and date of last follow-up (defined as a patient’s most recent clinical visit). Given the ULN varied by patient sex and age for both ALP and AST, we also calculated the ratio of individual patients’ ALP and AST values divided by the laboratory ULN at the time of phlebotomy.
Data analysisAll data were summarized as median (interquartile range [IQR]) or percentages. Patients who did and did not achieve ALP-N were compared with respect to demographic, biochemical, and clinical features and outcomes. Student’s t-test and χ2 test were used for comparing continuous and categorical data, respectively, between patients who did and did not achieve ALP-N. Kaplan-Meier curves were generated to evaluate time to endpoints. Univariate and multivariate Cox proportional-hazards models were constructed to assess predictors of time to the composite endpoint. Variables adjusted for in the multivariate proportional-hazards models were those that were significant in univariate analyses.9-11,18
Tests of significance were two-tailed, with an alpha level of 0.05. Analyses were performed using JMP statistical software (version 10.0, SAS Institute, NC).
ResultsBaseline characteristicsA total of 86 patients met inclusion criteria and were thus studied herein. The median age was 44 years, 73% were male, 77% had IBD, and the median ALP value at PSC diagnosis was 696 U/L (reference range 98-251 U/L, depending on age and sex). The median Ludwig stage of PSC was 2, and no patients had small-duct only disease. Patients were followed for a median of 8.7 years, amounting to 755 patient-years of total follow-up.
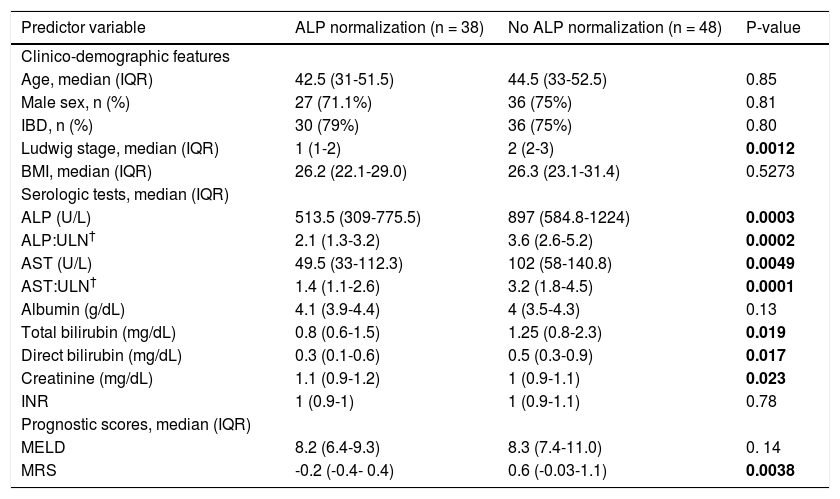
Overall, 38 patients (44%) went on to experience ALPN, after the diagnosis of PSC (52% of which were being treated with UDCA), with a median time to normalization of 12 months, as shown in figure 1. Four patients (5%) had normal ALP levels at the time of diagnosis. Characteristics of patients who did and did not experience ALP-N are shown and compared in table 1. Notably, patients who experienced ALP-N did not differ with respect to age, sex, BMI, or presence of IBD at time of diagnosis compared to those who did not experience ALP-N (all p > 0.05). There were significant differences in several baseline serum laboratory parameters, including higher ALP (p = 0.0003) and AST (p = 0.0049) in patients who did not experience ALP-N compared to those who did. In addition, baseline Ludwig stage was higher in patients who did not experience ALP-N (p = 0.0012).

Characteristics of patients with vs. without alkaline phosphatase normalization at time of PSC diagnosis.
| Predictor variable | ALP normalization (n = 38) | No ALP normalization (n = 48) | P-value |
|---|---|---|---|
| Clinico-demographic features | |||
| Age, median (IQR) | 42.5 (31-51.5) | 44.5 (33-52.5) | 0.85 |
| Male sex, n (%) | 27 (71.1%) | 36 (75%) | 0.81 |
| IBD, n (%) | 30 (79%) | 36 (75%) | 0.80 |
| Ludwig stage, median (IQR) | 1 (1-2) | 2 (2-3) | 0.0012 |
| BMI, median (IQR) | 26.2 (22.1-29.0) | 26.3 (23.1-31.4) | 0.5273 |
| Serologic tests, median (IQR) | |||
| ALP (U/L) | 513.5 (309-775.5) | 897 (584.8-1224) | 0.0003 |
| ALP:ULN† | 2.1 (1.3-3.2) | 3.6 (2.6-5.2) | 0.0002 |
| AST (U/L) | 49.5 (33-112.3) | 102 (58-140.8) | 0.0049 |
| AST:ULN† | 1.4 (1.1-2.6) | 3.2 (1.8-4.5) | 0.0001 |
| Albumin (g/dL) | 4.1 (3.9-4.4) | 4 (3.5-4.3) | 0.13 |
| Total bilirubin (mg/dL) | 0.8 (0.6-1.5) | 1.25 (0.8-2.3) | 0.019 |
| Direct bilirubin (mg/dL) | 0.3 (0.1-0.6) | 0.5 (0.3-0.9) | 0.017 |
| Creatinine (mg/dL) | 1.1 (0.9-1.2) | 1 (0.9-1.1) | 0.023 |
| INR | 1 (0.9-1) | 1 (0.9-1.1) | 0.78 |
| Prognostic scores, median (IQR) | |||
| MELD | 8.2 (6.4-9.3) | 8.3 (7.4-11.0) | 0. 14 |
| MRS | -0.2 (-0.4- 0.4) | 0.6 (-0.03-1.1) | 0.0038 |
ALP:alkaline phosphatase. AST: aspartate aminotransferase. BMI: body mass index (at PSC diagnosis). IBD: inflammatory bowel disease. INR: international normalized ratio. IQR: interquartile range. MELD: model for endstage liver disease. MRS:revised Mayo PSC risk (i.e. natural history model for PSC) score. UDCA:ursodeoxycholic acid. ULN: upper limit of normal.
ALP and AST were compared to the ULN in the form of a ratio given the normal range for these values varied according to patient sex and age and changed during the course of this study in the Mayo Clinic laboratory. Follow-up was 433 patient-years in the ALP normalization group and 322 patient-years in the no ALP normalization group. P-value < 0.05 noted in bold.
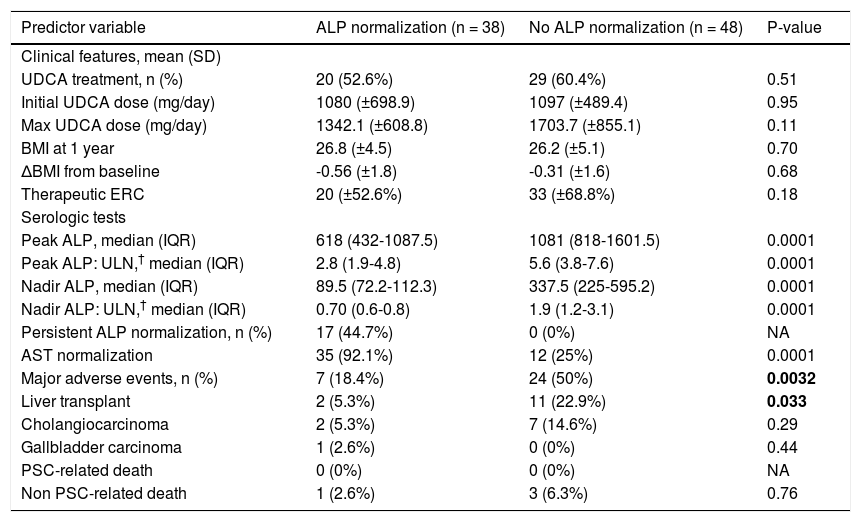
We compared therapies, serum laboratory parameters, and outcomes over the course of follow-up among the patients who experienced ALP-N and those patients who did not. As shown in table 2, these two groups did not vary in UDCA treatment, maximum UDCA dose, need for therapeutic ERC, or change in BMI following diagnosis of PSC. Patients who experienced ALP-N had both lower nadir and peak ALP:ULN ratios than those who did not experience ALP-N and were also more likely to experience normalization of AST. Importantly, and as demonstrated in figure 2, patients who experienced ALP-N were overall less likely to experience the composite clinical endpoint of hepatobiliary neoplasia, LT, or death (p = 0.0032). Of note, there were no differences in outcomes between those who experienced ALP-N with UDCA vs. without UDCA treatment.
Outcomes of patients with vs. without alkaline phosphatase normalization.
| Predictor variable | ALP normalization (n = 38) | No ALP normalization (n = 48) | P-value |
|---|---|---|---|
| Clinical features, mean (SD) | |||
| UDCA treatment, n (%) | 20 (52.6%) | 29 (60.4%) | 0.51 |
| Initial UDCA dose (mg/day) | 1080 (±698.9) | 1097 (±489.4) | 0.95 |
| Max UDCA dose (mg/day) | 1342.1 (±608.8) | 1703.7 (±855.1) | 0.11 |
| BMI at 1 year | 26.8 (±4.5) | 26.2 (±5.1) | 0.70 |
| ΔBMI from baseline | -0.56 (±1.8) | -0.31 (±1.6) | 0.68 |
| Therapeutic ERC | 20 (±52.6%) | 33 (±68.8%) | 0.18 |
| Serologic tests | |||
| Peak ALP, median (IQR) | 618 (432-1087.5) | 1081 (818-1601.5) | 0.0001 |
| Peak ALP: ULN,† median (IQR) | 2.8 (1.9-4.8) | 5.6 (3.8-7.6) | 0.0001 |
| Nadir ALP, median (IQR) | 89.5 (72.2-112.3) | 337.5 (225-595.2) | 0.0001 |
| Nadir ALP: ULN,† median (IQR) | 0.70 (0.6-0.8) | 1.9 (1.2-3.1) | 0.0001 |
| Persistent ALP normalization, n (%) | 17 (44.7%) | 0 (0%) | NA |
| AST normalization | 35 (92.1%) | 12 (25%) | 0.0001 |
| Major adverse events, n (%) | 7 (18.4%) | 24 (50%) | 0.0032 |
| Liver transplant | 2 (5.3%) | 11 (22.9%) | 0.033 |
| Cholangiocarcinoma | 2 (5.3%) | 7 (14.6%) | 0.29 |
| Gallbladder carcinoma | 1 (2.6%) | 0 (0%) | 0.44 |
| PSC-related death | 0 (0%) | 0 (0%) | NA |
| Non PSC-related death | 1 (2.6%) | 3 (6.3%) | 0.76 |
ALP: alkaline phosphatase. AST: aspartate aminotransferase. BMI: body mass index. ERC: endoscopic retrograde cholangiography. UDCA: ursodeoxycholic acid.
.")
In addition to examining ALP-N, we also assessed the occurrence of persistent ALP-N. We found that a total of 17 patients (19%) experienced this endpoint during the follow-up period. Only one of these patients experienced the composite endpoint; this was a case of HCC, although the patient was noted to have a remote history of alcoholic hepatitis prior to the diagnosis of PSC. Therefore, and as demonstrated in figure 3, persistent ALP-N appears to be a particularly favorable biomarker in PSC.
Features of patients who did vs. did not experience major adverse events vs. those patients without persistent ALP normalization (p = 0.0075).")
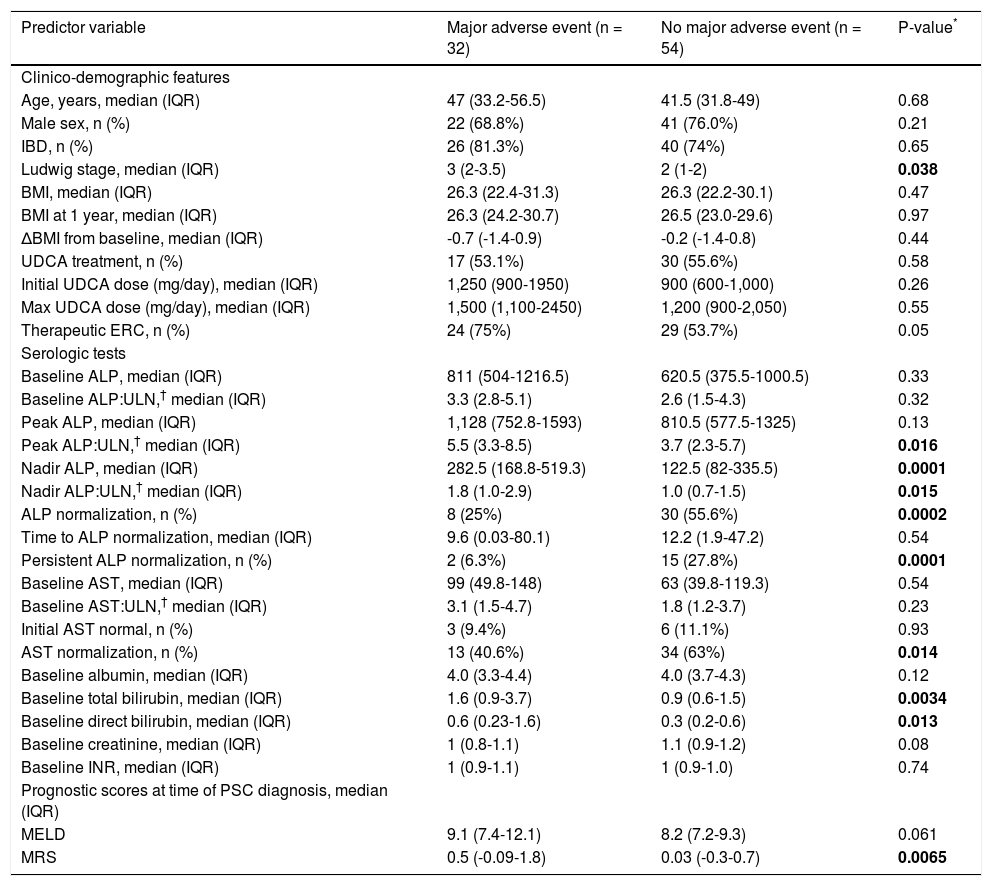
Thirty-two patients (37%) experienced the primary endpoint during follow-up. These patients exhibited several significant differences in univariate regression analyses compared to those who did not experience the primary endpoint (Table 3). For example, they had higher Ludwig stage and MRS at the time of PSC diagnosis, and a higher proportion required therapeutic ERC (all p < 0.05). With respect to serum biochemical tests, they had higher peak ALP:ULN ratios and baseline total and direct bilirubin as well as higher nadir ALP values and nadir ALP:ULN ratios. In addition, they less frequently experienced ALP and AST normalization and persistent ALP-N.
Comparison of patients who experienced a major adverse event vs. those who did not.
| Predictor variable | Major adverse event (n = 32) | No major adverse event (n = 54) | P-value* |
|---|---|---|---|
| Clinico-demographic features | |||
| Age, years, median (IQR) | 47 (33.2-56.5) | 41.5 (31.8-49) | 0.68 |
| Male sex, n (%) | 22 (68.8%) | 41 (76.0%) | 0.21 |
| IBD, n (%) | 26 (81.3%) | 40 (74%) | 0.65 |
| Ludwig stage, median (IQR) | 3 (2-3.5) | 2 (1-2) | 0.038 |
| BMI, median (IQR) | 26.3 (22.4-31.3) | 26.3 (22.2-30.1) | 0.47 |
| BMI at 1 year, median (IQR) | 26.3 (24.2-30.7) | 26.5 (23.0-29.6) | 0.97 |
| ΔBMI from baseline, median (IQR) | -0.7 (-1.4-0.9) | -0.2 (-1.4-0.8) | 0.44 |
| UDCA treatment, n (%) | 17 (53.1%) | 30 (55.6%) | 0.58 |
| Initial UDCA dose (mg/day), median (IQR) | 1,250 (900-1950) | 900 (600-1,000) | 0.26 |
| Max UDCA dose (mg/day), median (IQR) | 1,500 (1,100-2450) | 1,200 (900-2,050) | 0.55 |
| Therapeutic ERC, n (%) | 24 (75%) | 29 (53.7%) | 0.05 |
| Serologic tests | |||
| Baseline ALP, median (IQR) | 811 (504-1216.5) | 620.5 (375.5-1000.5) | 0.33 |
| Baseline ALP:ULN,† median (IQR) | 3.3 (2.8-5.1) | 2.6 (1.5-4.3) | 0.32 |
| Peak ALP, median (IQR) | 1,128 (752.8-1593) | 810.5 (577.5-1325) | 0.13 |
| Peak ALP:ULN,† median (IQR) | 5.5 (3.3-8.5) | 3.7 (2.3-5.7) | 0.016 |
| Nadir ALP, median (IQR) | 282.5 (168.8-519.3) | 122.5 (82-335.5) | 0.0001 |
| Nadir ALP:ULN,† median (IQR) | 1.8 (1.0-2.9) | 1.0 (0.7-1.5) | 0.015 |
| ALP normalization, n (%) | 8 (25%) | 30 (55.6%) | 0.0002 |
| Time to ALP normalization, median (IQR) | 9.6 (0.03-80.1) | 12.2 (1.9-47.2) | 0.54 |
| Persistent ALP normalization, n (%) | 2 (6.3%) | 15 (27.8%) | 0.0001 |
| Baseline AST, median (IQR) | 99 (49.8-148) | 63 (39.8-119.3) | 0.54 |
| Baseline AST:ULN,† median (IQR) | 3.1 (1.5-4.7) | 1.8 (1.2-3.7) | 0.23 |
| Initial AST normal, n (%) | 3 (9.4%) | 6 (11.1%) | 0.93 |
| AST normalization, n (%) | 13 (40.6%) | 34 (63%) | 0.014 |
| Baseline albumin, median (IQR) | 4.0 (3.3-4.4) | 4.0 (3.7-4.3) | 0.12 |
| Baseline total bilirubin, median (IQR) | 1.6 (0.9-3.7) | 0.9 (0.6-1.5) | 0.0034 |
| Baseline direct bilirubin, median (IQR) | 0.6 (0.23-1.6) | 0.3 (0.2-0.6) | 0.013 |
| Baseline creatinine, median (IQR) | 1 (0.8-1.1) | 1.1 (0.9-1.2) | 0.08 |
| Baseline INR, median (IQR) | 1 (0.9-1.1) | 1 (0.9-1.0) | 0.74 |
| Prognostic scores at time of PSC diagnosis, median (IQR) | |||
| MELD | 9.1 (7.4-12.1) | 8.2 (7.2-9.3) | 0.061 |
| MRS | 0.5 (-0.09-1.8) | 0.03 (-0.3-0.7) | 0.0065 |
ALP: alkaline phosphatase. AST: aspartate aminotransferase. BMI: body mass index. ERC: endoscopic retrograde cholangiography. MRS: revised Mayo PSC risk (i.e. natural history model for PSC) score. UDCA: ursodeoxycholic acid.
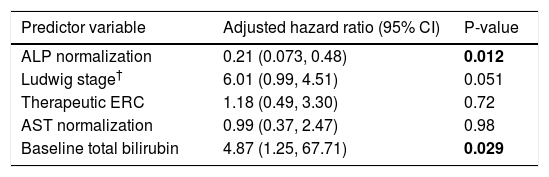
Multivariate Cox proportional hazards analyses were performed to examine the association between ALP-N while adjusting for other potentially relevant variables found to be significant in univariate regression analyses, including Ludwig stage, need for therapeutic ERC, peak ALP:ULN, AST normalization, and baseline total and direct bilirubin. After adjusting for these variables, ALP-N remained significantly associated with decreased risk of major adverse PSC-related outcomes (Table 4).
Multivariate analysis of predictors of major adverse PSC-related clinical events.
| Predictor variable | Adjusted hazard ratio (95% CI) | P-value |
|---|---|---|
| ALP normalization | 0.21 (0.073, 0.48) | 0.012 |
| Ludwig stage† | 6.01 (0.99, 4.51) | 0.051 |
| Therapeutic ERC | 1.18 (0.49, 3.30) | 0.72 |
| AST normalization | 0.99 (0.37, 2.47) | 0.98 |
| Baseline total bilirubin | 4.87 (1.25, 67.71) | 0.029 |
Variables adjusted for were determined a priori as described in the data analysis section. The Mayo PSC risk score was not included as several of its individual components were included and directly studied. Peak ALP was excluded because of colinearity with ALP normalization; direct bilirubin was excluded because of colinearity with total bilirubin. CI: confidence interval. ERC: endoscopic retrograde cholangiography. AST: aspartate aminotransferase.
PSC is a progressive disorder with an unpredictable clinical course, paucity of therapeutic options, and potentially devastating outcomes.1,16 Although natural history models and risk scores have been developed to estimate mortality in PSC, better biochemical markers of disease prognosis and response to therapy are needed to help inform disease surveillance and assess existing and emerging therapies.8 The objectives of this study, thus, were to expand the role of serum ALP as a promising and readily available prognostic biochemical marker in patients with PSC by examining different biochemical and clinical endpoints. Our major findings herein are:
- •
Nearly one quarter of PSC patients experience spontaneous ALP-N within a median of 12 months post-PSC diagnosis.
- •
ALP-N, and even more so persistent ALP-N, is associated with a low incidence of liver transplantation and other major adverse PSC-related events during extended follow-up, and
- •
ALP-N is an independent predictor of decreased major adverse PSC-related events, even after adjusting for other relevant variables.
Therefore, our study clarifies the role of ALP as a biochemical marker in PSC and strongly supports its prognostic value in patients with this disease.
ALP levels vary widely during the course of PSC12,13 but remain persistently elevated in a majority of patients. Persistent elevation has been proposed as a potential marker of ongoing biliary injury and disease progression. Recent studies by us and others have suggested that ALP-N portends a better prognosis for PSC patients.14 For example, Al Mamari, et al. recently showed that reduction of ALP to <1.5 the ULN is associated with improved outcome and decreased risk of CCA.19 Lindstrom, et al. assessed the impact of UDCA treatment with and without ALP-N on survival in patients with PSC; the authors found that patients with normalization or reduction (defined as > 40% reduction from baseline) of ALP had longer survival times than patients with no biochemical response irrespective of treatment with UDCA. These studies have been corroborated by a recent magnetic resonance elastography-based study which found decreased liver stiffness measurements and slower progression of liver stiffness among patients with ALP-N when compared to patients with persistently elevated ALP.20 Collectively, these studies suggest that achieving ALP-N over the disease course has clinical and prognostic importance in PSC, but several important questions have, until now, remained unaddressed.
In our study of 86 patients with 755 patient-years of follow-up, we confirmed the recent findings of the aforementioned reports and extended them with novel aspects regarding the temporal dynamics and prognostic significance of ALP-N. In our study, ALP-N (with or without UDCA therapy) was an independent predictor of primary endpoint-free survival, even after adjusting for other clinically relevant variables, suggesting that ALP-N serves as a biomarker of milder disease phenotype (Figures 2 and 3). Al Mamari, et al. propose that persistent improvement of ALP to <1.5 ULN confers decreased risk of CCA and recommend this as a biochemical cutoff. However, this cutoff was not associated with decreased risk of progressive PSC requiring LT in their study. Importantly, we found that ALP-N, either transient or persistent, was associated with a significantly decreased risk of requiring LT (p = 0.03). This finding further establishes the prognostic significance of ALP by identifying a cutoff which predictslower risk for requiring LT in addition to other adverse endpoints.
Intriguingly, we found that patients who experienced ALP-N tended to have lower ALP, AST, and bilirubin as well as a lower Ludwig stage at time of diagnosis. Furthermore, patients who experienced ALP-N had both lower nadir and peak ALP levels during follow-up and were more likely to experience AST normalization over time. AST is a component of the MRS, and increased serum AST levels are reflective of biliary obstruction and hepatocellular injury. Previous studies have demonstrated that AST has prognostic significance in primary biliary cholangitis (PBC) and PSC and that patients with PSC who present with higher initial AST levels have decreased survival;9 our paper is the first to demonstrate that AST normalization is associated with ALP-N as well as improved survival. After adjusting for ALP-N in a multivariate model, however, AST normalization was no longer a predictor of improved survival (Table 4); aside from ALP-N, only baseline bilirubin values were statistically significant independent predictors of composite endpoint-free survival, and baseline Ludwig stage showed a trend toward significance. Taken together, these findings indicate that lower ALP levels both at diagnosis and throughout the disease course are predictive of a more benign disease course and better long term outcomes. Moreover, they suggest that a reasonable clinical strategy may be to observe patients for one year after PSC diagnosis, and for those who do not experience ALP-N spontaneously, considering a 6-12 month trial of intermediate-dose UDCA (or other emerging therapies).
Importantly, patients with persistent ALP-N appeared to be the least likely to experience a major adverse event and had improved survival (Figure 3). Stanich, et al.14 previously found that ALP-N more commonly occurred shortly after diagnosis. However, our data suggest that the persistence of ALP-N bears more prognostic significance than time to normalization, which can vary widely. Therefore, serial monitoring of ALP for normalization is worthwhile and bears prognostic significance for patients. In addition, our results suggest that patients with persistently elevated ALP who are treated with UDCA and experience ALP-N should, in the absence of more effective pharmacotherapy, be continued on this treatment.21
This study has several limitations which should be mentioned. It was retrospective in nature, and thus causal relationships cannot be inferred. The sample size was small, in part due to the low incidence of PSC, but the long median patient follow-up and well-characterized nature of the cohort helped to mitigate this limitation. This was a single center study based in a tertiary care institution, which may limit generalizability; however, by including only patients with a new diagnosis of PSC (as opposed to those referred with already established advanced PSC), we believe our findings may be broadly applicable and less affected by potential confounders. Another limitation of our study is that we did not treat ALP-N as a time-dependent (but instead a categorical) variable; however, most patients who experienced ALP-N did so relatively early in their disease course (within 12-18 months of diagnosis), and time to ALP-N was not predictive of primary endpoint-free survival in our analyses (Table 3). Lastly, we did not study non-hepatobiliary outcomes (e.g. colorectal cancer) in this study, although we recognize that these are important areas of research in PSC.
ConclusionIn conclusion, ALP-N with or without UDCA therapy is independently and robustly associated with improved outcomes and survival in patients with PSC. Moreover, persistent ALP-N is associated with particularly favorable long term outcomes. Therefore, our study supports the role of ALP-N as a readily available and reliable marker of more benign disease phenotype, decreased risk of PSC-related adverse outcomes, and possibly response to pharmacotherapy. These findings have important implications in the current management of PSC and suggest closer surveillance of patients who do not experience ALP-N.
Abbreviations- •
ALP: alkaline phosphatase.
- •
ALP-N: alkaline phosphatase normalization.
- •
AST: aspartate aminotransferase.
- •
BMI: body mass index.
- •
CCA: cholangiocarcinoma.
- •
ERC: endoscopic retrograde cholangiography.
- •
GBCA: gallbladder carcinoma.
- •
HCC: hepatocellular carcinoma.
- •
IBD: inflammatory bowel disease.
- •
INR:binternational normalized ratio.
- •
IQR: interquartile range.
- •
LT: liver transplantation.
- •
MELD: model for end-stage liver disease.
- •
MRS: revised Mayo PSC risk (i.e. natural history model for PSC) score.
- •
PSC: primary sclerosing cholangitis.
- •
UDCA: ursodeoxycholic acid.
- •
ULN: upper limit of normal.
None.
AcknowledgmentThe authors would like to thank Dr. Peter Stanich for his assistance with identifying patients eligible for this study.


