


Introduction and aim. Studies carried out mainly in patients with hepatocellular carcinoma (HCC), have shown the prognostic significance of albumin-bilirubin (ALBI) grade. Recently, another predictive score incorporating platelet count into ALBI, PALBI grade, was introduced in patients with HCC.
Aim. We evaluated the ability of ALBI and PALBI grades in predicting the outcome (mortality / liver transplantation) of patients with stable decompensated cirrhosis with various etiology of liver diseases.
Material and methods. We prospectively studied 325 patients with stable decompensated cirrhosis awaiting liver transplantation. Their clinical and laboratory characteristics were recorded including albumin, bilirubin levels, platelets. We estimated ALBI and PALBI grades for every patient. Conventional prognostic scores were also evaluated; Child-Pugh (CTP), Model for End stage Liver Disease (MELD). We followed them up and recorded their outcome.
Results. Beyond MELD and CTP, ALBI and PALBI grades proved significant factors associated with the outcome (HR: 2.13, 95%CI [1.59, 2.85], p < 0.001 and HR: 2.06, 95%CI [1.47, 2.9], p < 0.001, respectively), and their predictive capability was established (ROC analysis; AUC: 0.695, 95% CI [0.634, 0.755] and AUC: 0.683, 95% CI [0.621,0.744], respectively). ALBI and PALBI performed better than CTP score (p = 0.0044 and p = 0.014, respectively). Categorization of our patients into three ALBI groups detected statistically different survival times. Accordingly, PALBI grade 3 compared to those with PALBI grade 1 and 2 patients, had worse outcome and significantly higher frequency of cirrhosis-related complications
Conclusions. ALBI and PALBI grades were validated and can be used to predict the outcome in patients with stable decompensated cirrhosis
Decompensated cirrhosis is characterized by the presence of striking and life-threatening complications and mortality without transplantation is as high as 85% over 5 years.1 Many studies have attempted to develop a classification system that can both characterize the degree of liver injury and predict the prognosis of patients with cirrhosis on the basis of clinical and laboratory variables.1 The Child-Pugh (CTP) classification is the model most widely used to determine prognosis in patients with liver disease and is based on serum albumin, serum bilirubin, prothrombin time, ascites, and encephalopathy.2 CTP score is widely used as a simple descriptive or prognostic indicator.3 The Model for End-Stage Liver Disease (MELD), is based on serum creatinine, serum bilirubin and INR and is generalizable to patient populations of diverse etiologies and wide ranges of severity of liver disease.2 MELD score predicts intermediate term (12-month) mortality with good sensitivity and specificity characteristics.4,5 More recently, MELD-Sodium score (MELDNa) score has been suggested to provide significantly better prediction of mortality among registrants on the waiting list for liver transplantation (LT).6,7 Undoubtedly, there is always the need to use ease, objective and effective predictive markers for our patients’ prognosis.
Recently, a new model has been used in patients with hepatocellular carcinoma (HCC) to predict their survival and it is based on two objective variables: serum albumin and total bilirubin. This resultant model, called the albumin-bilirubin (ALBI) grade, is a simple score derived from an easily accessible and noninvasive blood test without using those factors evaluated subjectively (such as ascites and encephalopathy) or obtained by invasive procedures.8 Moreover, another prognostic score has been suggested to stratify HCC patients’ survival after curative therapies (resection/ablation), even more precisely than CTP classification. PALBI model was built by incorporating platelet count into previously described ALBI grade and is proposed to be objective measurement of liver function reserve that can adequately stratify patient’s survival with HCC.9
ALBI grade has been also evaluated as a prognostic factor estimating the clinical outcome of patients with primary biliary cholangitis (PBC) and provides better/similar prognostic performance compared with other well established prognostic scores like CTP score, MELD score and Mayo risk score.10 ALBI grade was effective in predicting the longterm prognosis for patients with HBV-related cirrhosis (compensated and decompensated), too, and even more accurate than CTP and MELD scores.11 In a more recent study, published as an abstract form, ALBI has been used to evaluate liver function in patients with decompensated cirrhosis receiving direct acting antiviral (DAA) therapy, proving that ALBI grade is a good indicator of likelihood of death and clinically significant deterioration after DAA therapy.12 Thus, the utility of this prognostic score could be generalized in patients with decompensated cirrhosis irrespectively of etiology of underlying liver disease. On the other hand, PALBI grade, has been validated in patients with chronic liver disease and HCC,9 and recently has been used as a predictor of mortality in patients with cirrhosis related complications.13 Though, it has not been evaluated in patients with stable decompensated cirrhosis. Platelet count is considered a definite diagnostic marker for detecting cirrhosis.14 Inductively, it seems reasonable that PALBI grade could as well been applied in patients with stable decompensated cirrhosis.
In general, the above-mentioned prognostic scores, ALBI and PALBI, have not been reclaimed in the same cohort of patients with decompensated cirrhosis. We therefore conducted our study in order to evaluate the prognostic significance of ALBI and PALBI grades and their ability to estimate the outcome of patients with stable decompensated cirrhosis.
Material and MethodsStudy characteristicsWe conducted a prospective single-center study and evaluated patients with stable decompensated cirrhosis presented to our Department between 2010 and 2017. Diagnosis of cirrhosis was based on imaging techniques together with clinical features such as ascites, thrombocytopenia or gastro-oesophageal varices. Decompensated cirrhosis was defined as a history of ascites, variceal bleeding, encephalopathy or non-obstructive jaundice in patients with known cirrhosis. All included patients had been admitted for pre-liver transplantation (LT) evaluation and waiting list registration. Patients were stable regarding their chronic liver disease: i.e. they had no active variceal bleeding, encephalopathy or infection, such as spontaneous bacterial peritonitis (SBP), during the last month before admission. Detailed clinical evaluation, laboratory measurements (white blood cells, C-reactive protein, procalcitonin, blood cultures and ascitic fluid paracentesis) and radiological exams (chest x-ray, upper abdominal ultrasound), whenever necessary, were performed in order to exclude patients with clinical or subclinical infection.
On admission, for every patient we recorded demographic and clinical characteristics: age; sex; cause and duration of liver disease; previous complications of cirrhosis (i.e. variceal bleeding, encephalopathy or SBP); medication administered for the liver disease (duration and dosage); and vital signs (blood pressure, pulse rate). On admission to our Department, we also evaluated laboratory variables including albumin, protein, bilirubin (total and direct), clotting profile, creatinine, electrolytes [e.g. sodium (Na) and potassium (K)], aminotransferases (aspartate and alanine), alkaline phosphatase, y-glutamyl transpeptidase and lactate dehydrogenase. Afterwards, we estimated MELD score2 and CTP score,15 in order to evaluate the severity of liver disease. Using the literature proposed equation we calculated ALBI grade [(log10 bilirubin x 0.66) + (albumin x [-0.085]), where bilirubin is in pmol/L and albumin in g/L].8 Accordingly, PALBI grade was calculated as the following equation:
2.02 x log10 bilirubin 0.37 x (log10 bilirubin)2 0.04 x albumin 3.48 x log10 platelets + 1.01 x (log10 platelets)2, bilirubin was expressed in p,mol/L, albumin in g/L and blood platelet count in 1000/p,L.9
In the context of pre-LT evaluation, we conducted further evaluation of our patients’ cardiac and renal function. According to our protocol, a subgroup of patients were evaluated for the presence of hepatopulmonary syndrome (HPS) by contrast-enhanced echocardiography, performed after the injection of 20 mL of agitated saline into the patient’s right cubital vein. Microbubble opacification of the left atrium within the 4th and 8th cardiac cycle after right atrial opacification was considered to be indicative of intrapulmonary shunts. The appearance of microbubbles earlier than the 4th cardiac cycle in the left cardiac chambers was indicative of intracardiac shunt.16 The renal function (“true” glomerular filtration rate, GFR) was assessed in all patients using 51Chromium-EDTA (51Chr-EDTA)17 along with estimated GFR (eGFR) using the creatininebased 4 variables Modification of the Diet in Renal Disease (MDRD) formula.18
We followed our included patients prospectively and analyzed their clinical and laboratory features. Primarily, we evaluated their outcome and its correlation with ALBI and PALBI grade. Survival was measured from the date of stratification to date of death or LT, or last follow-up.
The study protocol was approved by our Institutional Review Board and conformed to the ethical guidelines of the 1975 Declaration of Helsinki.
Statistical analysisContinuous variables were presented as mean ± standard deviation (normally distributed) or median with interquartile range (non-normally distributed). Categorical variables were expressed as frequencies or percentages. Comparisons of parameters between patients were performed using Student’s t or Mann-Whitney U tests, as appropriate, for continuous variables and %2 test for categorical variables. Multivariable Cox’s proportional hazard model was carried out to identify independent factors associated with the outcome (death or LT) through time and cumulative overall survival (OS) was calculated to estimate the hazard ratios. Factors with p < 0.05 in the univariate cox regression analysis were entered into the multivariable model. Survival rates were estimated by the Kaplan-Meier method and the differences were compared using the log-rank test. The discriminative ability of prognostic scores (including ALBI and PALBI) to predict the outcome of patients with decompensated cirrhosis was evaluated by using the area under the receiver operating characteristic curve (ROC). This has the true-positive and false-positive rates on the vertical and horizontal axes, respectively. As the AUC approaches 1.0, the model approaches 100% sensitivity and specificity.19 P value < 0.05 was considered statistically significant. Statistical analysis was conducted by SPSS (version 23.0 IBM) and comparison of ROC curves was performed with the MedCalc statistical software.
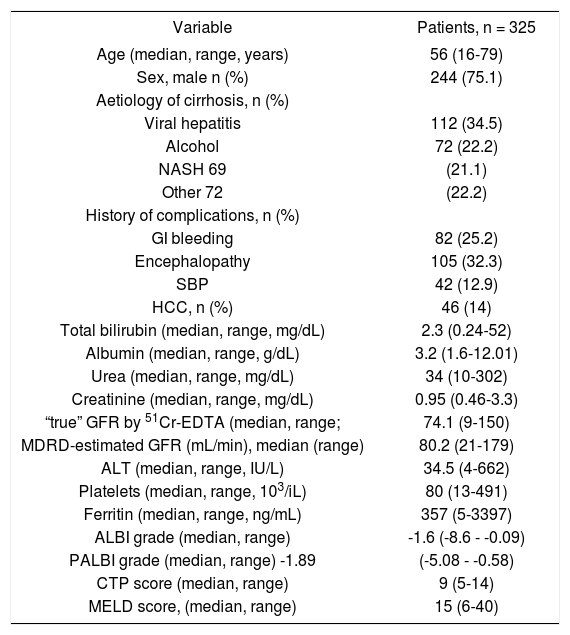
ResultsWe evaluated prospectively 325 patients [244 males, age 56 (16-79) years]. Their baseline characteristics are shown in table 1. One hundred and sixty four patients (50.3%) had a previous history of cirrhosis related complications (i.e. gastrointestinal bleeding, hepatic encephalopathy or SBP). Evaluation of kidney function using 51Chr-EDTA showed median “true”-GFR at 74.1 mL/min (range: 9-150), while MDRD 80.2 ml/min (range: 21-179). Fifty seven patients (41.6%) out of 137 examined, had HPS. The median values of MELD and CTP scores were 15 (range: 6-40) and 9 (range: 5-14), respectively. ALBI grade median value was calculated -1.6 (range: -8.6 —0.09) and PALBI grade had a median value of -1.89 (range: -5.08 —0.58). During the follow up period (16.9 [range: 1-84] months) we evaluated their outcome (survival or death/LT). The median follow up period was 17 months (range: 1-84) for those who survived (n = 135 patients), while the patients who died or underwent LT (n = 190, 58.5%) were followed up for a median time of 10 months (range: 1-52) until this clinical outcome (p < 0.001).
Baseline clinical and laboratory characteristics of 325 patients with stable decompensated cirrhosis
| Variable | Patients, n = 325 |
|---|---|
| Age (median, range, years) | 56 (16-79) |
| Sex, male n (%) | 244 (75.1) |
| Aetiology of cirrhosis, n (%) | |
| Viral hepatitis | 112 (34.5) |
| Alcohol | 72 (22.2) |
| NASH 69 | (21.1) |
| Other 72 | (22.2) |
| History of complications, n (%) | |
| GI bleeding | 82 (25.2) |
| Encephalopathy | 105 (32.3) |
| SBP | 42 (12.9) |
| HCC, n (%) | 46 (14) |
| Total bilirubin (median, range, mg/dL) | 2.3 (0.24-52) |
| Albumin (median, range, g/dL) | 3.2 (1.6-12.01) |
| Urea (median, range, mg/dL) | 34 (10-302) |
| Creatinine (median, range, mg/dL) | 0.95 (0.46-3.3) |
| “true” GFR by 51Cr-EDTA (median, range; | 74.1 (9-150) |
| MDRD-estimated GFR (mL/min), median (range) | 80.2 (21-179) |
| ALT (median, range, IU/L) | 34.5 (4-662) |
| Platelets (median, range, 103/iL) | 80 (13-491) |
| Ferritin (median, range, ng/mL) | 357 (5-3397) |
| ALBI grade (median, range) | -1.6 (-8.6 - -0.09) |
| PALBI grade (median, range) -1.89 | (-5.08 - -0.58) |
| CTP score (median, range) | 9 (5-14) |
| MELD score, (median, range) | 15 (6-40) |
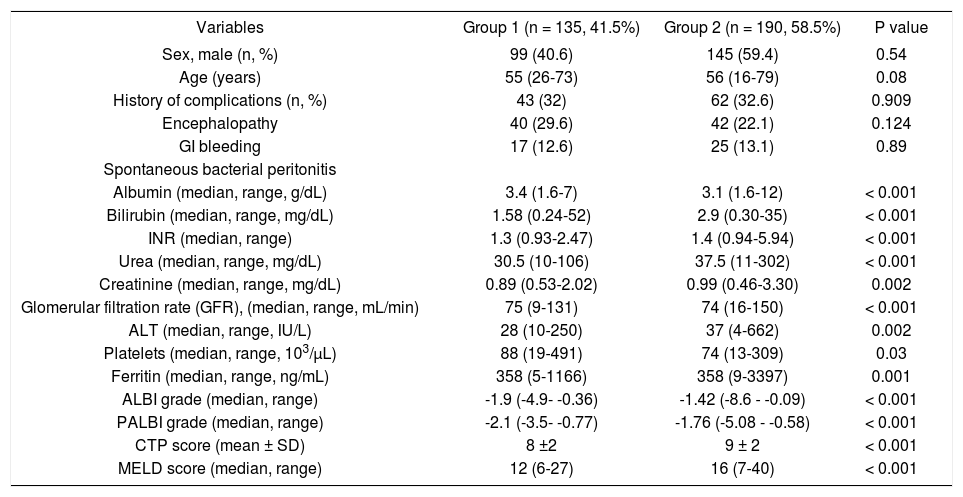
During the follow up period [16.9 (range: 1-84) months], 135 patients were alive (41.5%, group 1) and 190 patients died (n = 85) or underwent LT (n = 105) (58.5%, group 2). Group 1, compared to group 2 patients, had significantly lower bilirubin [1.58 (range: 0.24-52) vs. 2.9 (range: 0.30-35) mg/dL, p < 0.001], INR [1.3 (range: 0.932.47) vs. 1.4 (range: 0.94-5.94), p < 0.001], urea [30.5 (range: 10-106) vs. 37.5 (range: 11-302) mg/dL, p < 0.001], creatinine [0.89 (range: 0.53-2.02) vs. 0.99 (range: 0.46-3.30) mg/dL, p = 0.002], ALT [28 (range: 10-250) vs. 37 (range: 4-662) IU/L, p = 0.002], ALBI grade [-1.9 (range: -4.9-0.36) vs. -1.42 (range: -8.6—0.09), p < 0.001], PALBI grade [-2.1 (range: -3.5 —0.77) vs. -1.76 (range: -5.08 -0.58), p < 0.001], CTP (8 ± 2 vs. 9 ± 2, p < 0.001) and MELD score [12 (range: 6-27) vs. 16 (range: 7-40), p < 0.001]. In addition, group 1 had significantly higher albumin [3.4 (range: 1.6-7) vs. 3.1 (range: 1.6-12) g/dL, p < 0.001], GFR [75 (range: 9-131) vs. 74 (range: 16-150) mL/min, p < 0.001] and platelet count [88 (range: 19-491) vs. 74 (range: 13-309) 103/pL, 0.03] compared to group 2 (Table 2).
Clinical and laboratory characteristics of patients who survived (group 1) or died/underwent liver transplantation (group 2).
| Variables | Group 1 (n = 135, 41.5%) | Group 2 (n = 190, 58.5%) | P value |
|---|---|---|---|
| Sex, male (n, %) | 99 (40.6) | 145 (59.4) | 0.54 |
| Age (years) | 55 (26-73) | 56 (16-79) | 0.08 |
| History of complications (n, %) | 43 (32) | 62 (32.6) | 0.909 |
| Encephalopathy | 40 (29.6) | 42 (22.1) | 0.124 |
| GI bleeding | 17 (12.6) | 25 (13.1) | 0.89 |
| Spontaneous bacterial peritonitis | |||
| Albumin (median, range, g/dL) | 3.4 (1.6-7) | 3.1 (1.6-12) | < 0.001 |
| Bilirubin (median, range, mg/dL) | 1.58 (0.24-52) | 2.9 (0.30-35) | < 0.001 |
| INR (median, range) | 1.3 (0.93-2.47) | 1.4 (0.94-5.94) | < 0.001 |
| Urea (median, range, mg/dL) | 30.5 (10-106) | 37.5 (11-302) | < 0.001 |
| Creatinine (median, range, mg/dL) | 0.89 (0.53-2.02) | 0.99 (0.46-3.30) | 0.002 |
| Glomerular filtration rate (GFR), (median, range, mL/min) | 75 (9-131) | 74 (16-150) | < 0.001 |
| ALT (median, range, IU/L) | 28 (10-250) | 37 (4-662) | 0.002 |
| Platelets (median, range, 103/μL) | 88 (19-491) | 74 (13-309) | 0.03 |
| Ferritin (median, range, ng/mL) | 358 (5-1166) | 358 (9-3397) | 0.001 |
| ALBI grade (median, range) | -1.9 (-4.9- -0.36) | -1.42 (-8.6 - -0.09) | < 0.001 |
| PALBI grade (median, range) | -2.1 (-3.5- -0.77) | -1.76 (-5.08 - -0.58) | < 0.001 |
| CTP score (mean ± SD) | 8 ±2 | 9 ± 2 | < 0.001 |
| MELD score (median, range) | 12 (6-27) | 16 (7-40) | < 0.001 |
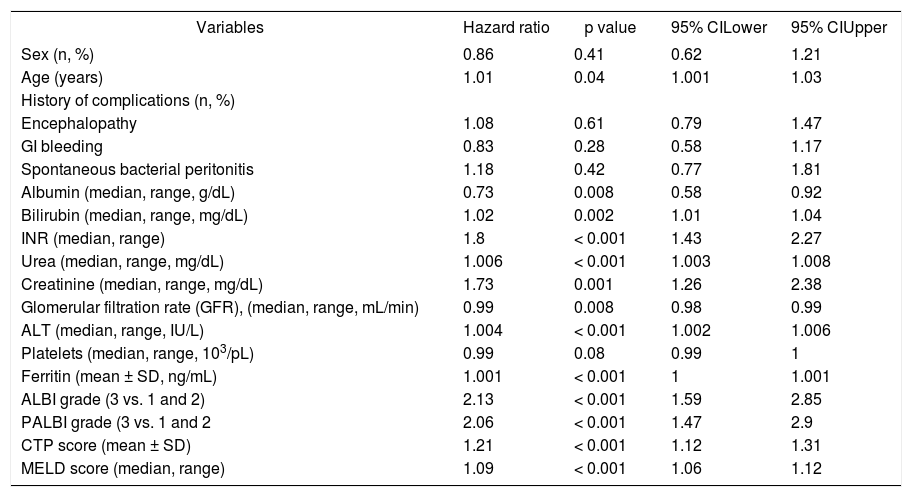
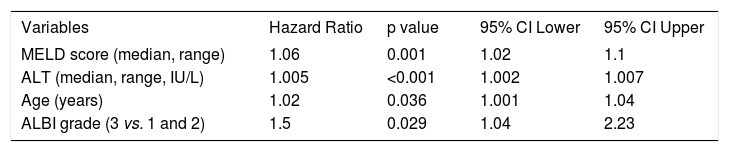
Univariate cox regression analysis showed that age (HR: 1.01, 95%CI [1.001, 1.03], p = 0.04), urea (HR: 1.006, 95%CI [1.003, 1.008], p < 0.001), creatinine (HR: 1.73, 95%CI [1.26, 2.38], p = 0.001), INR (HR: 1.8, 95%CI [1.43, 2.27], p < 0.001), ALT (HR: 1.004, 95%CI [1.002, 1.006], p < 0.001) and serum ferritin (HR: 1.001, 95%CI [1.00, 1.001], p < 0.001) were statistically significant factors associated with our patients’ outcome (Table 3). Serum albumin levels (HR: 0.73, 95%CI [0.58, 0.92], p = 0.008) and “true” GFR (HR: 0.99, 95%CI [0.98, 0.99], p = 0.008) were protective factors against death/LT, while total bilirubin levels represented significant risk factor which burdens patients’ prognosis (HR: 1.02, 95%CI [1.01, 1.04], p = 0.002). MELD and CTP scores showed important prognostic role (HR: 1.09, 95%CI [1.06, 1.12], p < 0.001 and HR: 1.21, 95%CI [1.12, 1.31], p < 0.001, respectively). ALBI and PALBI grades had also significant association with our patients’ outcome. More specifically, using the proposed cut off points for ALBI grade,8 we categorized our patients into three groups: ALBI grade 1 (score < -2.60) (n = 30); ALBI grade 2 (more than -2.60 to < -1.39) (n = 175); and ALBI grade 3 (> -1.39) (n = 120). According to the univariate cox regression analysis patients categorized as ALBI grade 3 presented significantly high risk of death/LT compared to ALBI grade 1 and 2 (HR: 2.13, 95%CI [1.59, 2.85], p < 0.001). Similarly, there were three groups of patients based on the proposed cut off points of PALBI grade:9 PALBI grade 1 (score < -2.53) (n = 41); PALBI grade 2 (more than -2.53 to < -2.09) (n = 85); and PALBI grade 3 (> -2.09) (n = 199). Patients on PALBI grade 3 had almost twice the risk of death/LT vs. PALBI 1 and 2 (HR: 2.06, 95%CI [1.47-2.9], p < 0.001). Multivariate Cox regression analysis showed that MELD score (HR: 1.06, 95%CI [1.02-1.1], p = 0.001), ALT (HR: 1.005, 95% CI [1.002-1.007], p < 0.001), age (HR: 1.02, 95%CI [1.001-1.04], P = 0.036) and ALBI grade (3 vs. 1 and 2) (HR: 1.5, 95%CI [1.04-2.23], p = 0.029) were independently associated with death/LT (Table 4).
Clinical and laboratory characteristics of 325 patients with stable decompensated cirrhosis associated with the outcome (univariate analysis).
| Variables | Hazard ratio | p value | 95% CILower | 95% CIUpper |
|---|---|---|---|---|
| Sex (n, %) | 0.86 | 0.41 | 0.62 | 1.21 |
| Age (years) | 1.01 | 0.04 | 1.001 | 1.03 |
| History of complications (n, %) | ||||
| Encephalopathy | 1.08 | 0.61 | 0.79 | 1.47 |
| GI bleeding | 0.83 | 0.28 | 0.58 | 1.17 |
| Spontaneous bacterial peritonitis | 1.18 | 0.42 | 0.77 | 1.81 |
| Albumin (median, range, g/dL) | 0.73 | 0.008 | 0.58 | 0.92 |
| Bilirubin (median, range, mg/dL) | 1.02 | 0.002 | 1.01 | 1.04 |
| INR (median, range) | 1.8 | < 0.001 | 1.43 | 2.27 |
| Urea (median, range, mg/dL) | 1.006 | < 0.001 | 1.003 | 1.008 |
| Creatinine (median, range, mg/dL) | 1.73 | 0.001 | 1.26 | 2.38 |
| Glomerular filtration rate (GFR), (median, range, mL/min) | 0.99 | 0.008 | 0.98 | 0.99 |
| ALT (median, range, IU/L) | 1.004 | < 0.001 | 1.002 | 1.006 |
| Platelets (median, range, 103/pL) | 0.99 | 0.08 | 0.99 | 1 |
| Ferritin (mean ± SD, ng/mL) | 1.001 | < 0.001 | 1 | 1.001 |
| ALBI grade (3 vs. 1 and 2) | 2.13 | < 0.001 | 1.59 | 2.85 |
| PALBI grade (3 vs. 1 and 2 | 2.06 | < 0.001 | 1.47 | 2.9 |
| CTP score (mean ± SD) | 1.21 | < 0.001 | 1.12 | 1.31 |
| MELD score (median, range) | 1.09 | < 0.001 | 1.06 | 1.12 |
Multivariate analysis to identify the independent factors associated with the outcome in 325 patients with stable decompensated cirrhosis.
| Variables | Hazard Ratio | p value | 95% CI Lower | 95% CI Upper |
|---|---|---|---|---|
| MELD score (median, range) | 1.06 | 0.001 | 1.02 | 1.1 |
| ALT (median, range, IU/L) | 1.005 | <0.001 | 1.002 | 1.007 |
| Age (years) | 1.02 | 0.036 | 1.001 | 1.04 |
| ALBI grade (3 vs. 1 and 2) | 1.5 | 0.029 | 1.04 | 2.23 |
We applied survival analysis using the proposed cut off points for ALBI grade. The Kaplan-Meier curves detected statistically significant different survival between the three groups (Figure 1A). Specifically, ALBI grade 1 had a clearly superior median survival at 60.7 months (41-80.3) compared to ALBI grade 2 [24 (20.6-27.3)] and ALBI grade 3 [12 (11.3-12.7)], p < 0.001. Then, we divided our cohort in two groups. those with ALBI grade 1 (n = 30, 9.3%) and those with ALBI grade 2 and 3 (n = 295, 90.7%), based on their different survival. The two groups were significantly different regarding MELD [10 (range: 6-15) vs. 15 (6-40), p < 0.001] and CTP score [7 (range: 5-10) vs. 9 (range: 5-14), p < 0.001].
 (log-rank, p < 0.001 between all grades) and PALBI grades (B) (p = 0.228 between PALBI grade 1 and 2 p = 0.005 between PALBI grade 2 and 3).")
Performance of the ALBI and PALBI grade in patients with stable decompensated cirrhosis. Kaplan-Meier curves illustrate survival according to ALBI (A) (log-rank, p < 0.001 between all grades) and PALBI grades (B) (p = 0.228 between PALBI grade 1 and 2 p = 0.005 between PALBI grade 2 and 3).
As for PALBI, according to the survival analysis, patients with PALBI grade 1 and 2 did not differ significantly (p = 0.228), though PALBI grade 2 had significantly different median survival time against PALBI grade 3 [30 (21.4-38.5) vs. 12 (10.7-13.2) months, p = 0.005] (Figure 1B). Then, we divided our cohort in two groups. those with PALBI grade 1 and 2 (n = 126, 38.8%) and those with PALBI grade 3 (n = 199, 61.2%). The two groups had significant variation regarding MELD [11 (range: 6-20) vs. 15 (7-40), p < 0.001] and CTP score [8 (range: 5-12) vs. 9 (range: 5-14), p < 0.001]. Interestingly, the group of patients with PALBI grade 3, compared to those with PALBI grade 1 and 2, had significantly higher frequency of cirrhosis-related complications (encephalopathy: 17.5% vs. 39.7%, p < 0.001 and SBP: 4.8% vs. 17%, p = 0.004).
Finally, we divided our patients in two groups using as cut-off points the median values of ALBI and PALBI grades. Patients with ALBI grade lower than the median value of ALBI, i.e. in our cohort -1.6, presented significantly higher time of survival against those with ALBI grade higher than -1.6; [31 (21.4-40.6) vs. 12 (11.4-12.6), p < 0.001]. Regarding PALBI grade, the results showed the same significance using as cut-off point the median value of PALBI in our cohort, i.e. -1.89; [28 (21.6-34.3) vs. 12 (11.4-12.6)] (Figure 2).
Discriminative ability of prognostic scores based on ROC curves the median value of ALBI (log-rank, p < 0.001), (B) the median value of PALBI (log-rank, p < 0.001).")
The discriminatory capabilities of ALBI grade, PALBI grade, MELD score and CTP score, were tested using ROC curves. Based on the area under the curve, ALBI grade had very good discriminative ability to predict the outcome (death or LT) (AUC: 0.695, 95% CI [0.634, 0.755). It was not statistically different than MELD score (AUC: 0.722, 95%CI [0.664, 0.780]), p = 0.3255), though it came superior to CTP score (AUC: 0.611, 95%CI [0.546, 0.675]), p = 0.0044). The performance of PALBI grade (AUC: 0.683, 95% CI [0.621, 0.744]) (Figure 3A) came equally important against ALBI (p = 0.4737) and MELD score (p = 0.1542). Though it was significantly better than CTP score (p = 0.0140). Accordingly, we excluded patients with HCC and estimated the discriminative abilities of ALBI and PALBI (AUC: 0.729, 95% CI [0.665, 0.794] and AUC: 0.714, 95%CI [0.647, 0.780], p = 0.4081). These were superior to that of CTP (AUC: 0.621, 95%CI [0.549, 0.693], p = 0.0007 and p = 0.0052, respectively) and similar to that of MELD (AUC: 0.745, 95%CI [0.682, 0.808], p = 0.6081 and p = 0.3014, respectively) (Figure 3B). Conducting further analysis we found that MELD score had the best discriminative ability (AUC: 0.826, 95%CI [0.726, 0.925]) in patients with NASH (n = 72, 22.2%) against PALBI grade (AUC: 0.674, 95%CI [0.539, 0.809], p = 0.02), and similar to that of ALBI and CTP (AUC: 0.746, 95%CI [0.626, 0.866], p = 0.1476 and AUC: 0.720, 95%CI [0.593, 0.847], p = 0.0626, respectively) (Figure 3C). In patients with alcoholic decompensated cirrhosis (n = 69, 21.1%) ROC analysis gave similar predictive capabilities for all scores, i.e. MELD (AUC: 0.702, 95%CI [0.570, 0.833], PALBI (AUC: 0.686, 95%CI [0.558, 0.814]), ALBI (AUC: 0.656, 95%CI [0.527, 0.786], and CTP (AUC: 0.608, 95%CI [0.473, 0.742]) (Figure 3D) (p values always > 0.05 for all comparisons). Finally for patients with viral hepatitis (n = 112, 34.5%), MELD had better performance (AUC: 0.706, 95%CI [0.606, 0.806]) than CTP (AUC: 0.589, 95%CI [0.472, 0.706], p = 0.026), and similar to that of PALBI (AUC: 0.694, 95%CI [0.591, 0.717], p = 0.1870) and ALBI (AUC: 0.670, 95%CI [0.563, 0.778], p = 0.4819). PALBI also performed better than CTP score (p = 0.0229) (Figure 3E).
. B. Exclusion of HCC patients. C. Patients with NASH, D. Patients with alcoholic cirrhosis. E. Patients with viral hepatitis. F. Exclusion of patients who underwent LT.")
ROC curves for the discriminative ability of the prognostic scores ALBI, PALBI, MELD, CTP to detect our patients’ outcome. A. Whole cohort of decompensated patients (n = 325 patients). B. Exclusion of HCC patients. C. Patients with NASH, D. Patients with alcoholic cirrhosis. E. Patients with viral hepatitis. F. Exclusion of patients who underwent LT.
Then we excluded patients who underwent LT (n = 105), and studied the predictive ability of scores in patients who survived (n = 135) against those who died (n = 85). MELD score had the best predictive ability (AUC: 0.791, 95%CI [0.724, 0.858], though it was neither significantly different than ALBI (AUC: 0.754, 95%CI [0.686, 0.823], p = 0.2825), nor than PALBI (AUC: 0.754, 95%CI [0.686, 0.823], p = 0.2506), but it was superior to CTP (AUC: 0.705, 95%CI [0.632, 0.778], p = 0.0014). ALBI and PALBI came similar (p = 0.9977) each other and against CTP (p = 0.1548 and p = 0.1506, respectively) (Figure 3F).
DiscussionWe evaluated 325 patients with stable decompensated cirrhosis to estimate predictive capability of ALBI and PALBI grades regarding our patients’ outcome (death or LT). Our data analysis managed to validate these objective scores, in a heterogeneous population of patients enlisted for LT. ALBI and PALBI grades proved significant predictive factors regarding our patients’ outcome.
Cirrhosis is an increasing cause of morbidity and mortality in more developed countries.20 Many studies have attempted to develop a classification system that can both characterize the degree of liver injury and predict the prognosis of patients with cirrhosis on the basis of objective clinical and laboratory variables.1 MELD and CTP scores are mainly used for the assessment of prognosis in cirrhosis. A recent metaanalysis reviewed data to evaluate the diagnostic accuracy of CTP and MELD scores in patients with cirrhosis and outlined the need for developing new scores that assess more accurately the prognosis of patients with liver disease.21
Accordingly, Johnson, et al.8 created a new score, ALBI grade, using only two biochemical parameters, serum albumin and total bilirubin levels. The principal idea was to present a simple, discriminatory method for assessing liver function, primarily introduced in patients with HCC. These patients had associated chronic liver disease, either at the stage of cirrhosis, or at a range of liver pathology from mild abnormalities to advanced fibrosis.8 Later data confirmed the utility of ALBI grade in overall prognostic discrimination of HCC patients.22 In general, studies have validated this newly introduced score in HCC patients, showing good prognostic power22-25 and the ability to define patients’ management.26-29
Subsequently, studies validated ALBI grade in patients with chronic liver diseases. Zou, et al. demonstrated that ALBI had high predictive capability for in-hospital mortality in a retrospective study of cirrhotic patients with acute upper gastrointestinal bleeding. However, the AUC for predicting the in-hospital mortality was not significantly different between the ALBI (AUC: 0.808) vs. CTP (AUC: 0.785), p = 0.5831, or MELD score (AUC: 0.834), p = 0.70 33.30 Moreover, a large cohort with 806 HBV patients with compensated and decompensated cirrhosis, confirmed the predictive efficacy of ALBI (AUC: 0.787, 95% CI [0.830, 0.833]) and found that ALBI grade 1 patients had the highest survival probability within 40 months (p = 0.0002), while the survival time of ALBI grade 2 was significantly longer than that of grade 3 (p < 0.0001). Lately, in a study published as an abstract form, ALBI was assessed in 626 patients with hepatitis C-related decompensated cirrhosis during their DAA therapy and was announced to be an independent risk factor for clinical deterioration and death (HR: 1.9, 95% CI [1.3, 2.8]).12 As for our study, it is the first one in which ALBI grade was assessed prospectively in a large cohort of patients with stable decompensated cirrhosis of various etiology. We confirmed the discriminative ability of ALBI (AUC: 0.695), which was better than CTP score (AUC: 0.611, p = 0.0044) and rather comparable to that of MELD score (AUC: 0.722, p = 0.3255), regarding the long-term outcome (death or LT) in the total cohort, as well as in subgroups of patients based on the etiology of underlying liver disease. The predictive ability of ALBI came even stronger when the patients with HCC (n = 46, 14%) were excluded from our analysis. In addition, ALBI was a significant risk factor for death/LT (HR: 2.13, 95%CI [1.59-2.85], p < 0.001). Patients with ALBI grade 1 had the longest survival (at 60.7 months) compared to patients with ALBI grade 2 and 3 (log-rank, p < 0.001 between all grades). Interestingly, the median value of ALBI grade, proved ideal cut-off point of significant difference of survival in our patients. Finally, in multivariate analysis we found that ALBI was an independent risk factor associated with patients’ outcome; patients with ALBI grade 3 had almost 1.5 times greater hazard of death/LT compared to ALBI grade 1 and 2 (HR: 1.5, 95%CI [1.04-2.23], P = 0.029).
Regarding PALBI grade, this was introduced in 2015 by Sasan, et al.9 as a new model which incorporated platelet count into the previously described ALBI grade, in order to predict survival of patients with HCC undergoing curative therapies. PALBI grade was validated by Liu, et al.31 and they found that it had good prognostic power in differentiating survival (higher AUC values compared with MELD, CTP, and ALBI grade, all p < 0.05).31 Recently, PALBI was assessed in a cohort of 1,638 patients presenting with acute cirrhosis-related complication, specifically acute variceal bleeding. The results showed that PALBI had better discriminative ability for early mortality than CTP score (AUC: 0.847 vs. 0.672, p < 0.001).13 Accordingly, we examined prospectively, for the first time together with ALBI grade, the abovementioned utility of PALBI in our various cohort of 325 stable decompensated patients. We showed that PALBI was an important risk factor (HR: 2.06, 95%CI [1.47-2.9], p < 0.001) associated with our patients’ outcome. Indeed, PALBI’s discriminatory ability for long-term outcome (AUC: 0.683) came better than CTP score in our cohort too (AUC: 0.611, p = 0.014), and similar to MELD’s score (AUC: 0.722, p = 0.1542). Survival analysis showed significantly different median survival times when diving our patients based on the median value of PALBI grade, too. When we excluded patients with HCC, PALBI had stronger prognostic power (AUC: 0.714), better than CTP (AUC: 0.621, p = 0.0052) and similar to that of MELD score (AUC: 0.745, p = 0.3014). So, we confirmed the potential of PALBI grade to assess the outcome of stable patients with decompensated cirrhosis. Moreover, in our cohort patients with PALBI grade 3 had more frequently a previous history of cirrhosis related complications. Further studies are needed to elucidate the predictive performance of PALBI for development of cirrhosis-related complications.
In general, our prospective study is the first to establish the utility of both ALBI and PALBI in the largest heterogeneous cohort of patients with stable decompensated cirrhosis with various etiology of underlying liver disease awaiting for LT and we were able to confirm their predictive role. Ideally, this could allow us to classify our patients according to their ALBI or PALBI grade and manage them based on their expected clinical outcome.
Our study has some limitations regarding the appliance of our findings. It is unclear what our findings imply regarding the existing scores, MELD or CTP scores. For example, whether could we replace CTP classification with these newly proposed grades, it is not definite. Besides, we have not yet clarified under which circumstances we should apply which score; on the other hand, this might represent the prognostic advantage of ALBI and PALBI grades given that we have validated their use in stable decompensated cirrhotic patients with various etiology of liver disease. We did not evaluate the performance of ALBI and PALBI grades regarding our patients’ short-term outcome, i.e. complications of their disease, hospitalizations etc. Besides, it might be useful to assess how ALBI and PALBI changes in the course of the disease and what this means. Further studies are needed to establish the predictive utility of PALBI grade regarding cirrhosis related complications. Finally, we acknowledge there are restrictions as it is a single center study.
In conclusion, our study presented strong evidence that ALBI and PALBI grades are trustworthy in predicting stable decompensated cirrhosis patients’ outcome. Further research is needed to confirm our findings. Though their significance is established and clinical appliance is feasible.
Abbreviations- •
ALBI: albumin-bilirubin grade.
- •
AUC: area under the curve
- •
CTP: Child-Pugh.
- •
DAA therapy: direct acting antiviral therapy.
- •
HCC: hepatocellular carcinoma.
- •
LT: liver transplantation.
- •
MELD: Model for End stage Liver Disease.
- •
MELDNa: MELD-sodium score.
- •
PALBI: platelet count-albumin-bilirubin grade.
- •
PBC: primary biliary cholangitis.
- •
ROC: receiver operating curve.
- •
SBP: spontaneous bacterial peritonitis.
Nothing to disclose.
Conflicts of InterestThe authors declares that there is no conflict of interest regarding the publication of this article.
Author’s ContributionsConception and design: Theodora Oikonomou, Evangelos Cholongitas.
Analysis and interpretation of the data: Theodora Oikonomou.
Drafting of the article: Theodora Oikonomou, Ioannis Goulis, Evangelos Cholongitas.
Critical revision of the article: Petros Doumtsis, Theodora Tzoumari, Evangelos Akriviadis.
Final approval: all the authors.
AcknowledgementsNo external funding was received for this study.


