


Introduction: Leptin has been implicated in the pathogenesis of nonalcoholic steatohepatitis. It has also beensuggested that adiponectin plays an important role in the transition from fatty liver disease to nonalcoholic steatohepatitis.
Objective: To evaluate whether leptin and adiponectin levels are related to the degree of necroinflammatory activity and fibrosis in patients with nonalcoholic steatohepatitis.
Methods: Leptin and adiponectin levels were determined in 52 patients with nonalcoholic steatohepatitis and in 49 controls by enzyme-linked immunosorbent analysis. Results: Median (interquartile range) leptin levels were higher in patients with nonalcoholic steatohepatitis than in the controls (5.75 (12.3) ng mL-1 and 2.80 (2.40) ng mL-1, respectively; P = 0.0035). Adiponectin levels were lower in patients with nonalcoholic steatohepatitis than in the controls (6.55 (5.05), μg mL-1 and 9.30 (6.70) mg, μL-1, respectively; P = 0.0218). Leptin levels were lower in overweight patients than in obese patients (2.25 (6.73) and 8.0 (16.0) ng mL-1, respectively; P = 0.0025). The amount of necroinflammatory activity observed in liver biopsies correlated positively with the amount of fibrosis (P < 0.0001). Increased lactate dehydrogenase correlated with increased fibrosis in patients with nonalcoholic steatohepatitis (P = 0.0012). Necroinflammatory activity correlated with adiponectin, γ-glutamyltranspeptidase, the quantitative insulin-sensitivity check index, and ferritin (P < 0.05). Risk factors for nonalcoholic steatohepatitis in the logistic regression analysis were leptin, aspartate aminotransferase, alanine aminotransferase, alkaline phosphatase, and γ-glutamyltranspeptidase (P < 0.0001). Only lactate dehydrogenase (P = 0.0012) was significantly associated with advanced fibrosis on logistic regression analysis.
Conclusions: Lactate dehydrogenase was associated with fibrosis and advanced fibrosis. Leptin was associated with nonalcoholic steatohepatitis but not with fibrosis or necroinflammatory activity. Adiponectin was related to necroinflammatory activity. Risk factors for nonalcoholic steatohepatitis were leptin and liver enzymes (aspartate aminotransferase, alanine aminotransferase, alkaline phosphatase, and γ-glutamyltranspeptidase).
NAFLD - Nonalcoholic fatty liver disease
NASH - Nonalcoholic stetatohepatitis
DM2 - Type 2 diabetes mellitus
ob/ob - Homozygous for the ob gene
IR - Insulin resistance
BMI - Body mass index
WHR - Waist-to-hip ratio
QUICKI - Quantitative insulin-sensitivity check index
HDL - High-density lipoproteins
LDL - Low-density lipoproteins
AST - Aspartate aminotransferase
ALT - Alanine aminotransferase
ALP - Alkaline phosphatase
yGT - Gamma-glutamyltranspeptidase
CP - Child-Pugh
LD - Lactate dehydrogenase
IntroductionNonalcoholic steatohepatitis (NASH) is recognized as a common and serious form of chronic liver disease in North America.1 The prevalence of obesity in the general population has been estimated to be 24% worldwide.2 In Mexico, the prevalence of obesity has increased from 21.5% in 1993 to 30% in 2006 in the population over 20 years of age, and is more common in women.3 Overweight and obesity are prevalent in nearly 70% of the population between 30 and 60 years of age.3,4 This has been confirmed in the rural population.5 It is well recognized that only 3% of the lean population suffers from nonalcoholic fatty liver disease (NAFLD), whereas 74% of the obese population suffers from NAFLD.2 The frequency of hepatic steatosis varies with ethnicity, occurring in 45% of Hispanics, 33% of Caucasians, and 24% of African-Americans.6
Risk factors for NASH include type 2 diabetes mellitus (DM2; 34%-75%)7-11 hyperlipidemia, in particular hypertriglyceridemia (20%-80%),7,9-12 and obesity (69%-100%),8-11 all of which are components of the metabolic syndrome. Some of these risk factors are related to the presence of inflammation and fibrosis.2
Leptin stimulates the expression of type I collagen and is a mediator of hepatic fibrosis.13 Leptin has been implicated in the pathogenesis of NASH.14 Tumor necrosis factor a further enhances fibrogenesis by promoting gene expression in and remodeling of the extracellular matrix.15 Leptin-deficient ob/ob mice display changes in several profibrogenic factors. Treatment of ob/ob mice with leptin corrects their leptin deficiency and normalizes their fibrotic response to hepatotoxins.13
Low adiponectin levels have been strongly implicated in the development of insulin resistance (IR) in mouse models of both obesity and lipoatrophy.16 In humans, plasma levels of adiponectin are significantly lower in insulin-resistant states, including DM2.17 It has been suggested that adiponectin plays an important role in the transition from fatty liver disease to NASH.18 Reduced levels of adiponectin have been independently associated with higher necroinflammatory grades in patients with NAFLD.19
Leptin has been implicated in the pathogenesis of NASH in a second-hit hypothesis.20 The aim of this study was to evaluate whether serum leptin and adiponectin levels were related to the degree of necroinflammatory activity and fibrosis in patients with NASH selected from the outpatient clinic of the Liver Unit of the University Hospital “Dr. José E. González”.
Materials and methodsCharacteristics of the patient and control groupsFifty-two consecutive patients with biopsy-proven NASH (19 women and 33 men), seen at the Liver Unit of the University Hospital “Dr. José E. González” from May 2002 to June 2005, were included in this study. All patients were from the northeast of Mexico. The median age of the patients was 43, with an interquartile range of 20 years. The patients were given advice on a balanced diet. A single pathologist (JF) interpreted the grading and staging of the liver biopsies according to Brunt,21 where grading (G) indicates the amount of steatosis, necroinflammatory activity, and ballooning, and F refers to grades of fibrosis. The slides were stained with hematoxylin and eosin and Masson trichrome stain. Patients with chronic liver diseases of other etiologies were excluded. None of the participants drank more than 40 g of alcohol per week. The patients were analyzed according to body mass index (BMI, kg m-2), and individuals were classified as normal (BMI < 25), overweight (25 ≤ BM < 30), or obese BMI ≥ 30. The control group contained 49 normal healthy subjects (24 women and 25 men) with a median (interquartile range [IQR]) age of 39 (22) years. In this group, leptin, adiponectin, BMI (< 25 kg m-2), and waist-to-hip ratio (WHR, cm/cm) measurements were made. All members of the control group had normal liver function tests (LFTs: albumin, 3.4-5.4 g dL-1; alkaline phosphatase [ALP], 44-147 IU L-1; alanine aminotransferase [ALT], 0-45 IU L-1; aspartate aminotransferase [AST], 10-34 IU L-1; γ-glutamyltranspeptidase [γGT], 051 IU L-1; lactate dehydrogenase [LD], 45-90 IU L-1; total bilirubin, 0.3-1.9 mg dL-1; and direct bilirubin, 0-0.3 mg dL-1. The study protocol was consistent with the ethical guidelines of the Declaration of Helsinki.
Laboratory evaluationLaboratory studies included the measurement of autoantibodies (anti-smooth muscle, antinuclear, antimito-chondrial, anti-liver-kidney-microsome), hepatitis B surface antigen, hepatitis B core antibody, and antibody to hepatitis C virus, all of which were negative. Serum adiponectin levels (Human Adiponectin enzyme-linked immunosorbent assay (ELISA) kit, B-Bridge International Inc., US), serum leptin levels (Leptin Micro template ELISA kit, DRG Diagnostic, Germany), glucose, insulin, IR (as calculated by the quantitative insulin-sensitivity check index [QUICKI-IR]),22 triglycerides, total cholesterol, high-density lipoproteins (HDL), low-density lipoproteins (LDL), ferritin, α-fetoprotein, BMI (kg m-2), WHR, and LFTs were measured. Leptin and adiponectin levels were measured in blood withdrawn in the morning, after an overnight fast. The blood samples were centrifuged immediately and the serum samples were stored at -20 °C until analysis.
Statistical analysisData are presented as medians and IQRs and were analyzed using the Mann-Whitney or Jonckheere-Terpstra test, where appropriate. P values were calculated by exact methods. The Kendall tau-c coefficient was used to evaluate the relationship between fibrosis and necroinflammatory activity. Univariate logistic regression analysis was used to analyze liver necroinflammatory activity, fibrosis, and NASH, with logit and clogit link functions for binomial and multinomial data, respectively. All statistical analyses were performed with SPSS 16.0. A P value of less than 0.05 was considered statistically significant.
ResultsThirty-one patients with NASH (57%) were obese, 18 patients (33%) were overweight, and three patients (10%) had a normal BMI. Hypercholesterolemia (cholesterol level > 200 mg dL-1) was found in 18 patients (33%), hypertriglyceridemia (triglyceride level ≥ 150 mg dL-1) in 29 patients (53%), and DM2 in 14 patients (25%).
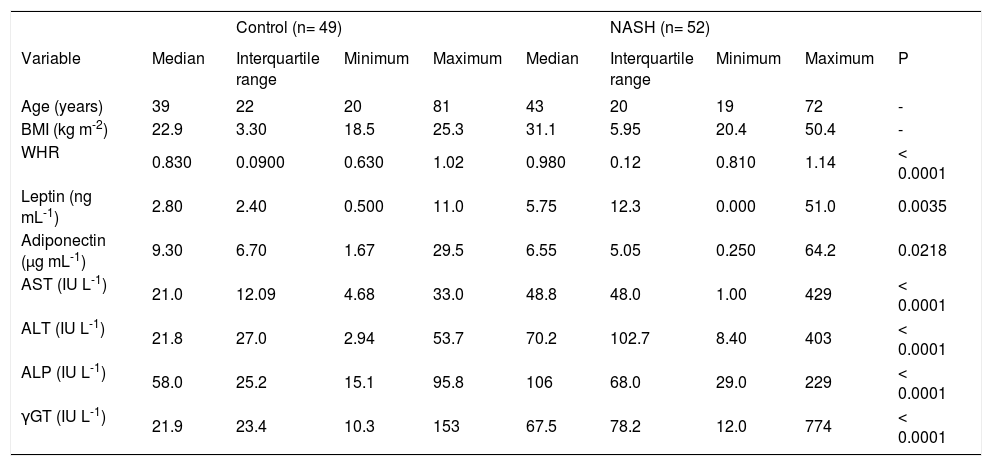
Significant differences were observed between the patient group and the control group in WHR, leptin, adiponectin, AST, ALT, ALP, and γGT. The median (IQR) leptin levels were higher in the patient group with NASH than in the control group (5.75 (12.3) ng mL-1 and 2.80 (2.40) ng mL-1, respectively; P = 0.0035). Adiponectin levels were lower in patients with NASH than in the control group (6.55 (5.05) μg mL-1 and 9.30(6.70) μg mL-1, respectively; P = 0.0218; (Table I).
Analysis anthropometrical and biochemistry of patients with NASH and controls.
| Control (n= 49) | NASH (n= 52) | ||||||||
|---|---|---|---|---|---|---|---|---|---|
| Variable | Median | Interquartile range | Minimum | Maximum | Median | Interquartile range | Minimum | Maximum | P |
| Age (years) | 39 | 22 | 20 | 81 | 43 | 20 | 19 | 72 | - |
| BMI (kg m-2) | 22.9 | 3.30 | 18.5 | 25.3 | 31.1 | 5.95 | 20.4 | 50.4 | - |
| WHR | 0.830 | 0.0900 | 0.630 | 1.02 | 0.980 | 0.12 | 0.810 | 1.14 | < 0.0001 |
| Leptin (ng mL-1) | 2.80 | 2.40 | 0.500 | 11.0 | 5.75 | 12.3 | 0.000 | 51.0 | 0.0035 |
| Adiponectin (μg mL-1) | 9.30 | 6.70 | 1.67 | 29.5 | 6.55 | 5.05 | 0.250 | 64.2 | 0.0218 |
| AST (IU L-1) | 21.0 | 12.09 | 4.68 | 33.0 | 48.8 | 48.0 | 1.00 | 429 | < 0.0001 |
| ALT (IU L-1) | 21.8 | 27.0 | 2.94 | 53.7 | 70.2 | 102.7 | 8.40 | 403 | < 0.0001 |
| ALP (IU L-1) | 58.0 | 25.2 | 15.1 | 95.8 | 106 | 68.0 | 29.0 | 229 | < 0.0001 |
| γGT (IU L-1) | 21.9 | 23.4 | 10.3 | 153 | 67.5 | 78.2 | 12.0 | 774 | < 0.0001 |
NASH: nonalcoholic stetatohepatitis; BMI: body mass index; WHR: waist/hip ratio; AST: aspartate aminotransferase; ALT: alanine aminotransferase; ALP: alkaline phosphatase; •GT: gamma-glutamyltranspeptidase; P: Mann-Whitney test, P-value
Leptin was elevated in patients with BMI < 25 or BMI > 30. No differences were detected in adiponectin, ALP, or ferritin levels according to BMI. The group of overweight patients showed the highest levels of ALT (Table II).
Analysis of necroinflammatory activity, fibrosis, adipokines and liver enzymes in patients with NASH according to BMI class.
| BMI < 25 (n= 3) | 25 ≤ BMI < 30 (n = 18) | 30 ≤ BMI (n = 31) | |||||||||||
|---|---|---|---|---|---|---|---|---|---|---|---|---|---|
| Variable | Med* | IQR | Min | Max | Med | IQR | Min | Max | Med | IQR | Min | Max | P |
| Age (years) | 45 | 22 | 40 | 62 | 31 | 20 | 19 | 72 | 44 | 13 | 21 | 66 | 0.1070 |
| G* | 1.0 | 2.0 | 1.0 | 3.0 | 1.5 | 1.0 | 1.0 | 3.0 | 2.0 | 1.0 | 1.0 | 3.0 | 0.9246 |
| F | 3.0 | 2.0 | 2.0 | 4.0 | 2.5 | 2.0 | 1.0 | 5.0 | 3.0 | 4.0 | 1.0 | 5.0 | 0.9566 |
| WHR | 0.934 | 0.108 | 0.880 | 0.988 | 0.970 | 0.0980 | 0.820 | 1.09 | 0.990 | 0.140 | 0.810 | 1.14 | 0.4621 |
| Leptin (ng mL-1) | 8.50 ab*** | 12.5 | 3.50 | 16.0 | 2.25 a | 6.73 | 0.00 | 13.00 | 8.00 b | 16.0 | 0.00 | 51.0 | 0.0025 |
| Adiponectin (μg mL-1) | 6.10 | 5.70 | 2.20 | 7.90 | 5.90 | 4.80 | 1.40 | 64.20 | 6.80 | 5.00 | 0.25 | 38.4 | 0.3977 |
| AST (IU L-1) | 39.0 | 156 | 39.0 | 195 | 63.0 | 35.1 | 25.7 | 429.0 | 42.5 | 55.7 | 1.00 | 320 | 0.4057 |
| ALT (IU L-1) | 67.2 ab | 220 | 37.8 | 258 | 136 a | 125 | 13.0 | 286 | 60.4 b | 55.0 | 8.00 | 403 | 0.0266 |
| ALP (IU L-1) | 154 | 90.7 | 101 | 192 | 110 b | 65.2 | 42.8 | 229.3 | 93.0 | 59.2 | 29.0 | 218 | 0.1792 |
| γGT (IU L-1) | 280 | 410 | 112 | 522 | 61.3 | 75.8 | 12.4 | 402.2 | 60.3 | 71.0 | 12.0 | 774 | 0.0829 |
| Ferritin (ng mL-1) | 198 | 403 | 127 | 531 | 268 | 337 | 1.00 | 1731 | 182 | 172 | 9.00 | 815 | 0.2005 |
| Triglycerides (mg dL-1) | 232 | 68 | 183 | 251 | 204 | 74.5 | 75.0 | 353.0 | 144 | 100 | 61.0 | 577 | 0.0528 |
Leptin, adiponectin, and AST were the only variables related to sex and/or age (P < 0.05). The interaction between sex and group (NASH patients vs controls) was significant for leptin and AST. The median leptin level was 12 ng mL-1 for women with NASH but only 3 ng mL-1 for the other groups. Among the women, AST was elevated by 55 IU L-1 in the NASH group relative to that in the control group, whereas this increment (20 IU L-1) was lower among the men. Adiponectin showed a significant interaction with sex and age. Older women had the highest adiponectin levels (10 μg mL-1), whereas older men had the lowest adiponectin levels (4μg mL-1).
Among patients rated F4 for fibrosis, there was no statistical difference in adiponectin or leptin levels according to the Child-Pugh classification (CP-A, B, or C).
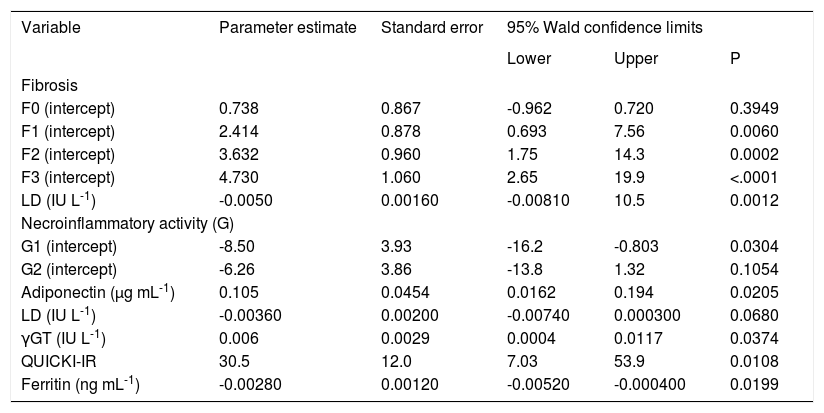
Liver histologyThe amount of necroinflammatory activity on liver biopsies was related positively to the amount of fibrosis (Kendall’s tau-c coefficient: 0.647; P < 0.0001; 95% confidence interval, 0.477-0.817). Ninety-six percent of patients with grade 0–1 fibrosis had grade 1 necroinflammatory activity. Conversely, 95% of patients with grade 3–4 fibrosis had grade 2–3 necroinflammatory activity. Patients with grade 3–4 fibrosis also had high levels of LD. Graphing the model in table III, we found the following cut-off points. When the level of LD was lower than 390 IU L-1, grade 0-1 was most frequent; when LD was 390-650 IU L-1, grade 1-2 fibrosis was predominant. The other limit was LD = 740 IU L-1, below which grade 2-3 fibrosis was predominant. Finally, above LD = 740 IU L-1, the highest grades of fibrosis (3 and 4) were present (data calculated from the model in table III).
Multinomial logistic model for different degree of fibrosis (F) and necroinflammatory activity (G) in patients with NASH.
| Variable | Parameter estimate | Standard error | 95% Wald confidence limits | ||
|---|---|---|---|---|---|
| Lower | Upper | P | |||
| Fibrosis | |||||
| F0 (intercept) | 0.738 | 0.867 | -0.962 | 0.720 | 0.3949 |
| F1 (intercept) | 2.414 | 0.878 | 0.693 | 7.56 | 0.0060 |
| F2 (intercept) | 3.632 | 0.960 | 1.75 | 14.3 | 0.0002 |
| F3 (intercept) | 4.730 | 1.060 | 2.65 | 19.9 | <.0001 |
| LD (IU L-1) | -0.0050 | 0.00160 | -0.00810 | 10.5 | 0.0012 |
| Necroinflammatory activity (G) | |||||
| G1 (intercept) | -8.50 | 3.93 | -16.2 | -0.803 | 0.0304 |
| G2 (intercept) | -6.26 | 3.86 | -13.8 | 1.32 | 0.1054 |
| Adiponectin (μg mL-1) | 0.105 | 0.0454 | 0.0162 | 0.194 | 0.0205 |
| LD (IU L-1) | -0.00360 | 0.00200 | -0.00740 | 0.000300 | 0.0680 |
| γGT (IU L-1) | 0.006 | 0.0029 | 0.0004 | 0.0117 | 0.0374 |
| QUICKI-IR | 30.5 | 12.0 | 7.03 | 53.9 | 0.0108 |
| Ferritin (ng mL-1) | -0.00280 | 0.00120 | -0.00520 | -0.000400 | 0.0199 |
QUICKI-IR: quantitative insulin sensitivity check index; •GT: gamma-glutamyltranspeptidase; LD: lactate dehydrogenase. Number of observations: F0-9; F1-14; F2-9; F3-12; F4-10.
Adiponectin, LD, γGT, QUICKI-IR, and ferritin were associated with the grade of necroinflammatory activity. In all cases, grade 3 was the prevalent grade, followed by grade 1. Grade 1 necroinflammatory activity increased as ferritin and LD increased, whereas grades 2 and 3 decreased. In contrast, adiponectin, γGT, and QUICKI-IR increased with grade 2 or 3 necroinflammatory activity.
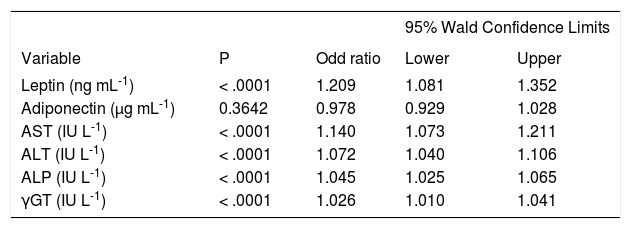
Logistic regression analysisThe risk factors related to the presence of NASH on univariate logistic regression analysis were leptin, AST, ALT, ALP, and γGT. Because the number of samples was small, a multivariate analysis could not be performed. Several models explain the presence of NASH well. Although all the variables were significant, the odd ratios were near 1 and not greater than 1.4. Leptin was the variable with the highest odds ratio, followed by that of AST. Adiponectin was not a significant risk factor (Table IV).
Logistic regression analysis of risk factors for presence of NASH (biopsy proven).
| 95% Wald Confidence Limits | ||||
|---|---|---|---|---|
| Variable | P | Odd ratio | Lower | Upper |
| Leptin (ng mL-1) | < .0001 | 1.209 | 1.081 | 1.352 |
| Adiponectin (μg mL-1) | 0.3642 | 0.978 | 0.929 | 1.028 |
| AST (IU L-1) | < .0001 | 1.140 | 1.073 | 1.211 |
| ALT (IU L-1) | < .0001 | 1.072 | 1.040 | 1.106 |
| ALP (IU L-1) | < .0001 | 1.045 | 1.025 | 1.065 |
| γGT (IU L-1) | < .0001 | 1.026 | 1.010 | 1.041 |
AST: aspartate aminotransferase; ALT: alanine aminotransferase; ALP: alkaline phosphatase; •GT: gamma-glutamyltranspeptidase.
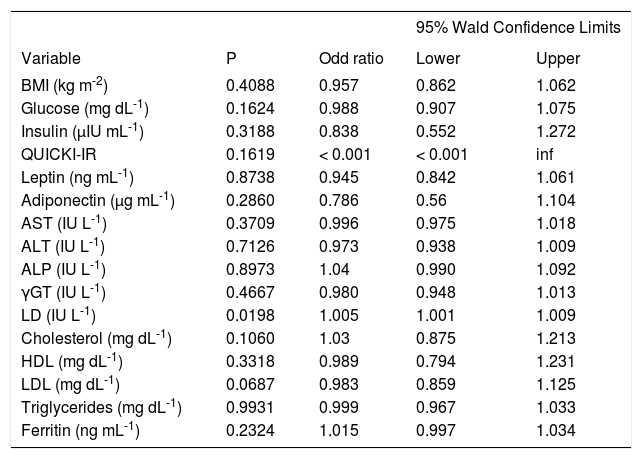
Only LD was significantly associated with advanced fibrosis on univariate logistic regression analysis, with a very low odds ratio (Table V).
Logistic regression analysis of patients with initial fibrosis (F0, F1, F2) vs patients with advanced fibrosis (F3, F4).
| 95% Wald Confidence Limits | ||||
|---|---|---|---|---|
| Variable | P | Odd ratio | Lower | Upper |
| BMI (kg m-2) | 0.4088 | 0.957 | 0.862 | 1.062 |
| Glucose (mg dL-1) | 0.1624 | 0.988 | 0.907 | 1.075 |
| Insulin (μIU mL-1) | 0.3188 | 0.838 | 0.552 | 1.272 |
| QUICKI-IR | 0.1619 | < 0.001 | < 0.001 | inf |
| Leptin (ng mL-1) | 0.8738 | 0.945 | 0.842 | 1.061 |
| Adiponectin (μg mL-1) | 0.2860 | 0.786 | 0.56 | 1.104 |
| AST (IU L-1) | 0.3709 | 0.996 | 0.975 | 1.018 |
| ALT (IU L-1) | 0.7126 | 0.973 | 0.938 | 1.009 |
| ALP (IU L-1) | 0.8973 | 1.04 | 0.990 | 1.092 |
| γGT (IU L-1) | 0.4667 | 0.980 | 0.948 | 1.013 |
| LD (IU L-1) | 0.0198 | 1.005 | 1.001 | 1.009 |
| Cholesterol (mg dL-1) | 0.1060 | 1.03 | 0.875 | 1.213 |
| HDL (mg dL-1) | 0.3318 | 0.989 | 0.794 | 1.231 |
| LDL (mg dL-1) | 0.0687 | 0.983 | 0.859 | 1.125 |
| Triglycerides (mg dL-1) | 0.9931 | 0.999 | 0.967 | 1.033 |
| Ferritin (ng mL-1) | 0.2324 | 1.015 | 0.997 | 1.034 |
BMI: body mass index; QUICKI-IR: quantitative insulin sensitivity check index; AST: aspartate aminotransferase; ALT: alanine aminotransferase; ALP: alkaline phosphatase; •GT: gamma-glutamyltranspeptidase; LD: lactate dehydrogenase; HDL: high-density lipoprotein; LDL: low-density lipoprotein.
Many patients with NASH have hyperinsulinemia, IR, or metabolic syndrome,23-25 even if they do not have DM and are not obese.23-27 Excessive fat in the hepatocytes may set the stage for the necroinflammation and fibrosis observed in NASH.
Studies have demonstrated the profibrogenic nature of hyperinsulinemia and hyperglycemia.28 Leptin promotes IR and contributes to both oxidative stress and the enhanced secretion of inflammatory cytokines.20 The leptin secreted by stellate cells may induce fibrosis through transforming growth factor β. It has been suggested that leptin is essential for the development of fibrosis in mice.13 In humans, leptin increases during NASH, and correlates positively with insulin levels.29 There are fibrogenic stimuli other than leptin.30 Patients with alcoholic cirrhosis have increased levels of leptin,31,32 which correlate with BMI.32 Leptin may stimulate fibrogenesis by stimulating the Th1 inflammatory response.33 In the group of patients presented here, leptin levels were elevated compared with those of the controls. However, no relationship was found between the levels of leptin and the degree of fibrosis. The highest levels of leptin were seen in patients with normal BMIs and in obese patients. Leptin was shown to be a risk factor for NASH.
It has recently been demhonstrated that fibrosis is related to IR, age, and DM, rather than to the expression of leptin.29 Cross-sectional studies have unanimously identified age and IR as the strongest predictors of liver fibrosis in NASH. However, neither of these clearly has correlated with the progression of fibrosis in longitudinal studies; nor do dynamic changes in BMI correlate with changes in the fibrosis score.34 The progression of fibrosis occurs despite the normalization of aminotransferase levels.35 In this study, patients with advanced fibrosis exhibited the highest degree of necroinflammation on liver biopsies.
Adiponectin has been implicated as a biomarker of metabolic syndrome.36 The association between low adiponectin levels and obesity, IR, coronary artery disease, and dyslipidemia indicates that this novel protein may be an important new marker of metabolic syndrome.37 In humans, hypoadiponectinemia is inversely correlated with ALT, BMI, serum triglycerides, serum cholesterol, and IR.38 Although adiponectin levels have been reported to be inversely related to the degree of adiposity, we did not confirm this relationship, because we found no difference in adiponectin levels according to BMI.39
Patients with cirrhosis, independent of etiology, have elevated levels of insulin and IR. Adiponectin correlates positively with insulin in patients with liver cirrhosis.40 Levels of adiponectin also correlate with the severity of liver disease according to the Child-Pugh classification in patients with cirrhosis of various etiologies40-42 We did not confirm a relationship with adiponectin concentrations in different stages of the Child-Pugh classification, although patients with grade 4 fibrosis represented only a small group (n = 10). It remains to be determined whether adiponectin levels are related to hepatic fat content, IR, or the severity of liver disease in patients with NASH. Sohara40 showed that patients with cirrhosis did not differ in BMI from the controls, and considers that adiponectin is probably not metabolized adequately by the cirrhotic liver.40 In our study, only patients with NASH were included, and those with cirrhosis (F4) had an increased BMI (9/10 were obese and one was overweight). Adiponectin is secreted in the bile and patients with cholestasis may have increased levels of adiponectin.43 However, the patients reported here did not show cholestasis. Tietge reported that adiponectin correlated with albumin levels in a small group of patients.41 However, this has not been confirmed by others. It remains to be established whether cirrhotic patients with NASH metabolize adiponectin differently, and why some patients with grade 4 fibrosis exhibit very high levels of adiponectin.
Hypoadiponectinemia is evident across different ethnic groups, with marked differences in the propensity for associated obesity, DM2, and atherosclerosis.17 It remains to be established whether Mexican patients metabolize or eliminate adiponectin differently in the advanced stages of NASH.
Logistic regression analysis indicated that leptin and liver enzymes are risk factors for NASH. Only LD was associated with advanced fibrosis, and neither glucose, QUICKI-IR, leptin, nor adiponectin was associated with advanced fibrosis. Similar findings have been reported previously.44
In conclusion, leptin was not associated with either the degree of fibrosis or necroinflammation. However, adiponectin was associated with the degree of necroinflammatory activity. LD was associated with the degree of fibrosis. Thus, the risk factors for NASH were high levels of leptin and liver enzymes.


