


Hepatocellular carcinoma (HCC) is the most common liver cancer in adults, with an estimated annual incidence of more than 900,000 new cases worldwide [1,2]. It ranks seventh globally among all cancers and third in cancer-related deaths, often due to late detection and its connection to liver cirrhosis [3]. Patient survival is closely tied to the level of liver function. Early-stage treatments such as surgery, ablation, and liver transplantation offer favorable outcomes, although few patients qualify because of asymptomatic early stages and limited early diagnostic methods [4,5]. For unresectable, intermediate-stage HCC, trans-arterial chemoembolization (TACE) provides a modest chance of prolonging survival [6,7]. For advanced-stage HCC, treatment options are limited mainly to systemic therapies, predominantly involving immunomodulatory agents and tyrosine kinase inhibitors [6,8]. While recent therapies used in clinical practice are promising, they typically result in only modest improvements in patient outcomes [9,10].
The main challenge in treating HCC is its high resistance to anticancer drugs due to the multidrug resistance (MDR) phenotype [11,12]. This phenotype includes several mechanisms of chemoresistance shared across different cancers [13]. The resistome, a collection of chemoresistance-related genes expressed by the tumor, encodes proteins involved in complex processes also present in healthy cells. In tumor cells, these gene expressions are altered, especially during drug exposure. Our group and others have identified elements of the resistome in HCC [11,14–16], with significant variability in gene expression between patients linked to chemoresistance and malignancy [17].
The impact of treatment failure on patient outcomes is significant due to the loss of valuable time and an increased risk of tumor progression with enhanced cross-resistance, which can potentially undermine responses to second-line drugs [18]. Therefore, predicting how HCC will respond to treatment is essential for guiding clinical management and boosting survival rates in these patients [19]. While the Barcelona Clinic Liver Cancer (BCLC) system combines tumor features, liver function, and patient clinical status to offer broadly accepted prognostic information [20], the predictive accuracy of traditional models, including BCLC, remains limited because of the significant molecular diversity inherent in HCC [21,22]. The addition of new biomarkers is vital for creating more effective predictive tools [23].
Therefore, this study aimed to perform a retrospective analysis to characterize the genetic diversity related to chemoresistance and malignancy in patients with HCC, laying the foundation for creating a prognostic tool for those with this cancer.
2Materials and Methods2.1Data collection for in silico prognostic model developmentClinical and transcriptomic data from 371 tumors and 50 paired non-tumor tissue samples available in The Cancer Genome Atlas HCC cohort (TCGA-LIHC) were analyzed. Recurrent tumors were excluded. RNA sequencing (RNA-seq) data, generated on the HiSeq Illumina platform, were aligned to the GRCh38 human genome. Gene expression was measured using Fragments Per Kilobase of transcript per Million mapped reads Upper Quartile (FPKM-UQ) values. Data were retrieved from the NCI Genomic Data Commons (GDC) repository and analyzed using R version 4.2.3 and RStudio, with the "TCGAbiolinks" and "SummarizedExperiment" packages. Additional clinical data were sourced from the cBio Cancer Genomics Portal (http://cbioportal.org) [24].
2.2Clustering of HCC samplesExpression data for about 100 genes involved in chemoresistance and malignancy (Supplementary Table 1) were analyzed. MDR genes associated with resistance to chemotherapeutic drugs, tyrosine kinase inhibitors, and checkpoint inhibitors were selected based on recent literature reviews [11–13]. Genes with low expression (< 2.0 FPKM-UQ) in 95% of HCC and non-tumor samples were excluded. FPKM-UQ data were log2-transformed before analysis. Clustering of HCC samples, based on resistome-related gene expression profiles, was conducted using the NG-CHM Builder software (MD Anderson Cancer Center, University of Texas, US) (https://build.ngchm.net/NGCHM-web-builder/Select_Matrix.html?v=2.22.0). Unsupervised hierarchical clustering used Euclidean distance and Ward's minimum variance method.
2.3Survival analysesKaplan-Meier analysis for overall survival (OS) was performed using R with the "TCGAbiolinks" and "Survminer" packages. Survival times between groups were compared using the log-rank test, with risk tables showing patients at risk over time. The optimal gene expression cutoff was determined through the Kaplan-Meier Plotter resource (https://kmplot.com/analysis/)[25]. Cox proportional hazards regression assessed the relationship between OS and resistome or clinicopathological features. Univariate and multivariate Cox regression analyses identified significant variables (p-value < 0.05). Forest plots displaying hazard ratios were generated. From the genes identified in the multivariate Cox analysis, the Resistome Risk Score (RRS) model was developed. The performance of RRS in predicting OS, including sensitivity and specificity, was evaluated using binormal receiver operating characteristic (ROC) curves via online software (http://www.rad.jhmi.edu/jeng/javarad/roc/JROCFITi.html) from Johns Hopkins University School of Medicine, MD, US.
2.4Validation cohortsThe prognostic model developed from TCGA data was validated using additional cohorts. Data were obtained from the Integrative Molecular Database of HCC (HCCDB), which includes public microarray and RNA-seq datasets from GEO and ICGC repositories. This resource was compiled by Tsinghua University, the National Liver Cancer Center, and Shanghai East Hepatobiliary Surgery Hospital (China) [26] and is freely accessible at http://lifeome.net/database/hccdb.
A second validation cohort included 40 HCC samples from Tumor Biobanks at Salamanca University Hospital and Barcelona Clinic Hospital (Supplementary Table 2). The research protocols were approved by the Ethical Committee for Clinical Research at these institutions and conducted following the principles outlined in the Declaration of Helsinki. All patients provided written consent for the use of tissue samples in biomedical research.
These samples were collected and processed for RNA extraction and gene expression analysis as previously described [27]. Briefly, total RNA was isolated using RNA mini-spin columns treated with RNase-free DNase I, utilizing the Illustra RNAspin Mini Cytiva Kit (Thermo Fisher, Madrid). Subsequently, cDNA was synthesized by reverse transcription (RT) from total RNA using random primers and reverse transcriptase included in the SuperScript VILO cDNA Synthesis Kit (Invitrogen, Thermo Fisher). Quantitative PCR (qPCR) was conducted using AmpliTaq Gold DNA polymerase and Taqman Low-Density Arrays (TLDAs) on an ABI Prism 7900HT Sequence Detection System (Applied Biosystems, Thermo Fisher). The thermal cycling protocol included an initial cycle at 50°C for 2 min and at 95°C for 10 min, followed by 40 cycles at 95°C for 15 seconds and at 60°C for 60 s. Gene expression levels were normalized twice to GAPDH and ACTB, with 18S rRNA used as a quality control.
The RRS, calculated from the in silico study, was applied to samples from both validation cohorts. Patients were categorized into low- and high-risk groups using the risk score formula. To assess the predictive ability of the prognostic model, Kaplan-Meier survival and Cox regression analyses were performed as described above.
2.5Other statistical analysisData processing and statistical analyses were performed using Microsoft Office Excel (version 365) and GraphPad Prism 8. The statistical significance of differences between groups was determined using Pearson's χ2, Fisher's exact, or Mann-Whitney U tests, as appropriate.
2.6Ethical StatementsGiven the open nature of the data used for the in silico study, ethical approval was deemed unnecessary, and all analyses adhered to database access principles. In the case of experiments carried out to validate the model’s predictive power, the research protocols were reviewed and approved by the Salamanca Health Area Drug Research Ethics Committee (2019-02-195) and conducted in accordance with the principles outlined in the Declaration of Helsinki. All patients provided written consent for the utilization of tissue samples in biomedical research.
3Results3.1Clustering of HCCs according to the resistome profileFor the present analysis, we selected about one hundred genes based on their significance in the resistome across various cancer types, primarily gastrointestinal, based on data identified by others and our own research group over the past decade [11–13]. The expression of the selected chemoresistance-associated genes had already been validated by RT-QPCR using TaqMan Low-Density Arrays (TLDAs) in HCC samples and in cell lines derived from this cancer [17].
An in silico study was then conducted to identify HCC groups based on their expression profiles of these genes, utilizing transcriptomic data from 371 HCC patient tumor samples in the TCGA-LIHC cohort, obtained through RNA-seq. Seventeen genes were excluded due to their consistently low expression (< 2.0 FPKM-UQ) in 95% of both HCC and non-tumor samples. Hierarchical clustering divided the tumors into two main clusters, with significant differences in gene expression profiles: Cluster 1 (C1), comprising 110 patients (29.6%), and Cluster 2 (C2), comprising 261 patients (70.4%) (Figure 1). C2 was further divided into two subgroups, C2a and C2b, though the differences in gene expression between them were less noticeable, as shown by the height of the dendrogram (Figure 1), and had no significant impact on OS (Supplementary Figure 1).
 and two subgroups (C2a and C2b) based on the expression profiles of genes linked to the resistome. The heatmap shows unsupervised hierarchical clustering of 371 HCC samples and 81 genes using RNA-seq data (log2 FPKM-UQ). Clustering was carried out using Euclidean distance and Ward's minimum variance method. Columns represent tumor samples, and rows correspond to genes.")
Classification of the HCC patients from the TCGA-LIHC cohort into two main clusters (C1 and C2) and two subgroups (C2a and C2b) based on the expression profiles of genes linked to the resistome. The heatmap shows unsupervised hierarchical clustering of 371 HCC samples and 81 genes using RNA-seq data (log2 FPKM-UQ). Clustering was carried out using Euclidean distance and Ward's minimum variance method. Columns represent tumor samples, and rows correspond to genes.
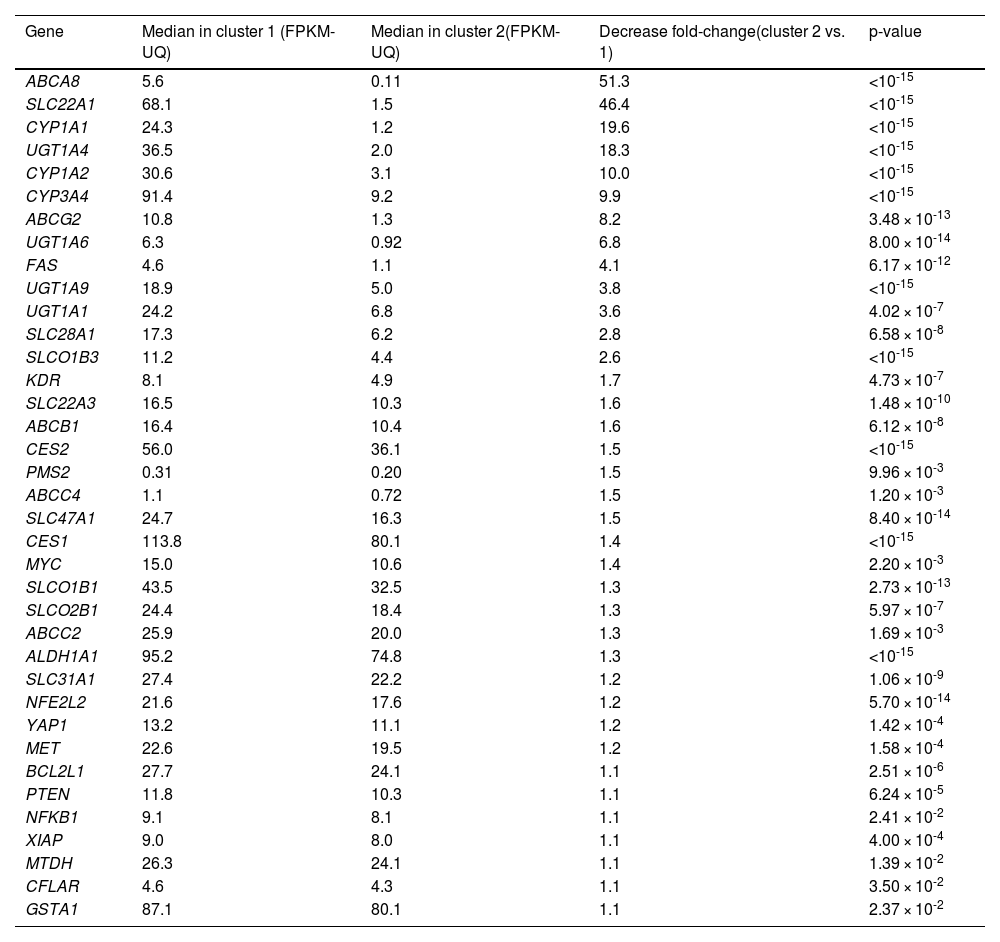
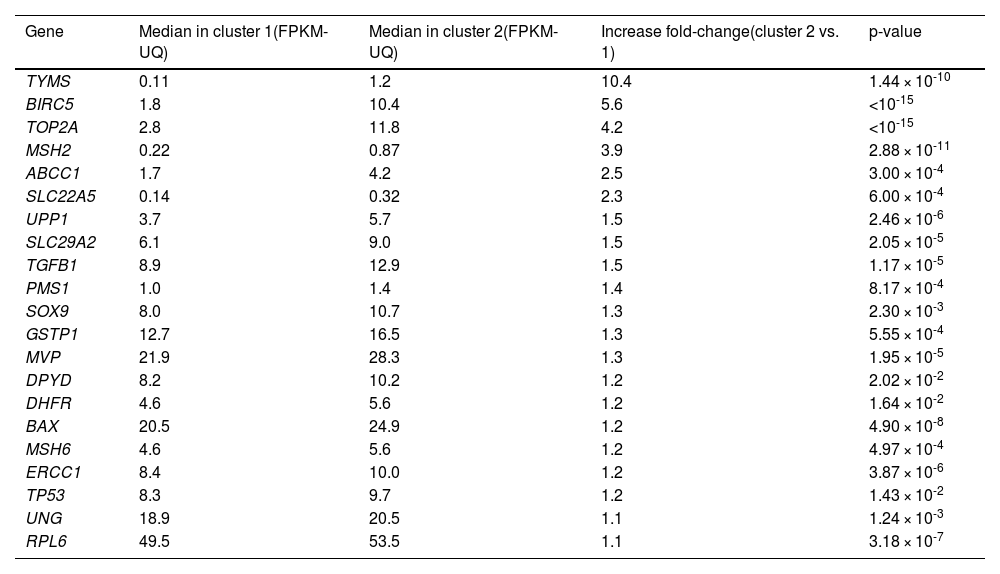
Fifty-eight out of the 81 genes studied showed statistically different median expressions between C1 and C2. Accordingly, they were identified as major contributors to classifying HCC samples into these clusters. Thirty-seven genes were downregulated in C2 compared to C1. ABCA8, SLC22A1, CYP1A1, CYP1A2, and UGT1A4 showed the most significant downregulation (Table 1). Conversely, 21 genes were upregulated in C2 relative to C1. TYMS, BIRC5, TOP2A, MSH2, and ABCC1 exhibited the most notable differences (Table 2). Hierarchical clustering of HCCs using only the 58 top-weighted genes confirmed the presence of two clusters, with 95% of samples remaining in the same cluster as previously described. This demonstrates the persistence of the top-weighted genes alongside the less influential ones (Supplementary Figure 2).
Comparison of the expression of genes involved in resistome between the two clusters of tumor samples from HCC patients identified in the TCGA-LIHC cohort.
The Mann-Whitney U test was used to compare gene expression between the two groups. Only the expression of genes for which statistically significant differences were found are shown. HCC, hepatocellular carcinoma. FPKM-UQ, fragments per kilobase of transcript per million mapped reads upper quartile.
Next, the relationship between the resistome signature and patient outcomes was examined. Using the Kaplan-Meier method, the OS of 370 patients in the previously defined groups was analyzed. At the time of the study, 130 patients (35.0%) had died. C2 showed a poorer prognosis, with a median survival of 45.7 months compared to 70.5 months for C1 (Figure 2A–B). Among patients classified within C1 and C2, only those treated with sorafenib alone or in combination with other drugs were further analyzed as groups C1sor and C2sor, respectively. Patients in the C1sor group demonstrated a better response to treatment, with a longer median survival (52.0 months) than those in C2sor, who had a shorter median survival (21.1 months) (Figure 2C–D).
 of HCC patients from the TCGA-LIHC cohort. Kaplan-Meier curves compare OS of 370 HCC patients classified into Cluster 1 or Cluster 2 based on the resistome (A). A similar analysis was conducted with only 33 members of both clusters treated with sorafenib (C1sor and C2sor, respectively) (C). The log-rank test was used to compare survival times between groups. (B, D) Risk tables show the number of patients at risk for each group at different time points. Impact of clinicopathological and molecular characteristics on the prognosis of HCC patients from the TCGA-LIHC cohort.")
Impact of the expression profile of resistome-associated genes on the overall survival (OS) of HCC patients from the TCGA-LIHC cohort. Kaplan-Meier curves compare OS of 370 HCC patients classified into Cluster 1 or Cluster 2 based on the resistome (A). A similar analysis was conducted with only 33 members of both clusters treated with sorafenib (C1sor and C2sor, respectively) (C). The log-rank test was used to compare survival times between groups. (B, D) Risk tables show the number of patients at risk for each group at different time points. Impact of clinicopathological and molecular characteristics on the prognosis of HCC patients from the TCGA-LIHC cohort.
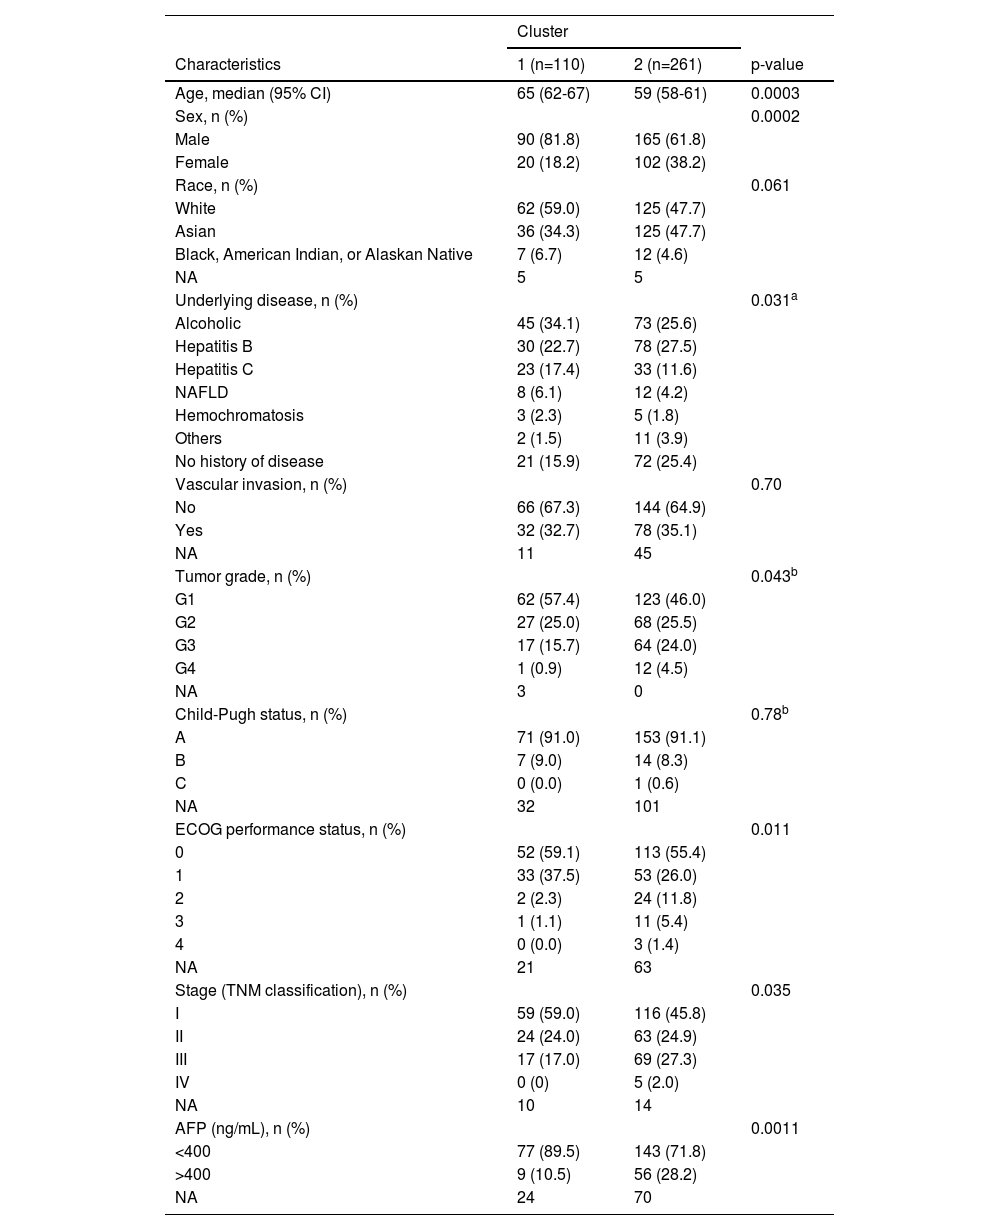
Beyond the survival analysis, additional clinicopathological parameters were compared between C1 and C2. Statistically significant differences were found in patient age, sex, tumor differentiation grade, performance status according to the Eastern Cooperative Oncology Group (ECOG) scale, tumor stage, and serum alpha-fetoprotein (AFP) levels at diagnosis (Table 3). Given the notable differences in most clinicopathological features between the two clusters, further analysis using Cox regression was conducted to assess their prognostic value for OS. Univariate analysis showed that female sex, advanced tumor stage (III or IV), and reduced patient functional status (ECOG ≥1) were associated with worse survival (Figure 3A). The evaluation of the prognostic ability of selected resistome genes confirmed that C2 was linked to poorer OS, consistent with the previous results obtained using the log-rank test. To determine whether this gene expression signature is an independent prognostic factor, a multivariate analysis was performed, including clinical and molecular variables significantly associated with OS in the univariate analysis. The results indicated that the resistome gene expression profile remained an independent prognostic factor, along with tumor stage and ECOG status (Figure 3B).
Comparison of clinical and pathologic characteristics between the two clusters of tumor samples from HCC patients identified in the TCGA-LIHC cohort.
AFP, alpha-fetoprotein; ECOG, Eastern Cooperative Oncology Group; NA, not available. To calculate the statistical significance of the differences between the groups Pearson's χ2, Fisher's exact, or Mann-Whitney U tests were used as appropriate. a Less frequent underlying diseases (hemochromatosis and NAFLD) were grouped in the "Others" category to apply Pearson's χ2 test. b Tumor grades G3 and G4, Child-Pugh B and C, ECOG 3 and 4 were grouped to apply the Pearson's χ2 test.
 and multivariate analysis (B) with variables found significantly different in the univariate analysis. The number of patients ranged from 246 to 370, depending on the variable. The forest plot displays hazard ratios for death (diamonds) and 95% confidence intervals (CI) (error bars). AFP, α-fetoprotein; ECOG, Eastern Cooperative Oncology Group.")
Impact of resistome-associated gene expression on the prognosis of HCC patients from the TCGA-LIHC cohort. Univariate analysis using the Cox regression model for overall survival (A) and multivariate analysis (B) with variables found significantly different in the univariate analysis. The number of patients ranged from 246 to 370, depending on the variable. The forest plot displays hazard ratios for death (diamonds) and 95% confidence intervals (CI) (error bars). AFP, α-fetoprotein; ECOG, Eastern Cooperative Oncology Group.
To further support the distinct genetic signatures between the two clusters, we evaluated the expression of the classical marker used for HCC monitoring alpha-fetoprotein (AFP). Moreover, we also evaluated the differential expression of the epithelial cell adhesion molecule (EpCAM) and cytokeratin 19 (CK19), two tumor stem cell markers associated with more aggressive behavior and poor prognosis in HCC patients following surgical and adjuvant therapies, which have been proposed as markers of a distinct HCC subtype [28,29]. Our results showed that patients in the C2 group had higher AFP, EpCAM, and CK19 expression levels than those in the C1 group (Figure 4).
, EpCAM (B), and CK19 (C) expression in patients with hepatocellular carcinoma (HCC) classified into Cluster 1 or Cluster 2 based on their resistome profile. The analysis includes mRNA expression levels measured by RNA sequencing (RNA-seq) in tumor samples (n = 370), obtained from The Cancer Genome Atlas (TCGA) database. Data are shown as the median with interquartile range (IQR) (lines) and individual data points (circles). The comparison between C1 and C2 was conducted using the Mann–Whitney U test for unpaired samples (p < 0.0001).")
In silico analysis of AFP (A), EpCAM (B), and CK19 (C) expression in patients with hepatocellular carcinoma (HCC) classified into Cluster 1 or Cluster 2 based on their resistome profile. The analysis includes mRNA expression levels measured by RNA sequencing (RNA-seq) in tumor samples (n = 370), obtained from The Cancer Genome Atlas (TCGA) database. Data are shown as the median with interquartile range (IQR) (lines) and individual data points (circles). The comparison between C1 and C2 was conducted using the Mann–Whitney U test for unpaired samples (p < 0.0001).
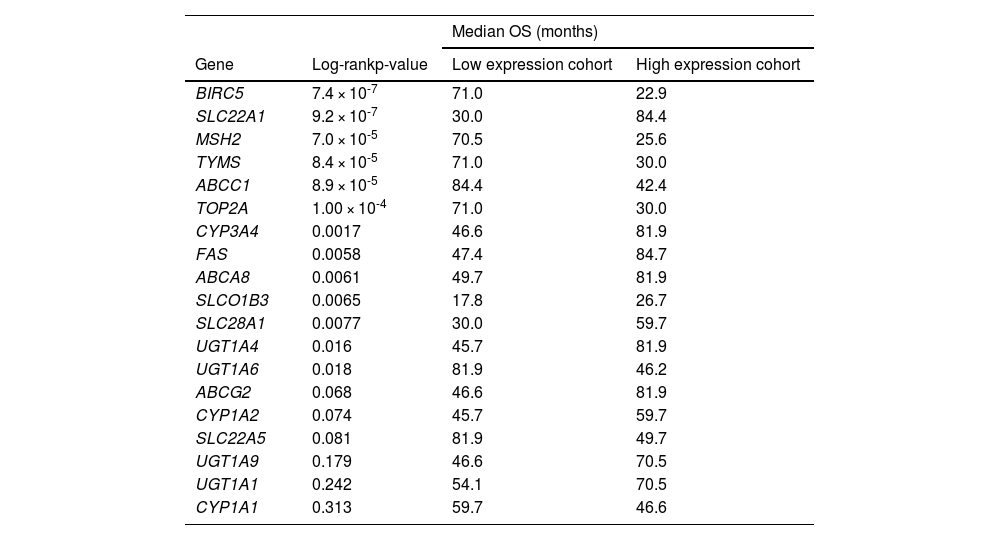
Among the 58 resistome genes that were differentially expressed in both clusters, we aimed to identify those whose expression levels were individually linked to patient outcomes. The selection was based on the magnitude of the difference in their expression between the two clusters. Values greater than 2-fold (C2 vs. C1) were considered as either downregulated (13 genes) or upregulated (6 genes). The log-rank test identified 13 genes with a significant association between their expression levels and patient survival (Table 4). A more stringent univariate Cox regression analysis narrowed the list to 6 genes with prognostic value for OS in HCC, specifically SLC22A1, BIRC5, CYP3A4, ABCA8, ABCC1, and CYP1A1 (Figure 5A). In multivariate analysis, three of these genes (SLC22A1, BIRC5, and ABCC1) emerged as independent prognostic factors (Figure 5B). Higher expression of BIRC5 and ABCC1 and lower expression of SLC22A1 were associated with worse outcomes. The estimated regression coefficients, which measure the impact of these three variables on survival and are multiplied by the expression level of each gene, were used to build the “resistome risk-score” (RRS) model (Figure 5C). ROC curve analysis indicated that our prognostic model performed well in predicting OS of HCC patients, with an AUC of 0.787, showing high sensitivity (88.6%) and acceptable specificity (70.4%) (Figure 5D).
Analysis of the association between the expression of genes involved in resistome and survival of HCC patients from the TCGA-LIHC cohort (n=371).
Based on the expression of each gene, expressed as FPKM-UQ (Fragments Per Kilobase of transcript per Million mapped reads Upper Quartile), patients were classified into two groups and the association between survival and gene expression was determined. The Log-rank test was used to compare the survival time between the two groups. The best expression cutoff that produced the maximum difference in survival between the two groups with the lowest Log-rank p-value was used. OS, overall survival.
 and multivariate analysis (B) with variables found significantly different in the univariate analysis. The forest plot displays hazard ratios for death (diamonds) and 95% confidence intervals (CI) (error bars). (C) The formula for calculating the resistome risk score (RRS) is derived from the coefficients obtained by the multivariate Cox regression model, which measure the impact of covariates and are multiplied by the expression level of each gene. (D) Maximum likelihood estimation of binormal receiver operating characteristic (ROC) curve to validate the risk score's performance in predicting OS. Displayed in gray are the lower and upper limits of the asymmetric 95% CI for the fraction of true positives across a range of false-positive fractions on the estimated ROC curve. AUC, area under the ROC curve.")
Impact of resistome-associated gene expression on the prognosis of HCC patients from the TCGA-LIHC cohort. Univariate analysis using the Cox regression model for overall survival (A) and multivariate analysis (B) with variables found significantly different in the univariate analysis. The forest plot displays hazard ratios for death (diamonds) and 95% confidence intervals (CI) (error bars). (C) The formula for calculating the resistome risk score (RRS) is derived from the coefficients obtained by the multivariate Cox regression model, which measure the impact of covariates and are multiplied by the expression level of each gene. (D) Maximum likelihood estimation of binormal receiver operating characteristic (ROC) curve to validate the risk score's performance in predicting OS. Displayed in gray are the lower and upper limits of the asymmetric 95% CI for the fraction of true positives across a range of false-positive fractions on the estimated ROC curve. AUC, area under the ROC curve.
The prognostic effectiveness of the RRS model was validated in silico across various patient cohorts, considering differences in sample sizes, sample sources, and gene expression measurement techniques (Figure 6A). In all datasets, it was consistently observed that HCC patients with higher RRS values had worse outcomes, confirmed using both the log-rank test (Figure 6A–E) and the Cox regression method (Figure 6F).
 Analysis of the relationship between the resistome risk score (RRS) and survival of HCC patients across different public databases. The log-rank test was used to compare survival times between two patient groups classified according to the RRS. The optimal cutoff point for gene expression, which yielded the maximum survival difference between the groups with the lowest log-rank p-value, was used. OS stands for overall survival. (B-E) Kaplan-Meier curves showing OS of HCC patients from different datasets, divided into low or high RRS groups. (F) Univariate analysis with the Cox regression model to evaluate the effect of RRS on OS in HCC patients. The forest plot displays hazard ratios for death (diamonds) and 95% confidence intervals (CI) (error bars).")
In silico validation of the HCC prognostic model using various publicly available databases. (A) Analysis of the relationship between the resistome risk score (RRS) and survival of HCC patients across different public databases. The log-rank test was used to compare survival times between two patient groups classified according to the RRS. The optimal cutoff point for gene expression, which yielded the maximum survival difference between the groups with the lowest log-rank p-value, was used. OS stands for overall survival. (B-E) Kaplan-Meier curves showing OS of HCC patients from different datasets, divided into low or high RRS groups. (F) Univariate analysis with the Cox regression model to evaluate the effect of RRS on OS in HCC patients. The forest plot displays hazard ratios for death (diamonds) and 95% confidence intervals (CI) (error bars).
Additionally, a validation approach was undertaken using a cohort of 40 patients in which the expression levels of SLC22A1, ABCC1, and BIRC5 were experimentally quantified by qPCR. The resistome risk score (RRS) was calculated for each patient and represented as a violin plot (Figure 7A). An optimal cutoff value of –10, determined by minimizing the log-rank p-value, was used to stratify patients into low-risk (n = 13) and high-risk (n = 27) groups. HCC patients with the highest RRS showed lower SLC22A1 expression and higher ABCC1 expression compared with those with the lowest RRS (Figure 7B). The high-RRS group also exhibited a trend toward higher BIRC5 expression relative to the low-RRS group. Kaplan-Meier log-rank test results highlighted that patients in the high-risk group had significantly shorter OS compared to those in the low-risk group (Figure 7C–D). Cox regression analysis further confirmed the model's reliability in predicting HCC survival, showing that patients with higher RRS values had a worse prognosis (Figure 7E).
 Violin plot of resistome risk scores (RRS) for each sample from the validation cohort. The best expression cutoff point that resulted in the maximum survival difference between the two groups with the lowest log-rank p-value was used. (B) Expression of SLC22A1, ABCC1, and BIRC5 genes in HCC patients from the validation cohort (n = 40) classified into low or high RRS groups. mRNA levels were determined by RT-qPCR using TLDAs and normalized based on GAPDH and ACTB expression levels. Individual data, median, and interquartile range (IQR) are represented. (C) Kaplan-Meier curves comparing overall survival (OS) of 40 HCC patients from the validation cohort classified into low or high RRS groups. Log-rank test was used to compare survival time between two groups of patients. (D) Risk tables showing the number of patients at risk for each group at different times. (E) Univariate analysis using the Cox regression model to evaluate the impact of the RRS on the OS of HCC patients. The forest plot includes hazard ratios for death (diamond) and the 95 % confidence interval (CI) (error bars).")
(A) Violin plot of resistome risk scores (RRS) for each sample from the validation cohort. The best expression cutoff point that resulted in the maximum survival difference between the two groups with the lowest log-rank p-value was used. (B) Expression of SLC22A1, ABCC1, and BIRC5 genes in HCC patients from the validation cohort (n = 40) classified into low or high RRS groups. mRNA levels were determined by RT-qPCR using TLDAs and normalized based on GAPDH and ACTB expression levels. Individual data, median, and interquartile range (IQR) are represented. (C) Kaplan-Meier curves comparing overall survival (OS) of 40 HCC patients from the validation cohort classified into low or high RRS groups. Log-rank test was used to compare survival time between two groups of patients. (D) Risk tables showing the number of patients at risk for each group at different times. (E) Univariate analysis using the Cox regression model to evaluate the impact of the RRS on the OS of HCC patients. The forest plot includes hazard ratios for death (diamond) and the 95 % confidence interval (CI) (error bars).
HCC is a neoplasm with considerable variability between individuals, making prognostic predictions difficult. Patients with similar clinical features and tumor stages may have extremely diverse OS outcomes [30]. This heterogeneity also limits the effectiveness of current drug treatments for advanced liver cancer [31]. In a previous study, our group analyzed a small cohort of HCC patients, revealing significant variability in the expression of resistome genes [17]. In the present study, we further explored this question by investigating a potential link between the resistome profile and patient prognosis. The TCGA-LIHC cohort used for the in silico study included patients with tumors at various stages and receiving different treatments. Most patients underwent surgical resection without adjuvant pharmacological therapy, while some received ablative treatment or embolization. In the initial analysis, patient prognosis was assessed independently of the treatment each patient received. Median survival times of 45 to 70 months are notably higher than those for patients with intermediate- or advanced-stage HCC. This is because many patients with early-stage disease, for whom surgical specimens were available, are included in this analysis. Although the analysis confirmed significant heterogeneity among patients, it revealed a clear division into two groups based on expression profiles and OS. Patients in the TCGA-LIHC cohort received different antitumor drug therapies, with sorafenib-based treatments being the most common, although some received standard cytotoxic therapies. Among patients receiving sorafenib-based treatment, those in cluster 2 experienced worse outcomes. Notably, most of these patients had adjuvant drug therapy, suggesting that the tumor's response to the drug might be relatively influenced by other factors, such as tumor malignancy features and the extent of tumor removal.
The comparison of clinicopathological characteristics between the two clusters identified here revealed significant differences in most parameters. One of the most notable differences was related to gender, which may be due to gender-specific risk factors such as alcohol consumption and obesity, impacting hepatocarcinogenesis differently in men and women. Additionally, molecular mechanisms such as the differential expression of androgen and estrogen receptors, which mediate signaling pathways involved in cell proliferation, apoptosis, and DNA repair, may be involved. The serum level of AFP at diagnosis was not predictive of patient prognosis in the overall cohort. However, when examining the identified patient clusters, AFP levels were significantly higher in Cluster 2 compared to Cluster 1. This result is consistent with the widely reported association between AFP levels at diagnosis and outcomes [32,33].
It is important to note that not all genes showing significant differences between the identified clusters were expected to influence patient prognosis equally. To test this idea, we conducted a study analyzing how each gene affects HCC patient outcomes, which resulted in the creation of a gene signature based on the expression of SLC22A1, BIRC5, and ABCC1, demonstrating independent prognostic ability.
The SLC22A1 gene encodes organic cation transporter 1 (OCT1), which is highly expressed in hepatocytes and plays a crucial role in transporting various cationic compounds, including both endogenous and xenobiotic compounds, such as the drug sorafenib [34,35]. Therefore, OCT1 may play a crucial role in the effectiveness of sorafenib because this drug's mechanism of action relies on its ability to inhibit the intracellular domains of tyrosine kinases. Reduced expression of OCT1 has been suggested as a common feature of the multidrug resistance phenotype found in major liver cancer types, such as HCC, cholangiocarcinoma, and hepatoblastoma [17,35].
The BIRC5 gene encodes the anti-apoptotic protein survivin, which is overexpressed in many tumors, including liver cancers [17,36]. Survivin overexpression has been linked to chemoresistance, inhibition of apoptosis, and the development of metastasis, making it a marker of malignant traits in cancer cells [37]. Multidrug resistance-associated protein 1, encoded by the ABCC1 gene, is expressed by healthy hepatocytes in the basolateral membrane at very low levels under normal conditions. In contrast, significant upregulation of MRP1 has been observed in several liver diseases, including HCC [38,39]. MRP1 functions as an export pump, mediating the efflux of many drugs, such as several antitumor agents [40], and may be involved in the poor response of HCC cells to sorafenib [41].
The most commonly used models for providing prognostic information, such as the conventional Tumor-Nodule-Metastasis (TNM) staging method [42] and the HCC-specific Barcelona Clinic Liver Cancer staging algorithm [20], incorporate tumor characteristics, liver function, and clinical status but have limited predictive accuracy [22]. Despite advancements in high-throughput genomic techniques, no accurate biomarkers are currently used in routine clinical practice. However, there has been significant effort in searching for novel biomarkers that could enhance the prognostic capacity provided by clinicopathological variables in the future [43]. Several prognostic molecular signatures have been proposed for HCC patients based on genes related to the immune microenvironment [44], hypoxia and methylation [45], or even bile acid metabolism [46,47], among others. Although multigene signature panels offering a nomogram based on expression profiles using RT-qPCR have been commercialized as prognostic tools for other tumors, such as breast cancer [48], none are currently available for HCC.
Although several studies have proposed gene signatures as prognostic models in cancer, they have had limited impact on routine clinical practice. To date, only a few tests have received approval for clinical use, such as Oncotype DX, MammaPrint, Prolaris, and Decipher. Among these, the Oncotype DX [49] and MammaPrint [50] tests feature multigene expression signatures that include dozens of genes, primarily used in breast cancer to determine the need for adjuvant chemotherapy. Similarly, the Prolaris and Decipher tests [51] are used in prostate cancer to assess the risk of tumor progression and recurrence. Although these tests are approved and utilized in clinical practice, their application remains limited to specific clinical scenarios. HCC is among the malignancies with the most proposed genetic signatures in the literature; however, their actual clinical use is very low. A significant limitation is the lack of validation in large, diverse patient groups, as most studies rely on small datasets with only tens or a few hundred cases. Additionally, many of these signatures do not significantly improve prognostic accuracy over traditional clinical variables, making their additional cost or technical complexity unjustifiable. Furthermore, transcriptomic assays have not been clinically validated for most tumor types by agencies like the FDA or EMA. Nonetheless, the proven clinical usefulness of existing tests like Oncotype DX and MammaPrint suggests that implementing genetic signatures for prognostic prediction in HCC is feasible.
5ConclusionsThe HCC genetic signature proposed in this study was derived from the resistome, as a crucial trait of malignancy. It was developed with the aim of being used as a complementary tool in clinical settings to categorize patients. This can help identify those with poorer prognoses and those who might benefit from more aggressive treatments. The resistome-based risk score developed here could also be a useful tool for guiding therapy decisions and customizing treatment plans based on each patient's molecular profile, potentially reducing unnecessary interventions and avoiding chemotherapy in low-risk cases. Supporting this, our analysis showed that patients in group C2 of the TCGA-LIHC cohort who received adjuvant sorafenib therapy had worse outcomes compared to those in group C1. Additionally, the resistome genetic signature might be combined with established clinical biomarkers and patient data to improve prognostic accuracy. In our study, tumor stage and ECOG performance status were identified as independent factors affecting prognosis. In summary, we have created and validated a genetic signature based on three resistome-related genes that accurately predicts the prognosis of patients with HCC. This could serve as a valuable tool in clinical practice for tailoring the most appropriate treatment options for each patient.
FundingThis study received funding from various sources, including the CIBERehd (CB06/04/0023) and Fondo de Investigaciones Sanitarias, Instituto de Salud Carlos III, Spain, co-funded by the European Regional Development Fund/European Social Fund, “Investing in your future” (PI22/00526, and PI23/00681); “Junta de Castilla y Leon” (SA113P23, and GRS 2322/A/21), Spain; and AECC Scientific Foundation (2023/2027), Spain. A.S.-M. received support through predoctoral scholarships (FPU) funded by the Ministry of Science, Innovation and Universities, Spain.
Author ContributionsConceptualization: A.S.-M., J.J.G.M., O.B.; Funding acquisition: J.J.G.M., O.B.; Investigation: A.S.-M., R.I.R.M., L.M.-B., L.M.G., A.F., M.R., O.B., Writing the original draft: A.S.-M., J.J.G.M., O.B.; Review & editing: A.S.-M., R.I.R.M., L.M.-B., L.M.G., A.F., M.R., J.J.G.M., O.B.
Data Availability Statement
Publicly available datasets were used in this study. These can be found in The Cancer Genome Atlas (TCGA) at https://portal.gdc.cancer.gov/, the cBio Cancer Genomics Portal at http://cbioportal.org, and the Integrative Molecular Database of HCC (HCCDB) at http://lifeome.net/database/hccdb. All data generated or analyzed during this study are included in this article and its supplementary material files. Further enquiries can be directed to the corresponding author.
None.


