


In hepatocellular carcinoma (HCC), the prognosis of patients with microvascular invasion (MVI) is poor. Therefore, in this study, we established and evaluated the performance of a novel nomogram to predict MVI in patients with HCC.
Materials and MethodsWe retrospectively obtained clinical data of 497 patients with HCC who underwent hepatectomy at Liaoning Cancer Hospital from November 1, 2018, to November 4, 2021. The patients (n = 497) were randomized in a 7:3 ratio into the training cohort (TC, n = 349) and the validation cohort (VC, n = 148). We performed Least Absolute Shrinkage and Selection Operator (LASSO) and univariate as well as multivariate logistic regression analyses (ULRA, MRLA) on patients in the TC to identify factors independently predicting MVI.
ResultsPreoperative FIB-4, AFU, AFP levels, liver cirrhosis, and non-smooth tumor margin were independent risk factors for preoperative MVI prediction. The C-index of the TC, VC, and the entire cohort was 0.846, 0.786, and 0.829, respectively. The calibration curves demonstrated the outstanding agreement between predicted MVI incidences by our model and the actual MVI risk. Decision curve analysis (DCA) confirmed the significance of our predictive model in clinical settings. The Kaplan−Meier (KM) survival curve showed that the recurrence-free survival (RFS) and overall survival (OS) of patients in the high-MVI risk group were poor compared to those in the low-MVI risk group.
ConclusionsWe constructed and evaluated the performance of the novel nomogram for predicting MVI risk. Our predictive model could adequately predict MVI risk and aid clinicians in selecting appropriate therapeutic strategies for patients.
Recent studies have shown that liver cancer is the sixth most prevalent type of malignancy and the third leading cause of mortality due to cancer globally. The most common type of primary liver cancer (PLC) is hepatocellular carcinoma (HCC) [1]. Liver transplantation and hepatectomy are excellent therapeutic approaches for treating patients with HCC. However, the risk of cancer recurrence after surgery is still high [2].
Microvascular invasion (MVI) indicates aggressive tumor behavior and is a marker for postoperative metastasis in patients with PLC [3]. The prognosis of patients with HCC suffering from MVI differs based on different surgical methods used to treat patients. Compared to non-anatomic hepatectomy, anatomic hepatectomy reduces postoperative cancer recurrence and mortality in patients with MVI-positive HCC [4]. Additionally, the presence of MVI poses a severe threat to the prognosis of people undergoing liver transplantation and the rate of cancer recurrence among patients with MVI-positive HCC undergoing liver transplantation [5]. Therefore, it is important to exercise caution while selecting a surgical approach for patients with a high risk of preoperative MVI. Currently, postoperative histopathology serves as the gold standard for the diagnosis of MVI [6]. Unfortunately, this method provides limited benefits in making decisions prior to the surgery. Thus, accurately predicting MVI risk before surgery could aid doctors in selecting an appropriate surgical approach to improve the patient's prognosis.
Recent studies have used preoperative clinical data to predict the risk of MVI in patients [7,8]. In addition, several hematological data and imaging tumor features have been identified as MVI predictors [9,10]. However, these studies have identified only a few clinical indicators, and their predictive abilities are yet to be determined.
Therefore, in this study, we retrospectively analyzed preoperative imaging and hematological data of patients to determine if they could independently predict MVI among patients with HCC. Additionally, we constructed a novel nomogram for estimating MVI risk and explored the potential role of MVI risk in stratifying patients based on their outcomes.
2Materials and Methods2.1PatientsPreoperative clinical data were obtained from patients with HCC who underwent hepatectomy at Liaoning Cancer Hospital from November 1, 2018, to November 4, 2021. The inclusion criteria were as follows: (1) patients who underwent a standard-compliant R0 radical resection; (2) patients aged 18 or above, (3) HCC diagnosis confirmed using histology; (4) Child-Pugh A or B liver function; and (5) Magnetic resonance imaging (MRI)-enhanced liver scan performed two weeks prior to hepatectomy. The patient exclusion criteria were as follows: (1) patients who underwent anticancer treatment prior to surgery; (2) history of prior malignancies; (3) missing clinical information; (4) extrahepatic metastasis; (5) ambiguous diagnosis of MVI; and (6) MVI. Finally, we included 497 patients with HCC (Fig. 1). The patients were randomized in the 7:3 ratio in the training cohort (TC, n = 349) and the validation cohort (VC, n = 148). All patients were regularly followed up after discharge from the hospital. Cancer recurrence in patients was diagnosed by the presence of a new local or distant metastatic lesion detected via imaging. The primary endpoints of the study were overall survival (OS) and recurrence-free survival (RFS). We calculated the patient's OS as follows: the date of surgery to either the date of death due to any reason or the last follow-up. RFS was calculated from the date of surgery to the date of initial recurrence diagnosis or the date of death caused by any reason or the last follow-up.

Flowchart of the study population and processing.
DCA, decision curve analysis; HCC, hepatocellular carcinoma; KM, Kaplan-Meier; LASSO, absolute shrinkage and selection operator; MLRA, multivariate logistic regression analysis; MVI, microvascular invasion; ROC, receiver operating characteristic; TC, training cohort; ULRA, univariate logistic regression analysis; VC, validation cohort.
All patients underwent a radical hepatectomy. The MVI grade was determined by the histopathological examination of postoperative tissue samples performed independently by two excellent pathologists.
2.3Preoperative clinicopathological indicatorsWe evaluated the following laboratory indicators: Total bilirubin (TB), aspartate aminotransferase (AST), albumin, alanine aminotransferase (ALT), prothrombin time (PT), alkaline phosphatase (ALP), platelets, white blood cells (WBCs), γ-glutamyl transferase (GGT), monocytes, lymphocytes, platelet-to-lymphocyte ratio (PLR), neutrophils, aspartate transaminase-to-platelet ratio index (APRI), platelet-to-monocyte ratio (PMR), AST-to- albumin ratio (AAR), albumin-to- GGT ratio (AGR), systemic inflammation response index (SIRI), fibrosis-4 index (FIB-4 index), prognostic nutritional index (PNI), alpha-fetoprotein (AFP), carcinoembryonic antigen, alpha-L-fucosidase (AFU), systemic immune inflammation (SII), carbohydrate antigen199, and hepatitis B surface antigen (HBsAg). We calculated APRI, FIB-4, AAR, AGR, PMR, PLR, SIRI, PNI, and SII based on the formulas mentioned in the table of references (Table S1). Furthermore, preoperative enhanced MRI data, including tumor size, tumor margin, liver cirrhosis, tumor number, and clinical TNM stage, were evaluated. These routine tests were performed two weeks prior to the surgery. These potential MVI risk indicators were screened based on published papers, pathophysiological inferences, clinical knowledge, and practical considerations for clinical implementation.
2.4Calculation of cut-off values for the factorsWe determined the optimal cut-off values of AFP, AFU, FIB-4, AAR, AGR, PLR, PMR, APRI, SII, SIRI, and PNI using receiver operating characteristics (ROC) curves and the maximum Youden index. P < 0.05 indicated a significant difference. In addition, we calculated the cutoff values of other continuous variables based on their respective medical reference ranges.
2.5Statistical analysisWe measured differences using chi-squared or Fisher's exact test and presented categorical variables as numbers and percentages. Next, we presented continuous variables as median and interquartile range, or mean ± standard deviation, and performed the t-test or Kruskal–Wallis test to calculate differences. We compared and estimated survival probabilities using the log-rank test and the Kaplan–Meier (KM) survival analysis. Next, we performed univariate logistic regression analysis (ULRA) to determine the variables predicting MVI risk with P < 0.05. Next, we performed the Least Absolute Shrinkage and Selection Operator (LASSO) regression analysis on these variables for screening variables and dimensionality reduction. The most significant factors with non-zero coefficients were selected and incorporated into the multivariate logistic regression analysis (MLRA). Next, variables with P < 0.05 were selected as factors independently predicting MVI risk. We constructed the predictive model based on these factors and visualized it using a nomogram. The weighted MVI risk score was calculated based on the β-coefficients of the selected significant values obtained during the last step of the MLRA. We calculated the cut-off values for estimating the low and high-MVI risk using the median value of the MVI risk score. We evaluated the reliability of the nomogram by constructing the ROC curves and calculating the area under the ROC curve (AUC) values. Next, we constructed calibration curves to assess the accuracy of our model and decision curve analysis (DCA) to evaluate the significance of the model in clinical settings. Finally, we determined the utility of the model for hepatitis B virus (HBV)-negative and HBV-positive patients. P < 0.05 indicated a significant difference. We statistically analyzed the data using R version 4.0.3 and SPSS version 25.0 (IBM Corp., NY, USA).
2.6Ethical statementWritten informed consent was obtained from each patient included in the study and the study protocol conforms to the ethical guidelines of the 1975 Declaration of Helsinki as reflected in a priori approval by the Medical Ethics Committee of Liaoning Provincial Cancer Hospital (20200802yg).
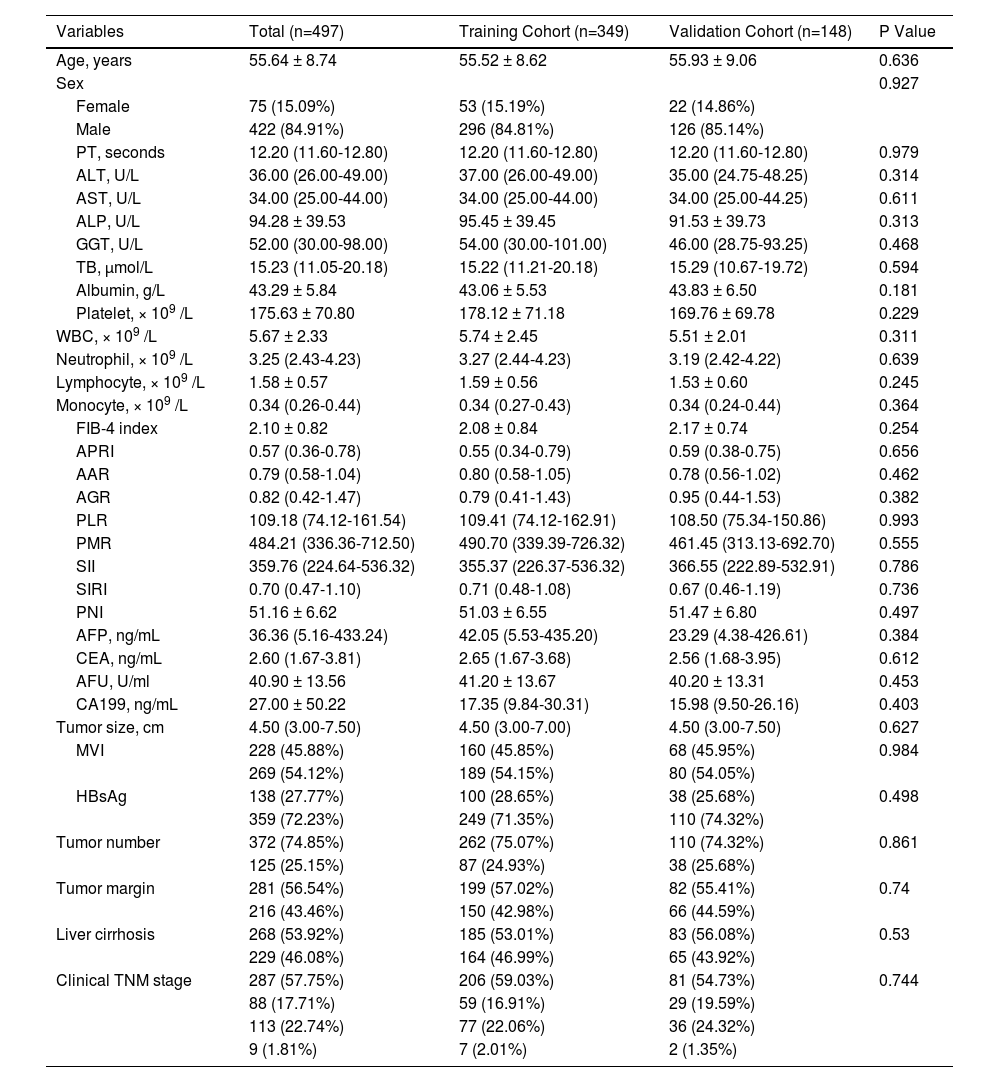
3Results3.1Comparing clinicopathological characteristics of patientsWe included 497 patients in the study, of which 349 patients were in the TC, and 148 in the VC underwent hepatectomy. Table 1 presents the clinicopathological characteristics of the patients at baseline. No significant difference in the baseline clinicopathological characteristics between both cohorts was observed.
Clinical characteristics of HCC patients.
PT, prothrombin time; ALT, alanine aminotransferase; AST, aspartate aminotransferase; ALP, alkaline phosphatase; GGT, γ-glutamyltransferase; TB, total bilirubin; WBC, white blood cell; FIB-4 index, fibrosis-4 index; APRI, aspartate transaminase-to-platelet ratio index; AAR, AST-to- albumin ratio; AGR, albumin-to- GGT ratio; PLR, platelet-to-lymphocyte ratio; PMR, platelet-to-monocyte ratio; SII, systemic immune inflammation; SIRI, systemic inflammation response index; PNI, prognostic nutritional index; AFP, alpha-fetoprotein; CEA, carcinoembryonic antigen; AFU, alpha-L-fucosidase; CA199, Carbohydrate antigen 199; MVI, microvascular invasion; HBsAg, hepatitis B surface antigen; TNM, tumor-node-metastasis, according to the eighth edition of the AJCC (American Joint Committee on Cancer) cancer staging manual.
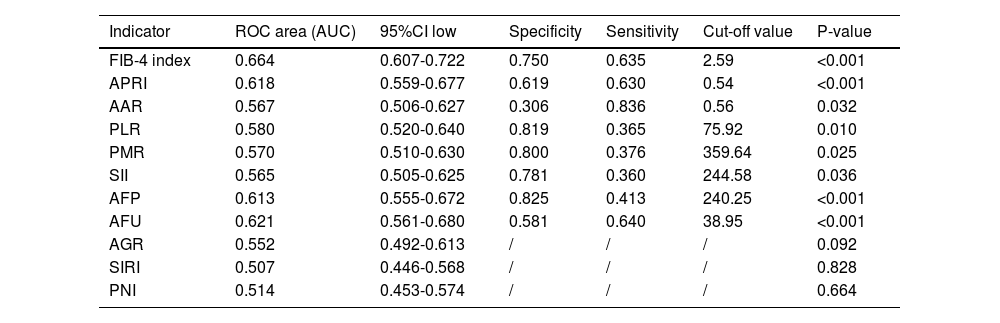
We used the ROC curve to determine the cut-off values of indicators, including AFP, AFU, FIB-4, APRI, AAR, PLR, PMR, SII, AGR, SIRI, and PNI for predicting MVI (Fig. 2). The optimal cut-off values of AFP, AFU, FIB-4, APRI, AAR, PLR, PMR, and SII predicting MVI were 240.25, 38.95, 2.59, 0.54, 0.56, 75.92, 359.64, and 244.58 (Table 2). These indicators could significantly predict MVI risk (P < 0.05).
 curve for preoperative FIB-4 index, APRI, AAR, PLR, PMR, SII, AFP, AFU, AGR, SIRI, and PNI for predicting MVI. Abbreviations: FIB-4 index, fibrosis-4 index; APRI, aspartate transaminase-to-platelet ratio index; AAR, AST-to- albumin ratio; PLR, platelet-to-lymphocyte ratio; PMR, platelet-to-monocyte ratio; SII, systemic immune inflammation; AFP, alpha-fetoprotein; AFU, alpha-L-fucosidase; AGR, albumin-to- GGT ratio; SIRI, systemic inflammation response index; PNI, prognostic nutritional index.")
The receiver operating characteristic (ROC) curve for preoperative FIB-4 index, APRI, AAR, PLR, PMR, SII, AFP, AFU, AGR, SIRI, and PNI for predicting MVI.
Abbreviations: FIB-4 index, fibrosis-4 index; APRI, aspartate transaminase-to-platelet ratio index; AAR, AST-to- albumin ratio; PLR, platelet-to-lymphocyte ratio; PMR, platelet-to-monocyte ratio; SII, systemic immune inflammation; AFP, alpha-fetoprotein; AFU, alpha-L-fucosidase; AGR, albumin-to- GGT ratio; SIRI, systemic inflammation response index; PNI, prognostic nutritional index.
Value of preoperative FIB-4 index, APRI, AAR, PLR, PMR, SII, AFP, AFU, AGR, SIRI and PNI in the diagnosis of MVI
FIB-4 index, fibrosis-4 index; APRI, aspartate transaminase-to-platelet ratio index; AAR, AST-to- albumin ratio; PLR, platelet-to-lymphocyte ratio; PMR, platelet-to-monocyte ratio; SII, systemic immune inflammation; AFP, alpha-fetoprotein; AFU, alpha-L-fucosidase; AGR, albumin-to- GGT ratio; SIRI, systemic inflammation response index; PNI, prognostic nutritional index;
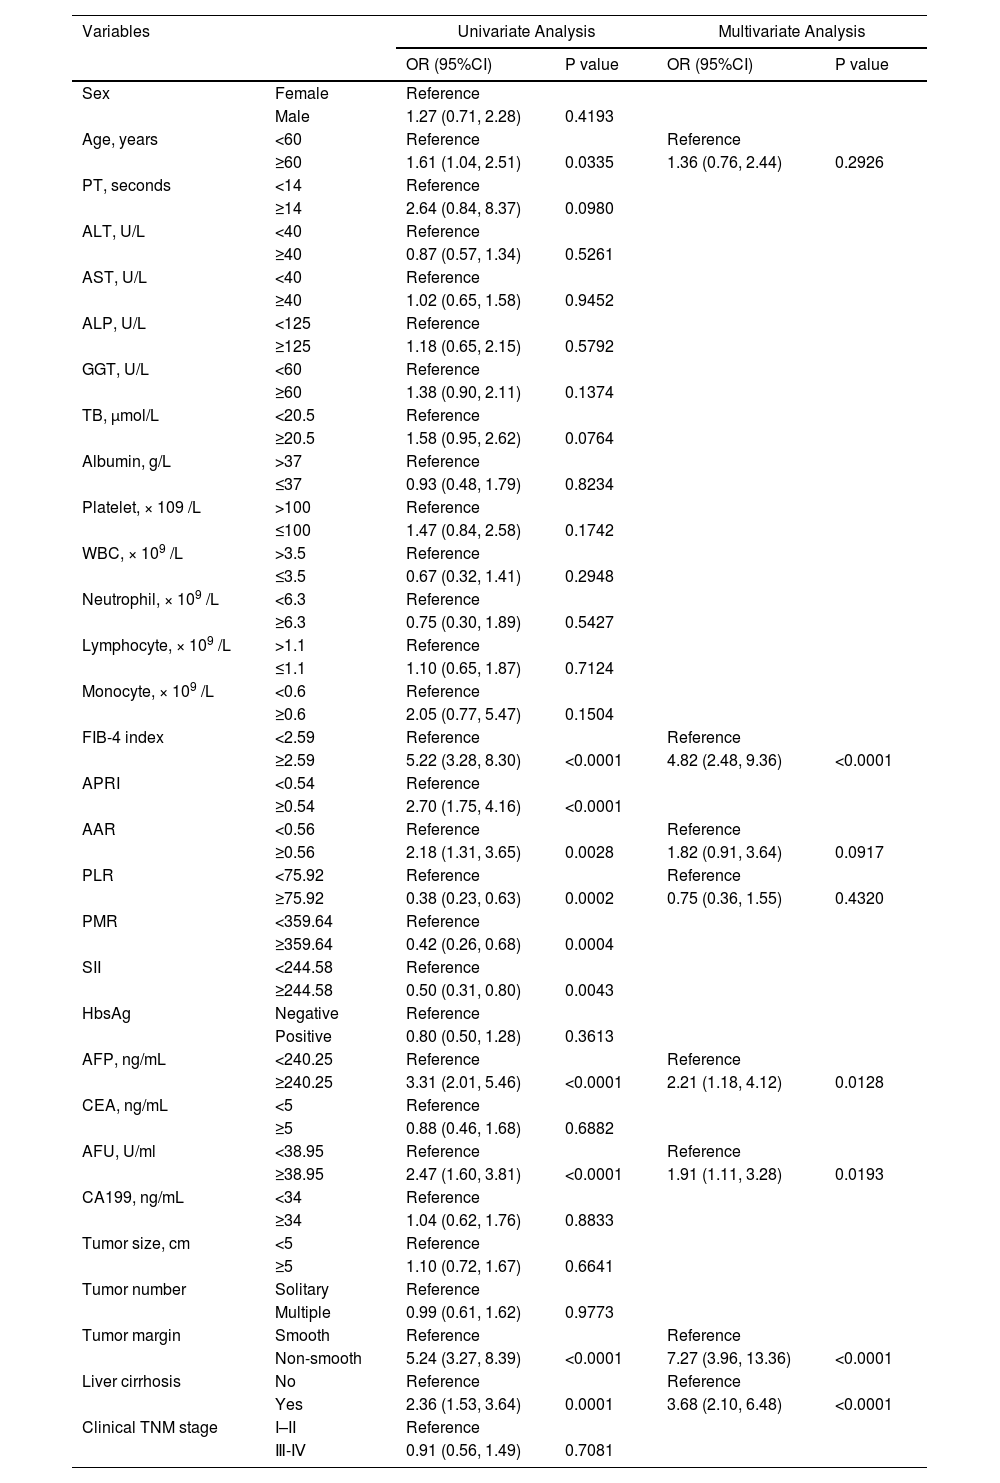
Table 3 presents the results of the ULRA performed on the TC. The results showed that age, FIB-4, APRI, AAR, PLR, PMR, SII, AFP, AFU, tumor margin, and liver cirrhosis (P < 0.05) were MVI risk factors.
Univariate and multivariate logistic regression analysis of MVI presence based on preoperative data in the training cohort.
PT, prothrombin time; ALT, alanine aminotransferase; AST, aspartate aminotransferase; ALP, alkaline phosphatase; GGT, γ-glutamyltransferase; TB, total bilirubin; WBC, white blood cell; FIB-4 index, fibrosis-4 index; APRI, aspartate transaminase-to-platelet ratio index; AAR, AST-to- albumin ratio; PLR, platelet-to-lymphocyte ratio; PMR, platelet-to-monocyte ratio; SII, systemic immune inflammation; HBsAg, hepatitis B surface antigen; AFP, alpha-fetoprotein; CEA, carcinoembryonic antigen; AFU, alpha-L-fucosidase; CA199, Carbohydrate antigen 199; TNM, tumor-node-metastasis, according to the eighth edition of the AJCC (American Joint Committee on Cancer) cancer staging manual.
Next, we performed a LASSO regression analysis on these 11 risk factors. The results revealed that age, FIB-4, AAR, PLR, AFP, AFU, tumor margin, and liver cirrhosis were closely correlated with MVI in the TC (Fig. 3).
 The LASSO coefficient profiles of these 11 factors. Age, FIB-4 index, AAR, PLR, AFP, AFU, tumor margin, and liver cirrhosis were selected using LASSO regression analysis. (B) The optimum parameter (lambda) selection performed ten-fold cross-validation based on the minimum criteria. The partial likelihood deviance (binomial deviance) curve versus the log (lambda) was presented. The optimum values obtained using the lambda are represented using the dotted vertical lines. min and the lambda.1se. Finally, the optimum value, which corresponded to the minimum value of lambda, was selected.")
The LASSO regression model was employed for identifying risk factors. (A) The LASSO coefficient profiles of these 11 factors. Age, FIB-4 index, AAR, PLR, AFP, AFU, tumor margin, and liver cirrhosis were selected using LASSO regression analysis. (B) The optimum parameter (lambda) selection performed ten-fold cross-validation based on the minimum criteria. The partial likelihood deviance (binomial deviance) curve versus the log (lambda) was presented. The optimum values obtained using the lambda are represented using the dotted vertical lines. min and the lambda.1se. Finally, the optimum value, which corresponded to the minimum value of lambda, was selected.
We performed MLRA on these eight risk factors. The results revealed that FIB-4 ≥ 2.59 [OR=4.82, 95% CI: 2.48–9.36, P < 0.001], AFU ≥ 38.95 U/mL (OR=1.91, 95% CI: 1.11–3.28, P = 0.019), AFP ≥ 240.25 ng/mL (OR=2.21, 95% CI: 1.18–4.12, P=0.013), liver cirrhosis (OR=3.68, 95% CI: 2.10–6.48, P < 0.001), and non-smooth tumor margin (OR=7.27, 95% CI: 3.96–13.36, P < 0.001) could independently predict MVI (Table 3). Fig. 4 presents the forest plot of these independent risk factors. Finally, we calculated MVI risk score based on the β-coefficients of these independent risk factors using the formula shown in Table S2.
. Nomogram for predicting the preoperative MVI risk in patients with HCC (B). To use the nomogram, the position of each variable on the corresponding axis was identified. Next, a line was drawn to the axis point to identify the number of points, and the points from all variables were added. Finally, a line was drawn from the total points on the axis to determine the risk of MVI on the lower line of the nomogram.")
Forest plot shows factors independently predicting MVI risk by means of MLRA (A). Nomogram for predicting the preoperative MVI risk in patients with HCC (B). To use the nomogram, the position of each variable on the corresponding axis was identified. Next, a line was drawn to the axis point to identify the number of points, and the points from all variables were added. Finally, a line was drawn from the total points on the axis to determine the risk of MVI on the lower line of the nomogram.
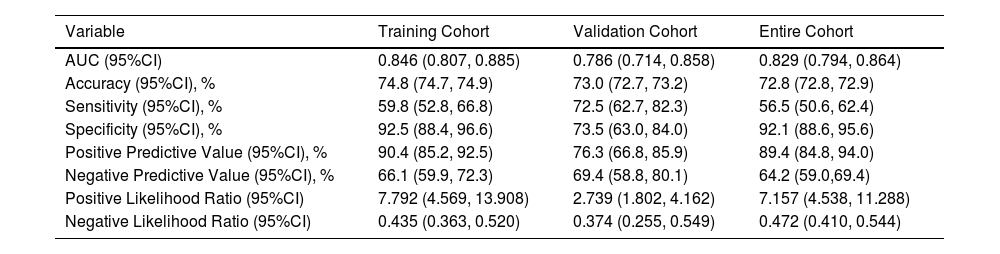
Based on the results of MLRA on the TC, we selected FIB-4 ≥ 2.59, AFP ≥ 240.25 ng/mL, AFU ≥ 38.95 U/mL, non-smooth tumor margin, and liver cirrhosis to construct a nomogram for predicting MVI (Fig. 4). Next, we validated the effectiveness of the nomogram on patients in the VC and entire cohorts. The results revealed that our nomogram demonstrated excellent performance in predicting MVI in the TC, and the C-index was 0.846 (95% CI: 0.807–0.885). The C-index of the nomogram in the VC was 0.786 (95% CI: 0.714–0.858), and the entire cohort was 0.829 (95% CI: 0.794–0.864, Fig. 5). In all cohorts, calibration curves demonstrated a significant level of conformance in predicted MVI incidence by the nomogram and postoperative MVI diagnosis based on pathology (Fig 6). DCA showed that our nomogram exhibited a substantial net benefit over the "treat-none" and "treat-all" strategies across an entire range of threshold probabilities (Fig. 7). The specificity, sensitivity, and negative as well as positive predictive value of the model were 92.5%, 59.8%, 66.1%, and 90.4% in the TC; 73.5%, 72.5%, 69.4%, and 76.3% in the VC; and 92.1%, 56.5%, 64.2%, and 89.4% in the entire cohort, respectively (Table 4).
 curves of the nomogram total points for predicting MVI in the training (A), validation (B), and entire cohorts (C).")
, VC (B), and entire cohorts (C). The X-axis shows the MVI risk predicted by the nomogram. The Y-axis shows the actual postoperative pathological MVI occurrence. A plot along the 45° line could indicate a perfect calibration model wherein the predicted MVI is identical to the actual MVI. The solid line indicates the performance of the constructed nomogram.")
Calibration curves shows the TC (A), VC (B), and entire cohorts (C). The X-axis shows the MVI risk predicted by the nomogram. The Y-axis shows the actual postoperative pathological MVI occurrence. A plot along the 45° line could indicate a perfect calibration model wherein the predicted MVI is identical to the actual MVI. The solid line indicates the performance of the constructed nomogram.
, VC (B), and entire cohorts (C). Black oblique and brown horizontal lines indicate the net clinical benefit of considering all patients as MVI (+) and MVI (−), respectively. The oblique blue line indicates the net benefit of the nomogram at different threshold probabilities.")
DCA shows the TC (A), VC (B), and entire cohorts (C). Black oblique and brown horizontal lines indicate the net clinical benefit of considering all patients as MVI (+) and MVI (−), respectively. The oblique blue line indicates the net benefit of the nomogram at different threshold probabilities.
Accuracy of the nomogram in predicting the risk of MVI.
HBV infection is the leading cause of PLC in China (1). Considering the possible influence of HBV infection on MVI risk, we evaluated the significance of the nomogram in predicting MVI among patients with and without HBV. The patients in all cohorts were classified into the HBV-negative and HBV-positive groups based on HBsAg status. The AUC values of patients in the HBV-positive group in the TC, VC, and the entire cohort were 0.829, 0.779, and 0.818, respectively (Fig. 8). Additionally, the AUC values of patients in the HBV-negative group in the TC, VC, and the entire cohort was 0.894, 0.786, and 0.877, respectively (Fig. 8). ROC curves demonstrated that our model had high accuracy in both HBV-negative and HBV-positive patients.
3.7Analyzing the survival of patients with HCC and different MVI risk score, the VC (B, n = 110), and the entire cohort (C, n = 359), patients with negative HBsAg in the TC (D, n = 100), the VC (E, n = 38), and entire cohort (F, n = 138).")
Based on the risk model, the median probability of MVI incidences was 44.7%. All patients were categorized into low-MVI risk (n = 249, 50.1%) and high-MVI risk (n = 248, 49.9%) groups. In addition, the MVI risk model could classify patients as per their prognosis. The 1-, and 2-year OS rates of patients in the low-MVI risk group were 98.4% and 92.5%, and in the high-MVI risk were 90.7% and 76.6%, respectively. In the high-MVI risk group, the patient's OS was significantly poor compared to that in the low-MVI risk group (P < 0.001). The 1-, and 2-year RFS rates of patients in the high-MVI risk group were 66.5% and 49.5%, and in the low-MVI risk group were 80.7% and 63.5%, respectively. The RFS of patients in the low-MVI risk group was significantly better (P < 0.001, Fig. 9)
4Discussion RFS (B) OS.")
MVI is prevalent among patients with PLC, and the incidence of MVI is about 15%–57% [11]. A study has shown that MVI is an important marker of HCC invasion and metastasis, which could be related to intrahepatic metastasis of early tumor cells [12]. Therefore, the presence of MVI poses a threat to the prognosis of patients with HCC. The prognosis of patients with HCC suffering from MVI treated using different surgical approaches is different [13]. When surgeons suspect that HCC patients are at significant risk for MVI before surgery, they should choose surgical options carefully. Thus, it is essential to construct a model for accurately predicting MVI before surgery. Our results revealed that independent risk factors, including FIB-4 ≥ 2.59, AFP ≥ 240.25 ng/mL, AFU ≥ 38.95 U/mL, non-smooth tumor margin, and liver cirrhosis, are significantly associated with MVI. Additionally, a nomogram was constructed based on these risk factors and verified the nomogram. Furthermore, patients were stratified based on the MVI risk model, and the OS and RFS of patients in the high-MVI risk were poor.
Our results revealed that the risk of MVI was 1.91 times higher in people with AFU ≥38.95 U/mL compared to patients with AFU<38.95 U/mL. To the best of our knowledge, our results are the first to demonstrate that higher AFU levels could predict MVI. AFU is an important lysosomal hydrolytic enzyme [14]. Deugnier et al. demonstrated a significant increase in the AFU levels in the serum of patients with HCC [15]. A study has shown that AFU could be an ideal diagnostic marker for patients with HCC [16]. Previous studies have shown that patients with HCC have a reduced ability to degrade and scavenge AFU, which leads to an increase in AFU levels among these patients [17]. In HCC, patients with high AFU levels had poor OS and increased incidences of vascular invasion [18]. HCC progression is significantly influenced by invasive inflammation [19]. Chemokines produced by the liver during inflammatory responses promote AFU production [20]. This prevents WBCs from penetrating the endothelial cells in the inflamed region during blood transmission. Such an immunosuppressive response could promote the invasion and metastasis of HCC cells [21]. However, the underlying mechanism of high AFU levels and MVI is unclear and should be further explored.
Studies have shown that the FIB-4 index could independently predict liver fibrosis risk [22]. However, the FIB-4 index has never been used to construct a model for predicting MVI risk. Our results showed that FIB-4 ≥ 2.59 could predict MVI risk. Sterling et al. used the combination of the FIB-4 index, AST, ALT, age, and platelets and demonstrated that the FIB-4 index could accurately predict advanced liver fibrosis in patients [23]. Xiao et al. showed that the FIB-4 index was positively correlated with the incidence of liver fibrosis. Moreover, in HCC, the risk of combined cirrhosis in patients with FIB-4 > 1.45 was higher [24]. Zhou et al. showed that the survival rate of patients with FIB-4 > 4.16 post-hepatectomy was significantly low [25]. Additionally, the FIB-4 index is considered a risk factor for the recurrence and metastasis of HCC. A high FIB-4 index indicates higher incidences of recurrence and metastasis in patients with HCC [26]. The specific mechanisms underlying a higher FIB-4 index in patients with HCC suffering from MVI are unclear; however, some of the reasons are as follows: (1) MVI risk is directly proportional to the age of patients with HCC [27]. In HCC, the incidences of metastasis and recurrence are higher in patients with advanced age due to the rapid progression of liver fibrosis in these patients [28]. (2) Platelets are critically involved in cancer progression [29]. Low platelet counts are closely correlated with the recurrence and metastasis of HCC cells. Moreover, low platelet counts could predict MVI in patients [7]. Portal hypertension causes hypersplenism and increased platelet isolation, thereby decreasing the platelet count. As the portal blood flow slows down, HCC patients with low platelet counts increases the risk of MVI [30]. (3) A study showed that high AST levels could independently predict MVI [9]. AST is involved in glutamine metabolism. The energy generated via glutamine metabolism contributes to the metastasis of HCC cells [31]. High AST levels are closely correlated to aggressive inflammatory responses. Invasive inflammatory responses promote the cycle of hepatocyte necrosis and regeneration, thus leading to cancer recurrence and metastasis in patients with HCC [32]. Thus, a high FIB-4 index could promote the invasion of HCC cells and invasive inflammatory responses of the body, thereby increasing the risk of MVI.
Studies have shown that liver cirrhosis could significantly predict metastasis and recurrence among patients with PLC [33,34]. Zhang et al. showed that liver cirrhosis could predict MVI, consistent with our results [35]. Cirrhosis development is usually accompanied by portal hypertension, and the risk of microvascular tumor thrombus increases with a decrease in the velocity of portal blood [30]. Peng et al revealed a close correlation between liver fibrosis and PLC from the perspective of the tumor immune microenvironment. A close correlation between MVI and an increase in fibronectin synthesis were observed in patients with metastatic HCC [36]. Additionally, HCC patients with cirrhosis have low antithrombin levels, which triggers MVI [37].
Our results showed that the non-smooth tumor margin could predict MVI risk. Interestingly, Chen et al. showed a close correlation between the non-smooth tumor margin and the M2 classification of MVI [38]. A study performed histopathological analysis showed that liver tumors with MVI were more likely to penetrate the tumor capsule and infiltrate non-tumor tissues, thereby causing the development of unsmooth tumor margins. A strong correlation was observed between non-smooth tumor margin, tumor invasion, and poor cancer cell differentiation, thus elevating MVI risk [39].
AFP is an important marker used for the diagnosis of patients with HCC and is frequently used for predicting MVI. However, the optimal cut-off value of AFP in the serum for predicting MVI remains unclear [40–42]. Our results showed that the risk of MVI was 2.21 times higher in patients with AFP ≥ 240.25 ng/mL compared to patients with AFP<240.25 ng/mL. High AFP levels have been reported in other cancer types; therefore, additional studies are required to determine the optimal cut-off value of AFP for diagnosing MVI.
Moreover, we performed several analyses, and the results revealed that our nomogram demonstrated excellent accuracy and could be used in clinical settings for predicting MVI risk in patients. Calibration curves demonstrated a significant level of agreement between predicted MVI incidence by the nomogram and the actual MVI risk. DCA showed that our nomogram had a greater net clinical benefit and significant clinical value. Previous studies have only included HBV-positive patients; however, we have included both HBV-negative and HBV-positive patients [7,43]. Based on the HBsAg status, all patients were divided into HBV-negative and HBV-positive groups and constructed ROC curves. The results showed that our model could accurately predict MVI risk in patients, irrespective of the HBV status. In addition, ULRA revealed no clear correlation between MVI and HBV. These results showed that our predictive model demonstrated better predictive performance in patients. In addition, our MVI risk model could accurately stratify patients based on their prognosis.
In this study, we determine the correlation between the FIB-4 index and the AFU level in the serum of patients with HCC and MVI. However, our study has a few limitations. First, we obtained data from a single hospital, and the accuracy of the results should be validated in patients from other hospitals. Second, since we have performed a retrospective analysis, additional prospective studies are required to validate our model. Finally, the sample size of our study was small. Hence, studies with larger sample sizes are required to predict MVI risk.
5ConclusionsIn conclusion, we combined hematological indicators and imaging tumor features (including the FIB-4 index, AFP levels, AFU levels, tumor margin, and liver cirrhosis), followed by constructing and validating a model for predicting MVI risk. Our model demonstrated a good performance in predicting preoperative MVI risk in patients with HCC, thereby assisting clinicians in developing appropriate surgical strategies for those patients.
Data availability statementData is to be made available upon request.


