


Asthma is the most common chronic disease in children, and associations with crowding have been reported. The aim of this study was to explore possible associations of crowding with asthma in children.
MethodsSeven cross-sectional surveys with preschool children were conducted within the framework of the health monitoring units in Bavaria, Germany, from 2004 to 2014. Residential crowding was defined as habitation of more than one person per room or less than 20m2 living space per person. Logistic regression models examined temporal changes in crowding, applying the first survey as reference. The relationship between crowding and physician-diagnosed asthma, asthma defined by the International Study of Asthma and Allergies in Childhood (ISAAC) and asthma symptoms were analyzed.
ResultsAnalyzing temporal changes of crowding rates did not reveal any differences over the years. However, the stratified descriptive analysis indicated a crowding increase in time in urban households where parents had a low education level (47.9% in 2004/05, 55.8% in 2014/15). No association was found between crowding and the variables “physician-diagnosed asthma” in 2014/15, “asthma defined by ISAAC” in 2014/15, or “wheezing” in 2014/15. A positive association with cough was identified in 2014/15 after adjusting for confounders (aOR=1.42 [95% CI: 1.20–1.69]).
ConclusionsIn general, residential crowding did not change from 2004 to 2014; however, there seems to be a small upsurge for children with low-educated parents, living in urban areas over the years. A statistically significant association between crowding and cough was only found in the survey from 2014/15.
In general terms, residential crowding comprises a limited space to live, and is defined as “an excessive number of individuals in relation to available space”.1 Recently, there has been renewed interest in the topic due to emergent demographic changes and housing conditions, such as the diversification of household types.2
A variety of crowding definitions have been suggested, however for the purposes of statistical analysis crowding should be defined as a density measure.3 These measures refer to the number of individuals in a given space, such as the number of persons per room (largely used indicator of crowding),3–5 or per bedroom as in the Canadian National Occupancy Standard or the British Bedroom Standard,5 based on area (unit square – per-person),6 or combinations of the previous ones.7 Crowding is frequently reported as more than one person per room3,5,8–10 and less than 20m2 living space per person.6
There is evidence that residential crowding can take the role as a marker for inequality in housing. Better health indexes and better social and financial status are usually found in less crowded households.4 Previous studies reported associations between crowding and health outcomes, namely diminished mental health, more stress, impairment of social relationships and sleep, and increased risk of hypertension, respiratory illnesses and infections.3,13 Accordingly, the issue of residential crowding has received considerable attention.4 The possible link between dense living spaces and lack of privacy and increase of stress is one of the hypothesized explanations for these associations.3,8 Regarding infections, proximity among individuals, increased number of potential spreaders and prolonged exposure are some of the factors discussed to clarify the observed risk.3
Asthma is a disease with a high prevalence in the Western world and an onset in childhood.12,13 Asthma is the most common chronic disease in children.14 Surveys such as the KiGGS study (German Health Interview and Examination Survey for Children and Adolescents) from 2007 show a 18% lifetime prevalence of asthma, hay fever or atopic dermatitis in 3–6-year-old children.15 According to the ISAAC study (International Study of Asthma and Allergies in Childhood) from 1998 conducted in Munich, Germany, the prevalence of at least one asthma diagnosis in 5–7-year-old children was 10%.16 Moreover, the economic costs, considering only the management of childhood asthma in the European Union are estimated to be around 3000 million Euros.12
Associations of asthma and crowding have also been reported.3 Conditions of housing, including crowding, and poverty levels have been connected to frequent hospitalizations of children suffering from asthma.13 On the one hand, infectious diseases might contribute to exacerbations of some chronic diseases such as asthma,17 likewise some rates of asthma are higher in children who grow up in crowded urban areas.18 On the other hand, the hygiene hypothesis describes a protective effect of crowding on the incidence of atopy and non-infectious respiratory diseases; it is proposed that infections in early childhood lead to a quick maturation of the immune response, resulting in less frequent atopic responses, including asthma.19
The objectives of this study are therefore to examine the changes of crowding from 2004 to 2014 in households with Bavarian preschool children and furthermore to analyze possible associations with different asthma variables.
Material and methodsLiterature overviewA literature overview of respiratory and infectious diseases related to crowding was performed in June 2016 using the PubMed database, cross-referring and including studies reported in the literature review from Gray et al. in 2001.3
Data collectionStarting in 2004, seven surveys have been carried out so far in three rural and three urban regions in Bavaria within a period of 10 years.20 The main objective of these health monitoring units (HMU) is to gather health data of children to assess health promotion strategies. During compulsory school entrance examinations parents of children aged between five and seven are asked to fill in a questionnaire for in the HMU. Informed consent was obtained from parents. The HMU were approved by the local ethics committee of the Bayrische Landesärztkammer (the Bavarian State Medical Council). The publication from Bolte et al. provides further information on the health monitoring units.20
In all seven surveys, information about children's age and gender, country of birth, parental education, migrant status (at least one parent born in a country other than Germany or a foreign language spoken at home), number of rooms and persons living in the home, living space and urban versus rural residency were inquired. In four of the surveys (2004/05, 2006/07, 2012/13 and 2014/15) asthma-related data was collected.
Sociodemographic characteristics of children and their parents including asthma variables and parental countries of origin are described in Table 2 using absolute and relative frequencies.
Exposure to crowdingFor statistical analysis, crowding at home was defined as either at least one person in the household per room (including kitchen and not including bathroom) or less than 20sqm housing space per person as described in previous GME-surveys.21
Asthma- and airway-related symptomsTo analyze associations of crowding and asthma variables, four different variables related to asthma or asthma symptoms were defined.
Medical condition asthma- •
Asthma: lifetime prevalence of asthma diagnosed by a physician.
- •
ISAAC Asthma: diagnostic of asthma defined by ISAAC16 (The International Study of Asthma and Allergies in Childhood); at least once physician-diagnosed asthma or more than once physician-diagnosed asthmatic, spastic or obstructive bronchitis.
- •
Wheeze: whistling or wheeze breath noises during the previous 12 months.
- •
Cough: dry cough at night, not related with flu, in the previous 12 months or cough frequently after waking up in the last 12 months.
To examine temporal changes in crowding, logistic regression and stratified analysis were run. Odds ratios (OR) with 95% confidence intervals (95% CI) were calculated and are presented in Table 3. Variables, whose values changed more than 5% compared to the other surveys were used as covariates to adjust the models examining changes in crowding.
The rates of crowding for all seven surveys were stratified for parental education levels (low as “Hauptschulabschluss”=secondary school or no graduation, middle as “Realschulabschluss”=middle school or others, high as “Fachhochschulreife” or “Abitur”=A-level) only for families who lived in urban areas, see Table 4.
The distribution of asthma variables was examined by descriptive statistics for univariate analysis. Logistic regression was used to explore the associations between crowding and the four asthma variables; ORs and 95% CIs were calculated. The covariates were checked for collinearity with the Variation Inflation Factor (VIF). When VIFs were bigger than “4”, further considerations were needed, when VIFs exceeded “10” the variables were not included in the model.22 All analyses were carried out using SAS for Windows, version 9.4.
Moreover, considering that occupation and education are both socioeconomic variables, a sensitivity analysis using only occupation and only the education variable was performed.
All statistical analyses were performed using SAS, version 9.2 (SAS Institute Inc., Cary, NC, USA).
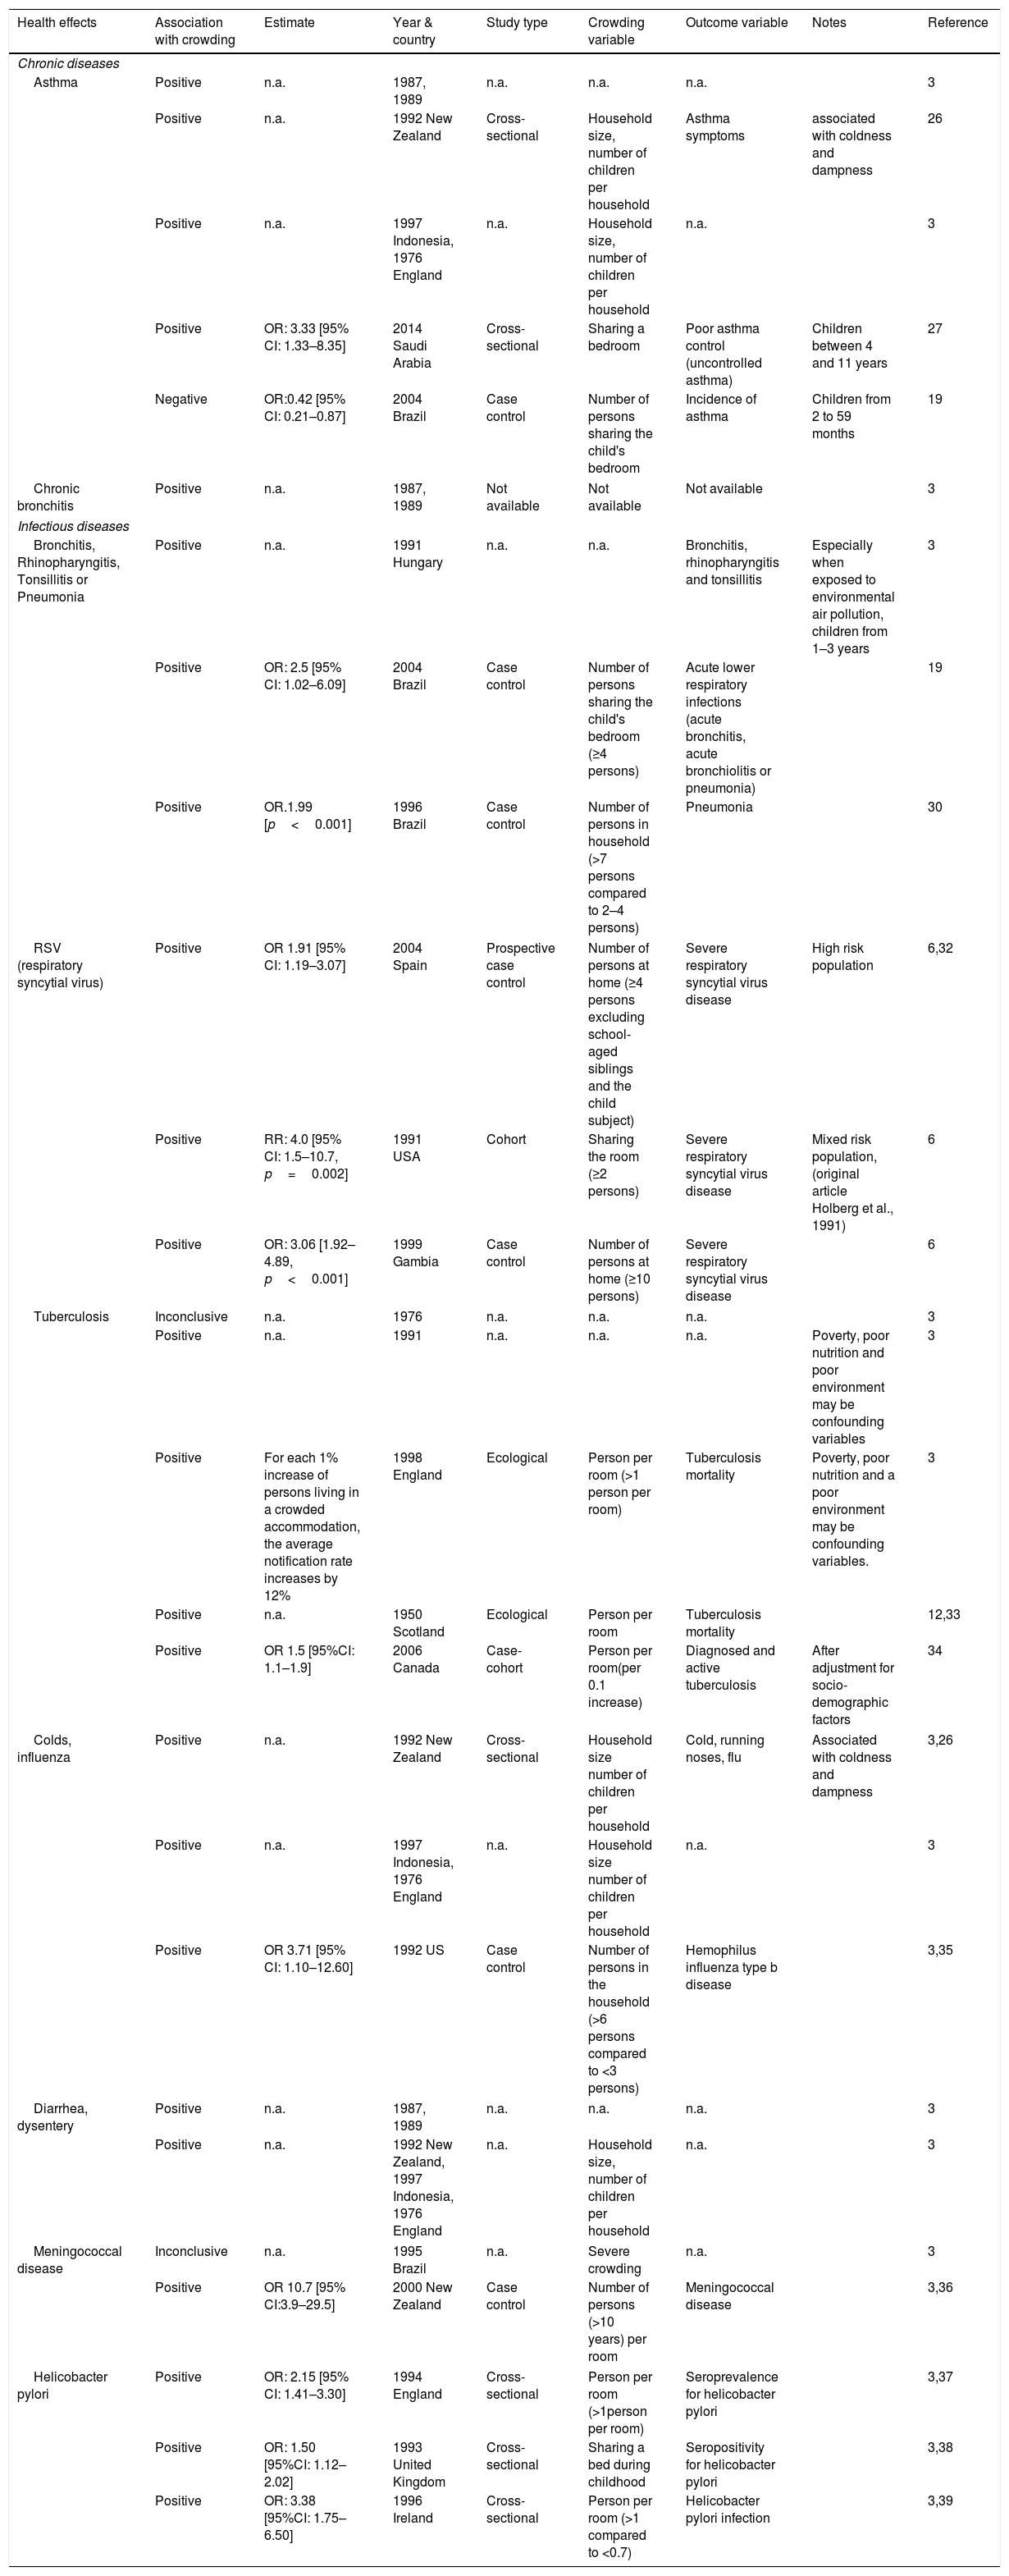
ResultsExisting literatureA literature overview (Table 1) gathers already investigated associations between crowding and respiratory and infectious diseases such as asthma, chronic bronchitis and pneumonia. It includes setting details and analyzed variables. A number of studies determined a positive association of crowding with asthma, even if the crowding definition varied. Further studies indicate that more crowding lead to an increased occurrence of infectious diseases, like bronchitis, respiratory syncytial virus infections, influenza infections or diarrhea.
General literature overview of associations of crowding with asthma, chronic bronchitis and infectious diseases.
| Health effects | Association with crowding | Estimate | Year & country | Study type | Crowding variable | Outcome variable | Notes | Reference |
|---|---|---|---|---|---|---|---|---|
| Chronic diseases | ||||||||
| Asthma | Positive | n.a. | 1987, 1989 | n.a. | n.a. | n.a. | 3 | |
| Positive | n.a. | 1992 New Zealand | Cross-sectional | Household size, number of children per household | Asthma symptoms | associated with coldness and dampness | 26 | |
| Positive | n.a. | 1997 Indonesia, 1976 England | n.a. | Household size, number of children per household | n.a. | 3 | ||
| Positive | OR: 3.33 [95% CI: 1.33–8.35] | 2014 Saudi Arabia | Cross-sectional | Sharing a bedroom | Poor asthma control (uncontrolled asthma) | Children between 4 and 11 years | 27 | |
| Negative | OR:0.42 [95% CI: 0.21–0.87] | 2004 Brazil | Case control | Number of persons sharing the child's bedroom | Incidence of asthma | Children from 2 to 59 months | 19 | |
| Chronic bronchitis | Positive | n.a. | 1987, 1989 | Not available | Not available | Not available | 3 | |
| Infectious diseases | ||||||||
| Bronchitis, Rhinopharyngitis, Tonsillitis or Pneumonia | Positive | n.a. | 1991 Hungary | n.a. | n.a. | Bronchitis, rhinopharyngitis and tonsillitis | Especially when exposed to environmental air pollution, children from 1–3 years | 3 |
| Positive | OR: 2.5 [95% CI: 1.02–6.09] | 2004 Brazil | Case control | Number of persons sharing the child's bedroom (≥4 persons) | Acute lower respiratory infections (acute bronchitis, acute bronchiolitis or pneumonia) | 19 | ||
| Positive | OR.1.99 [p<0.001] | 1996 Brazil | Case control | Number of persons in household (>7 persons compared to 2–4 persons) | Pneumonia | 30 | ||
| RSV (respiratory syncytial virus) | Positive | OR 1.91 [95% CI: 1.19–3.07] | 2004 Spain | Prospective case control | Number of persons at home (≥4 persons excluding school-aged siblings and the child subject) | Severe respiratory syncytial virus disease | High risk population | 6,32 |
| Positive | RR: 4.0 [95% CI: 1.5–10.7, p=0.002] | 1991 USA | Cohort | Sharing the room (≥2 persons) | Severe respiratory syncytial virus disease | Mixed risk population, (original article Holberg et al., 1991) | 6 | |
| Positive | OR: 3.06 [1.92–4.89, p<0.001] | 1999 Gambia | Case control | Number of persons at home (≥10 persons) | Severe respiratory syncytial virus disease | 6 | ||
| Tuberculosis | Inconclusive | n.a. | 1976 | n.a. | n.a. | n.a. | 3 | |
| Positive | n.a. | 1991 | n.a. | n.a. | n.a. | Poverty, poor nutrition and poor environment may be confounding variables | 3 | |
| Positive | For each 1% increase of persons living in a crowded accommodation, the average notification rate increases by 12% | 1998 England | Ecological | Person per room (>1 person per room) | Tuberculosis mortality | Poverty, poor nutrition and a poor environment may be confounding variables. | 3 | |
| Positive | n.a. | 1950 Scotland | Ecological | Person per room | Tuberculosis mortality | 12,33 | ||
| Positive | OR 1.5 [95%CI: 1.1–1.9] | 2006 Canada | Case-cohort | Person per room(per 0.1 increase) | Diagnosed and active tuberculosis | After adjustment for socio-demographic factors | 34 | |
| Colds, influenza | Positive | n.a. | 1992 New Zealand | Cross-sectional | Household size number of children per household | Cold, running noses, flu | Associated with coldness and dampness | 3,26 |
| Positive | n.a. | 1997 Indonesia, 1976 England | n.a. | Household size number of children per household | n.a. | 3 | ||
| Positive | OR 3.71 [95% CI: 1.10–12.60] | 1992 US | Case control | Number of persons in the household (>6 persons compared to <3 persons) | Hemophilus influenza type b disease | 3,35 | ||
| Diarrhea, dysentery | Positive | n.a. | 1987, 1989 | n.a. | n.a. | n.a. | 3 | |
| Positive | n.a. | 1992 New Zealand, 1997 Indonesia, 1976 England | n.a. | Household size, number of children per household | n.a. | 3 | ||
| Meningococcal disease | Inconclusive | n.a. | 1995 Brazil | n.a. | Severe crowding | n.a. | 3 | |
| Positive | OR 10.7 [95% CI:3.9–29.5] | 2000 New Zealand | Case control | Number of persons (>10 years) per room | Meningococcal disease | 3,36 | ||
| Helicobacter pylori | Positive | OR: 2.15 [95% CI: 1.41–3.30] | 1994 England | Cross-sectional | Person per room (>1person per room) | Seroprevalence for helicobacter pylori | 3,37 | |
| Positive | OR: 1.50 [95%CI: 1.12–2.02] | 1993 United Kingdom | Cross-sectional | Sharing a bed during childhood | Seropositivity for helicobacter pylori | 3,38 | ||
| Positive | OR: 3.38 [95%CI: 1.75–6.50] | 1996 Ireland | Cross-sectional | Person per room (>1 compared to <0.7) | Helicobacter pylori infection | 3,39 | ||
n.a.=not available.
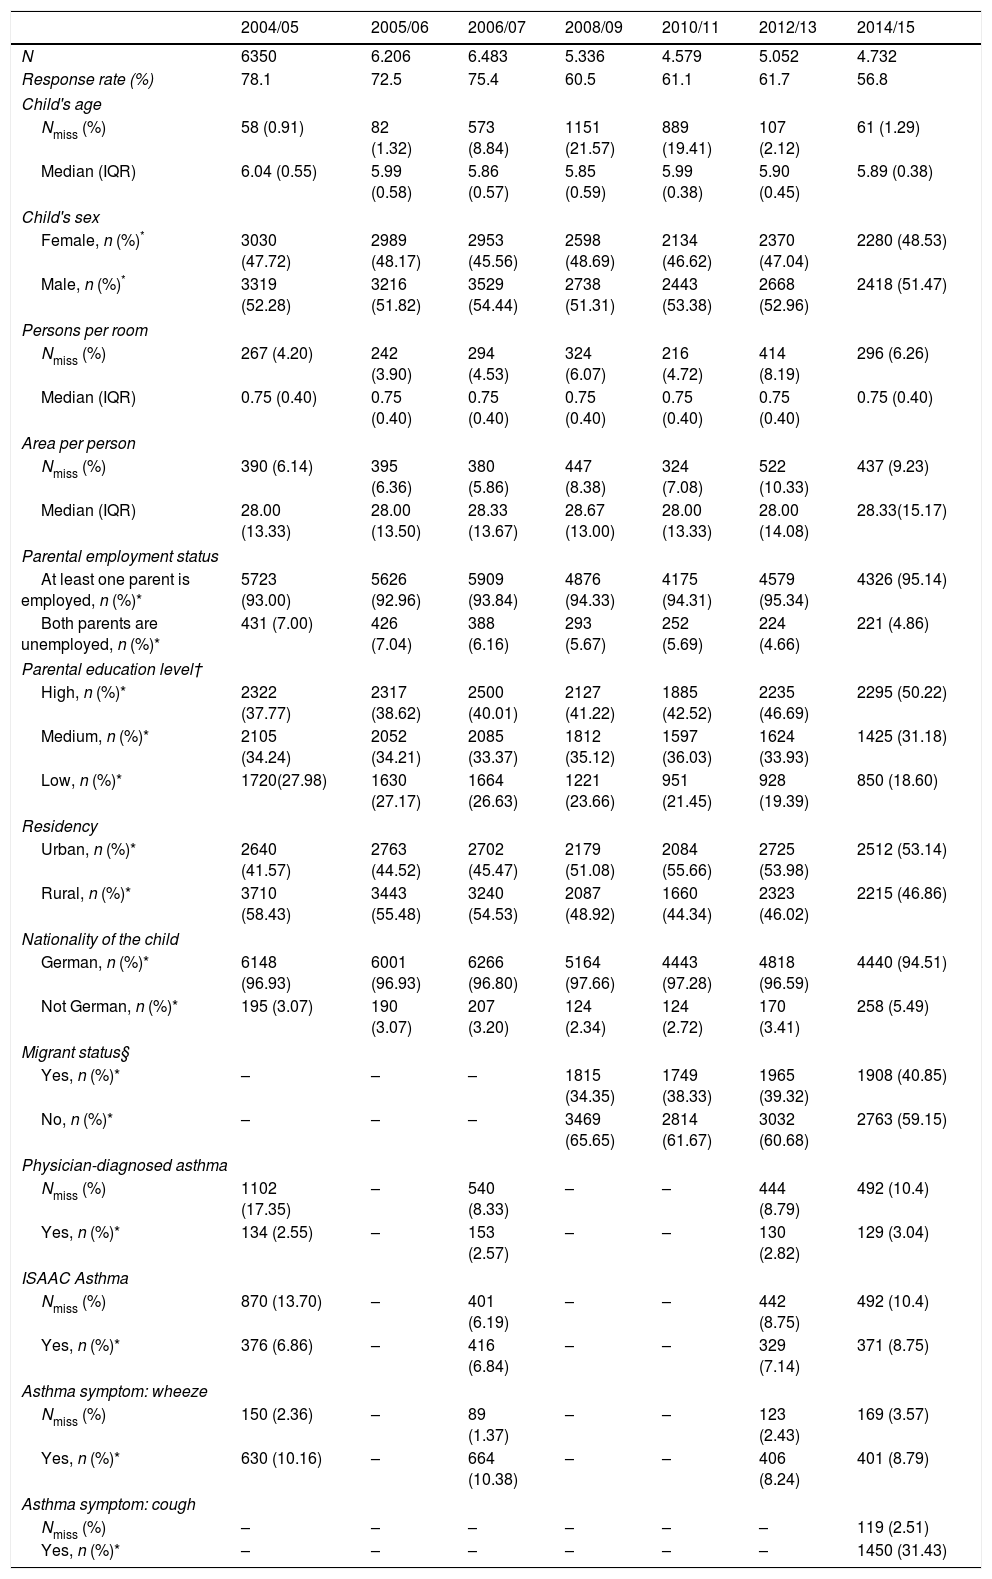
Table 2 provides information about the main sociodemographic variables from all seven surveys. It is apparent that proxy variables of crowding such as number of persons per room and area (m2) per person did not change considerably in time (without considering other variables). The median number of persons per room was 0.75 with an interquartile range (IQR) of 0.40. The median area in square meters per person varied from 28.00 (IQR 13.33) to 28.67 (IQR 13.00) in the surveys. Conversely, Table 2 reveals deviations greater than 5% of rates of parental education level, urban/rural residency and migrant status in the surveys. The percentage of parents with low education level varied from 28.0% in survey 2004/05 to 18.6% in survey 2014/15, 58.5% of the families lived in rural areas in 2006/07 whereas only 46.9% in 2014/15. In 2008/09, 34.4% of children were migrants, in 2014/15 there were 40.9%. Further analysis of our data showed that the migrant status (defined as different parental country of origin) changed over time. In the survey of 2008/09, 34% of all parents had migrant status, whereas in 2014/15 this was 41%. From the year 2010 to 2016 there was a decrease of 9.14% of parents with a Turkish background (2010/2011: 18.9% and 2016/2017: 9.73%), meanwhile there was an increase of parents originated from refugees: Syria, Afghanistan, Iraq, Iran, Nigeria, Somalia (1.4%) or other countries (10.49%).
Sociodemographic characteristics of children and their parents and asthma variables (surveys 2004/05, 2005/06, 2006/07, 2008/09, 2010/11, 2012/13, 2014/15).
| 2004/05 | 2005/06 | 2006/07 | 2008/09 | 2010/11 | 2012/13 | 2014/15 | |
|---|---|---|---|---|---|---|---|
| N | 6350 | 6.206 | 6.483 | 5.336 | 4.579 | 5.052 | 4.732 |
| Response rate (%) | 78.1 | 72.5 | 75.4 | 60.5 | 61.1 | 61.7 | 56.8 |
| Child's age | |||||||
| Nmiss (%) | 58 (0.91) | 82 (1.32) | 573 (8.84) | 1151 (21.57) | 889 (19.41) | 107 (2.12) | 61 (1.29) |
| Median (IQR) | 6.04 (0.55) | 5.99 (0.58) | 5.86 (0.57) | 5.85 (0.59) | 5.99 (0.38) | 5.90 (0.45) | 5.89 (0.38) |
| Child's sex | |||||||
| Female, n (%)* | 3030 (47.72) | 2989 (48.17) | 2953 (45.56) | 2598 (48.69) | 2134 (46.62) | 2370 (47.04) | 2280 (48.53) |
| Male, n (%)* | 3319 (52.28) | 3216 (51.82) | 3529 (54.44) | 2738 (51.31) | 2443 (53.38) | 2668 (52.96) | 2418 (51.47) |
| Persons per room | |||||||
| Nmiss (%) | 267 (4.20) | 242 (3.90) | 294 (4.53) | 324 (6.07) | 216 (4.72) | 414 (8.19) | 296 (6.26) |
| Median (IQR) | 0.75 (0.40) | 0.75 (0.40) | 0.75 (0.40) | 0.75 (0.40) | 0.75 (0.40) | 0.75 (0.40) | 0.75 (0.40) |
| Area per person | |||||||
| Nmiss (%) | 390 (6.14) | 395 (6.36) | 380 (5.86) | 447 (8.38) | 324 (7.08) | 522 (10.33) | 437 (9.23) |
| Median (IQR) | 28.00 (13.33) | 28.00 (13.50) | 28.33 (13.67) | 28.67 (13.00) | 28.00 (13.33) | 28.00 (14.08) | 28.33(15.17) |
| Parental employment status | |||||||
| At least one parent is employed, n (%)* | 5723 (93.00) | 5626 (92.96) | 5909 (93.84) | 4876 (94.33) | 4175 (94.31) | 4579 (95.34) | 4326 (95.14) |
| Both parents are unemployed, n (%)* | 431 (7.00) | 426 (7.04) | 388 (6.16) | 293 (5.67) | 252 (5.69) | 224 (4.66) | 221 (4.86) |
| Parental education level† | |||||||
| High, n (%)* | 2322 (37.77) | 2317 (38.62) | 2500 (40.01) | 2127 (41.22) | 1885 (42.52) | 2235 (46.69) | 2295 (50.22) |
| Medium, n (%)* | 2105 (34.24) | 2052 (34.21) | 2085 (33.37) | 1812 (35.12) | 1597 (36.03) | 1624 (33.93) | 1425 (31.18) |
| Low, n (%)* | 1720(27.98) | 1630 (27.17) | 1664 (26.63) | 1221 (23.66) | 951 (21.45) | 928 (19.39) | 850 (18.60) |
| Residency | |||||||
| Urban, n (%)* | 2640 (41.57) | 2763 (44.52) | 2702 (45.47) | 2179 (51.08) | 2084 (55.66) | 2725 (53.98) | 2512 (53.14) |
| Rural, n (%)* | 3710 (58.43) | 3443 (55.48) | 3240 (54.53) | 2087 (48.92) | 1660 (44.34) | 2323 (46.02) | 2215 (46.86) |
| Nationality of the child | |||||||
| German, n (%)* | 6148 (96.93) | 6001 (96.93) | 6266 (96.80) | 5164 (97.66) | 4443 (97.28) | 4818 (96.59) | 4440 (94.51) |
| Not German, n (%)* | 195 (3.07) | 190 (3.07) | 207 (3.20) | 124 (2.34) | 124 (2.72) | 170 (3.41) | 258 (5.49) |
| Migrant status§ | |||||||
| Yes, n (%)* | – | – | – | 1815 (34.35) | 1749 (38.33) | 1965 (39.32) | 1908 (40.85) |
| No, n (%)* | – | – | – | 3469 (65.65) | 2814 (61.67) | 3032 (60.68) | 2763 (59.15) |
| Physician-diagnosed asthma | |||||||
| Nmiss (%) | 1102 (17.35) | – | 540 (8.33) | – | – | 444 (8.79) | 492 (10.4) |
| Yes, n (%)* | 134 (2.55) | – | 153 (2.57) | – | – | 130 (2.82) | 129 (3.04) |
| ISAAC Asthma | |||||||
| Nmiss (%) | 870 (13.70) | – | 401 (6.19) | – | – | 442 (8.75) | 492 (10.4) |
| Yes, n (%)* | 376 (6.86) | – | 416 (6.84) | – | – | 329 (7.14) | 371 (8.75) |
| Asthma symptom: wheeze | |||||||
| Nmiss (%) | 150 (2.36) | – | 89 (1.37) | – | – | 123 (2.43) | 169 (3.57) |
| Yes, n (%)* | 630 (10.16) | – | 664 (10.38) | – | – | 406 (8.24) | 401 (8.79) |
| Asthma symptom: cough | |||||||
| Nmiss (%) | – | – | – | – | – | – | 119 (2.51) |
| Yes, n (%)* | – | – | – | – | – | – | 1450 (31.43) |
Annotations: IQR=interquartile range; *=percentage of the categories calculated without including missing data; §=defined as at least one parent born in a country other than Germany or a foreign language spoken at home; –=no information available, this variable or proxies were not collected in the survey; Nmiss=number of missing values; †=low as “Hauptschulabschluss”=secondary school or no graduation, middle as “Realschulabschluss”=middle school or others, high as “Fachhochschulreife” or “Abitur”=A-level.
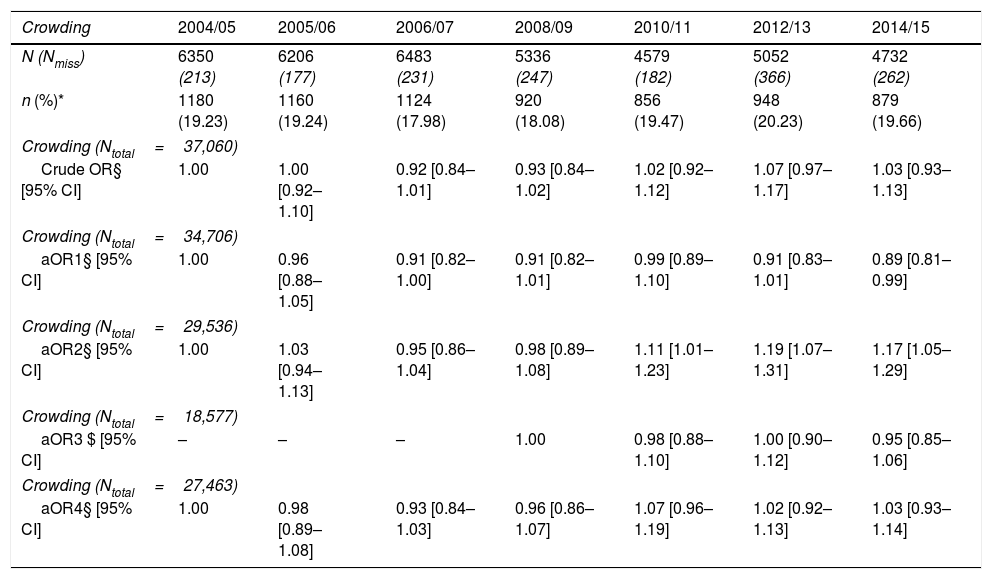
As shown in Table 3, the mean frequency of crowding through the years was 19.1% (2004/5 to 2014/15). No deviations of more than 2.25% were observed between the surveys. Considering the temporal change, model 4 (adjusted for parental education level and residency) did not show a change in crowding frequencies from 2004/05 to 2014/15.
Crowding frequency and logistic regression models.
| Crowding | 2004/05 | 2005/06 | 2006/07 | 2008/09 | 2010/11 | 2012/13 | 2014/15 |
|---|---|---|---|---|---|---|---|
| N (Nmiss) | 6350 (213) | 6206 (177) | 6483 (231) | 5336 (247) | 4579 (182) | 5052 (366) | 4732 (262) |
| n (%)* | 1180 (19.23) | 1160 (19.24) | 1124 (17.98) | 920 (18.08) | 856 (19.47) | 948 (20.23) | 879 (19.66) |
| Crowding (Ntotal=37,060) | |||||||
| Crude OR§ [95% CI] | 1.00 | 1.00 [0.92–1.10] | 0.92 [0.84–1.01] | 0.93 [0.84–1.02] | 1.02 [0.92–1.12] | 1.07 [0.97–1.17] | 1.03 [0.93–1.13] |
| Crowding (Ntotal=34,706) | |||||||
| aOR1§ [95% CI] | 1.00 | 0.96 [0.88–1.05] | 0.91 [0.82–1.00] | 0.91 [0.82–1.01] | 0.99 [0.89–1.10] | 0.91 [0.83–1.01] | 0.89 [0.81–0.99] |
| Crowding (Ntotal=29,536) | |||||||
| aOR2§ [95% CI] | 1.00 | 1.03 [0.94–1.13] | 0.95 [0.86–1.04] | 0.98 [0.89–1.08] | 1.11 [1.01–1.23] | 1.19 [1.07–1.31] | 1.17 [1.05–1.29] |
| Crowding (Ntotal=18,577) | |||||||
| aOR3 $ [95% CI] | – | – | – | 1.00 | 0.98 [0.88–1.10] | 1.00 [0.90–1.12] | 0.95 [0.85–1.06] |
| Crowding (Ntotal=27,463) | |||||||
| aOR4§ [95% CI] | 1.00 | 0.98 [0.89–1.08] | 0.93 [0.84–1.03] | 0.96 [0.86–1.07] | 1.07 [0.96–1.19] | 1.02 [0.92–1.13] | 1.03 [0.93–1.14] |
Nmiss=number of missing values.
Ntotal=number of included children from several surveys.
*=Percentage of the categories calculated without including missing data.
§=Logistic regression model considering survey as the independent variable and 2004/05 category as the reference.
$=Logistic regression model considering survey as the independent variable and 2008/09 category as the reference.
aOR1=logistic regression model with survey as independent variable and adjusted for urban/rural residency.
aOR2=logistic regression model with survey as independent variable and adjusted for education.
aOR3=logistic regression model with survey as independent variable and adjusted for migration status.
aOR4=logistic regression model with survey as independent variable and adjusted for education and urban/rural residency.
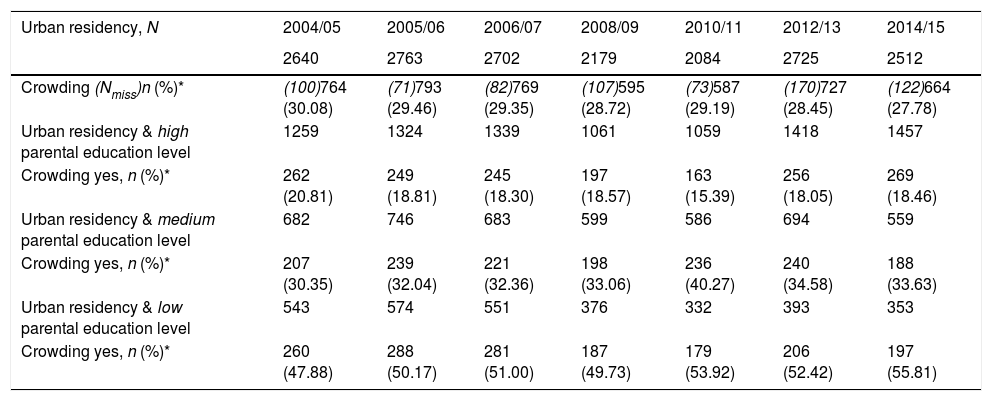
The mean frequency of crowding through the years in rural areas was 29.0% (2004/5 to 2014/15).
Table 4 also shows that the prevalence of crowding in urban areas did not increase in time (30.8% in 2004/05 and 27.8% in 2014/15), however, when stratifying for parental education the percentage of crowding in urban areas with lower parental education level increased slightly to 55.8% in 2014/15 compared to 47.9% in 2004/05.
Urban residency crowding by parental education level.
| Urban residency, N | 2004/05 | 2005/06 | 2006/07 | 2008/09 | 2010/11 | 2012/13 | 2014/15 |
|---|---|---|---|---|---|---|---|
| 2640 | 2763 | 2702 | 2179 | 2084 | 2725 | 2512 | |
| Crowding (Nmiss)n (%)* | (100)764 (30.08) | (71)793 (29.46) | (82)769 (29.35) | (107)595 (28.72) | (73)587 (29.19) | (170)727 (28.45) | (122)664 (27.78) |
| Urban residency & high parental education level | 1259 | 1324 | 1339 | 1061 | 1059 | 1418 | 1457 |
| Crowding yes, n (%)* | 262 (20.81) | 249 (18.81) | 245 (18.30) | 197 (18.57) | 163 (15.39) | 256 (18.05) | 269 (18.46) |
| Urban residency & medium parental education level | 682 | 746 | 683 | 599 | 586 | 694 | 559 |
| Crowding yes, n (%)* | 207 (30.35) | 239 (32.04) | 221 (32.36) | 198 (33.06) | 236 (40.27) | 240 (34.58) | 188 (33.63) |
| Urban residency & low parental education level | 543 | 574 | 551 | 376 | 332 | 393 | 353 |
| Crowding yes, n (%)* | 260 (47.88) | 288 (50.17) | 281 (51.00) | 187 (49.73) | 179 (53.92) | 206 (52.42) | 197 (55.81) |
*Percentage of the categories calculated without including missing data.
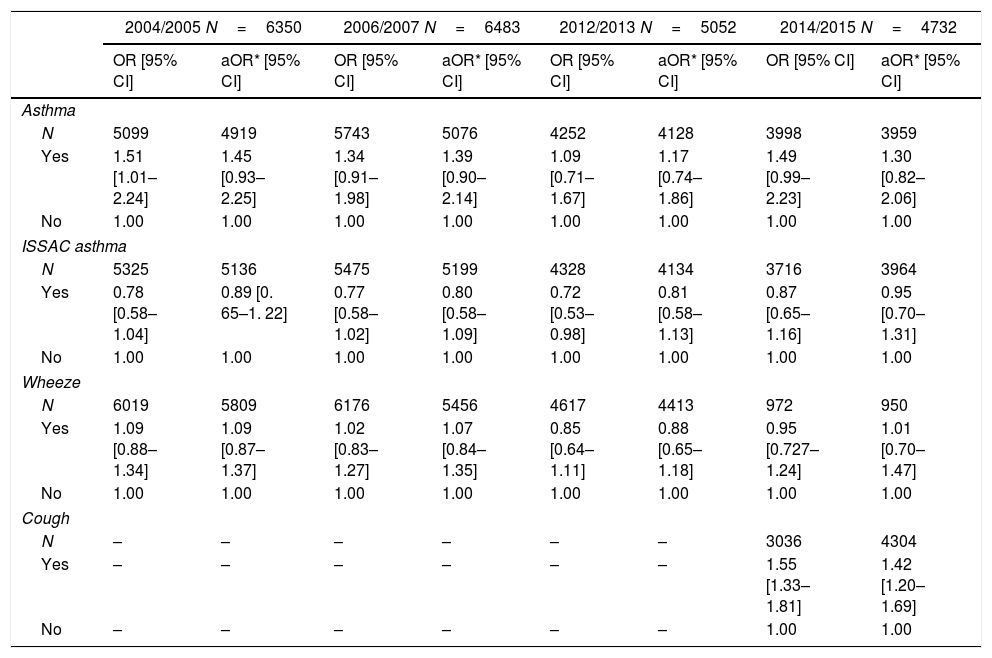
Odds ratios describing associations between crowding and asthma variables are presented in Table 5 for the surveys 2004/05, 2006/07, 2012/13 and 2014/15. Models were adjusted for the following six confounding variables: nationality, occupation, parental education, urban/rural residency, age and sex. The variation inflation factor (VIF) for the covariates used in the logistic regression models did not exceed four.
Logistic regression analysis: crowding associated with asthma variables; Odds ratios (OR) and 95%-confidence intervals [95%-CI].
| 2004/2005 N=6350 | 2006/2007 N=6483 | 2012/2013 N=5052 | 2014/2015 N=4732 | |||||
|---|---|---|---|---|---|---|---|---|
| OR [95% CI] | aOR* [95% CI] | OR [95% CI] | aOR* [95% CI] | OR [95% CI] | aOR* [95% CI] | OR [95% CI] | aOR* [95% CI] | |
| Asthma | ||||||||
| N | 5099 | 4919 | 5743 | 5076 | 4252 | 4128 | 3998 | 3959 |
| Yes | 1.51 [1.01–2.24] | 1.45 [0.93–2.25] | 1.34 [0.91–1.98] | 1.39 [0.90–2.14] | 1.09 [0.71–1.67] | 1.17 [0.74–1.86] | 1.49 [0.99–2.23] | 1.30 [0.82–2.06] |
| No | 1.00 | 1.00 | 1.00 | 1.00 | 1.00 | 1.00 | 1.00 | 1.00 |
| ISSAC asthma | ||||||||
| N | 5325 | 5136 | 5475 | 5199 | 4328 | 4134 | 3716 | 3964 |
| Yes | 0.78 [0.58–1.04] | 0.89 [0. 65–1. 22] | 0.77 [0.58–1.02] | 0.80 [0.58–1.09] | 0.72 [0.53–0.98] | 0.81 [0.58–1.13] | 0.87 [0.65–1.16] | 0.95 [0.70–1.31] |
| No | 1.00 | 1.00 | 1.00 | 1.00 | 1.00 | 1.00 | 1.00 | 1.00 |
| Wheeze | ||||||||
| N | 6019 | 5809 | 6176 | 5456 | 4617 | 4413 | 972 | 950 |
| Yes | 1.09 [0.88–1.34] | 1.09 [0.87–1.37] | 1.02 [0.83–1.27] | 1.07 [0.84–1.35] | 0.85 [0.64–1.11] | 0.88 [0.65–1.18] | 0.95 [0.727–1.24] | 1.01 [0.70–1.47] |
| No | 1.00 | 1.00 | 1.00 | 1.00 | 1.00 | 1.00 | 1.00 | 1.00 |
| Cough | ||||||||
| N | – | – | – | – | – | – | 3036 | 4304 |
| Yes | – | – | – | – | – | – | 1.55 [1.33–1.81] | 1.42 [1.20–1.69] |
| No | – | – | – | – | – | – | 1.00 | 1.00 |
* aOR=logistic regression model was adjusted by confounders: nationality, occupation, parental education level, urban/rural residency, age and sex.
–=no information available, this variable or proxies were not collected in the survey.
No association was found between crowding and physician-diagnosed asthma in any analyzed survey (e.g. 1.45 [95% CI: 0.93–2.25] in 2004/05). Likewise, the analysis of crowding with ISAAC asthma did not reveal any statistically significant association, nevertheless the ORs were mainly lower than 1 (e.g. 0.89 [95% CI: 0.65–1.22] in 2004/05). Furthermore, regarding asthma symptoms, no significant association was detected between crowding and wheeze (e.g. 1.01 [95% CI: 0.70–1.47] in 2014/15). A statistically significant association was only found for crowding and cough only in survey 2014/15: OR=1.42 [95% CI: 1.20–1.69].
DiscussionCrowding frequencies in the surveys show only minor deviations, from the lowest value of 18.0% in 2006/07 to the highest value of 20.2% in 2012/13 (Table 3). After adjusting for parental education level and urban/rural residency, crowding frequencies did not change significantly compared to the first survey. No statistically significant association was found between crowding and physician diagnosed asthma, ISAAC asthma or wheeze. Only with cough, a statistically significant association was found in 2014/15.
The crude results of this study showed changes in crowding of less than 2.25% between the surveys. The median number of persons per rooms in the study did not change from 2004 to 2014 (0.75). The tendency of these results seems to be consistent with data provided by Eurostat (the statistical office of the European Union), whereby the mean number of persons per room in Germany from 2005 to 2009 was 1.7 and from 2010 to 2014 it was 1.8.23 However, according to the literature there are some factors, for instance parental education,4 urban/rural residency7 and migrant status that are closely related to crowding. We considered some of those factors in our study. Over the years, frequencies of parents with a higher education, urban residency and migrant status increased by at least 5% (Table 2). For those variables, an adjusted analysis was performed (Table 3). In the survey of 2008/09, fewer parents had a migrant status than in 2014/15. The model adjusted by parental education and urban/rural residency (model 4 in Table 3) shows that crowding did not change in time. Nevertheless, a stratification analysis (Table 4) indicates that for families living in urban areas with low parental education, crowding increased over the time. Generally, it should be taken into consideration that also wealthier families who live in urban areas have less living space, as there is limited space in cities. Despite this, we found in the literature that a higher socioeconomic status such as a higher education is linked with less residential crowding.4 According to this, it is possible that crowding increased over time in lower educated people living in urban areas. A census from New Zealand showed a general decrease in household crowding during four censored periods (1991, 1996, 2001 and 2006) but this trend was not consistent across all income groups. In this context, it is interesting to mention the results of a New Zealand study, where among people living in social housing (households owned by government or non-profit organizations that rent to people with low income24) crowding increased over time.
Moreover, other variables are needed in order to analyze the effect of crowding isolated in time. One key variable is income, as crowding is habitually associated with lower income and poverty.25 Nevertheless, the level of education is highly correlated with income, and this variable was employed in our study. Other studies also suggest a relation between higher crowding frequencies and immigration growth,25 yet information of migrant status (including information of parental origins) at our study was not available in the questionnaires until 2008/09. Furthermore, another limitation of the study is that those variables that changed in time were not considered for the adjustment in the statistical models or controlled in the study design. For instance, population growth and response rate of the questionnaires (variation from 78% in 2004/05 to 57% in 2014/15). These variables could obscure the real relation between crowding and time.
Regarding asthma, in the adjusted models for the surveys 2004/05, 2006/07, 2012/13 and 2014/15 the associations between crowding and physician-diagnosed asthma show positive odds ratios, where the 95% confidence interval is always inducing the 1.00. However the observed tendency toward a positive association of crowding with asthma seems to be consistent with previous studies.3,26,27 Moreover, one prior study indicated a strong association of crowding with socioeconomic variables (such as parents’ employment status and higher parental education),6 in consequence the variables parents’ employment status and higher parental education could have weakened the estimates of the association between crowding and physician-diagnosed asthma in the adjusted models.
Furthermore, a limitation of our study is the lack of certain key variables. To date previous studies indicated that the association of crowding with asthma is a consequence of a higher exposure to allergens (such as mold, smoke and dust mite), moisture and temperature in crowded households.28 To develop a full picture data of those variables, future studies would need to collect data on them and taken them into account in the context of further crowding analysis. It is somewhat surprising that when it comes to asthma defined by ISAAC in the surveys 2004/05, 2006/07 and 2012/13 the association with crowding was negative (ORs less than 1). This result may be due to the fact that the ISAAC asthma definition itself contains not only physician-diagnosed asthma but also physician-diagnosed asthmatic, spastic or obstructive bronchitis. It is possible that parents with lower education level were less familiar with medical terms, consequently they might report less asthmatic, spastic or obstructive bronchitis than they report asthma. In that event, a systematic bias in the reporting of asthmatic, spastic or obstructive bronchitis would be introduced.
Furthermore, it is important to keep in mind that those studies reviewed describing a positive association of crowding and asthma did not consider the definition person per room or area of the household as crowding variables. They used different definitions of asthma as well, such as poor asthma control or not specified asthma.26,27 Accordingly, the observed discrepancies between the literature and our study could also be attributed to the different definitions.
It is likely that at the children's age (5–7 years old) the diagnosis of asthma has not been yet discovered; hence using an asthma symptom could be more sensitive to find associations. In the analysis of the asthma symptoms no association between crowding and wheeze was observed; in contrast a positive association was found for cough (adjusted OR: 1.33 95% CI: 1.11–1.59), yet information of cough as asthma symptom was only collected in the last survey (2014/15). This cough association is in line with one earlier study that indicated a positive relationship between crowding and asthma symptoms.26 Nevertheless, it is important to consider that cough could be a symptom of other respiratory illnesses as well,29 therefore the results of cough (not specific variable) are not strong enough to conclude about an association between crowding and asthma.
The reader should bear in mind that the investigated study design is cross-sectional, so it is not possible to establish a temporal sequence relationship. Furthermore, only current crowding conditions were asked in the surveys, not the previous status. For instance, a recent study observed that bed-sharing (as a crowding variable) in toddlerhood is associated with an increased risk of asthma at later ages, but not vice versa.
The association between crowding and asthma need to be controlled for confounders. Previous studies reported that sex, age, immunization status, breastfeeding, attendance to nursery, family history of asthma, socioeconomic factors and type of housing were potential confounders,19 and that passive smoking was associated with asthma30 and crowding.6 Nevertheless, the adjustment of the logistic regression models in our study was only based on the availability of confounders’ variables in each survey (see Table 5) Therefore it is important to consider that one limitation of the study is the unmeasured confounders.
In general, it seems that the definition of crowding and asthma plays a key role in the estimation of any association. In our study, a variation in the results tendency was observed when using different variables related to asthma. For instance, a tendency toward a positive association with crowding was found in the case of physician-diagnosed asthma while a tendency toward a negative association was found for ISAAC asthma. Moreover, in both cases no statistically significant association was found, whereas an association of crowding with cough symptom could be observed. Exploring other crowding variables is an important issue for future research, as well as considering that the definition of crowding used in this article is one statistical indicator and does not take into account qualitative measures like people's perception about crowding.3
ConclusionsIn conclusion, our findings show that residential crowding has not changed from 2004/05 to 2014/15 when controlling for parental education level and urban/rural housing. However, crowding has increased among families residing in urban areas with lower education level. Great changes in response rates between surveys limit the analysis of crowding frequency in time.
Our research has also shown that no statistically significant associations between crowding and most of the asthma variables were found (physician-diagnosed asthma, asthma defined by ISAAC and wheeze symptoms). Only one statistically significant association (adjusted Odds Ratio of 1.33 [95% CI: 1.11–1.59]) was found for crowding with cough. The present study contributes to suggest that estimation of an association between crowding and asthma may depend on the definition of variables.
FundingSurveys 1, 2, 3, 5, 6 and 7 were supported by the Department of Occupational and Environmental Epidemiology, Bavarian Health and Food Safety Authority (Bayerisches Landesamt für Gesundheit und Lebensmittelsicherheit), Munich, Germany. Survey 4 was part of the project ‘Tabakrauchbelastung von Kindern in Bayern: Ansatzpunkte für Gesundheitsförderungsstrategien auf Gemeindeebene’, which was funded by the Gesundheitsinitiative ‘Gesund.Leben.Bayern.’ of the Bavarian State Ministry of the Environment and Public Health.
Conflict of interestNone declared.
