


Prostate cancer is usually diagnosed by transrectal ultrasound (TRUS) biopsy. Nevertheless, suspicious images are frequently not found. Imaging analysis studies aim to identify ultrasound patterns characteristic of apparently hidden conditions.
Material and methodsWe digitally recorded 288 TRUS ultrasound guided transrectal biopsies and extracted 3 static images from the puncture-biopsy area. The extraction of the texture characteristics were obtained by “simple mapping” on a gray scale and spatial gray level dependence matrices (SGLDM), also known as Haralick's co-occurrence matrices, which study the relationship of each pixel and its neighbors. A pattern recognition software system was developed with two different classification methods: nearest neighbor (k-NN) and Markov's hidden models. Finally, a virtual experiment was carried out in which four urologists compared their diagnostic accuracy for prostate cancer with our system in 408 TRUS images, not in real time.
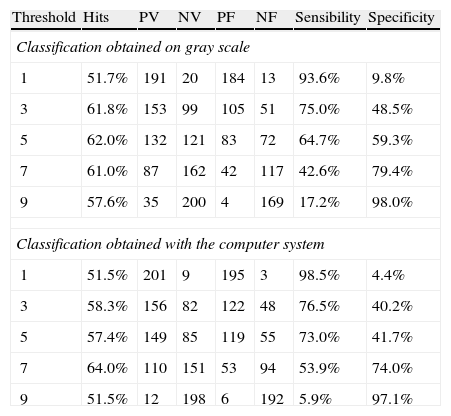
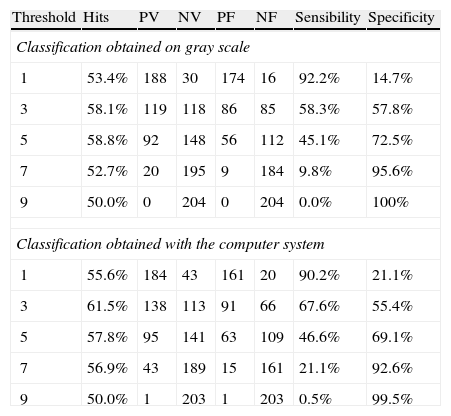
ResultsThe diagnostic capacity (ROC curve) with the simple gray map study was 59.7% with nearest-neighbor classification and 61.6% with Markov's hidden models classification. The co-occurrence matrices showed an area under ROC curve of 60.1% and 60.0% with k-NN and Markov's hidden models classification, respectively. The virtual experiment was conducted with a simple gray map study and k-NN classification. The images processed by our system showed the following diagnostic accuracy: 63.3, 67, 64.3 and 63.7% compared to 61.7, 60.5, 66.2 and 60.7% with the original image.
ConclusionsOur pattern recognition system for prostate cancer TRUS images has a limited, yet stable, accuracy.
El método de diagnóstico de elección del cáncer de próstata (CP) es la biopsia transrectal guiada ecográficamente. Sin embargo, es frecuente no objetivar imágenes sospechosas. Los estudios de análisis de imagen pretenden identificar patrones ecográficos propios de una patología aparentemente ocultos.
Materiales y métodoRegistramos digitalmente 288 biopsias transrectales ecoguiadas, de las que se aislaron imágenes estáticas de cada punción-biopsia para su análisis computarizado. Para ello se procedió a la extracción de características de textura mediante «mapeo simple» en escala de gris y «matrices espaciales dependientes del nivel de gris» o «matrices de coaparición», que estudian la relación de cada píxel con sus vecinos. Se desarrolló un sistema de «reconocimiento de formas» con dos métodos de clasificación: «técnica de k-vecinos» y «modelos ocultos de Markov». Finalmente realizamos una simulación del sistema con 4 ecografistas, comparando su capacidad diagnóstica en escala de gris con imágenes procesadas con nuestro sistema en 408 punciones grabadas, no en tiempo real.
ResultadosLa capacidad diagnóstica (curva ROC) con mapeo simple fue de 59,7 y 61,6% con clasificación mediante k-vecinos y modelos ocultos de Markov, respectivamente. Las matrices de coaparición ofrecieron un área bajo la curva ROC de 60,1 y 60,0%. El experimento virtual se llevó a cabo mediante «mapeo simple» y clasificación con «k-vecinos», otorgando una capacidad diagnóstica en cada urólogo de 63,3, 67,0, 64,3 y 63,7% frente a 61,7, 60,5, 66,2 y 60,7% conseguidas con la imagen original.
ConclusionesLa utilización de nuestro método de análisis de imagen tiene una capacidad limitada, aunque estable, en la detección de áreas prostáticas cancerígenas.
