


Editado por: Dra. Núria Torner CIBER Epidemiologia y Salud Publica CIBERESP Unitat de Medicina Preventiva i Salut Pública Departament de Medicina, Universitat de Barcelona
Más datosThe objective of this study is to develop a mathematical model for the COVID-19 pandemic including vaccination, the transmissibility of the virus-pathogen dose-response relationship, vaccine efficiency, and vaccination rate.
MethodsThe Runge-Kutta (RK-45) method was applied to solve the proposed model with MATLAB code and the calculated results show the dynamics of the individuals in each compartment. The data of total death due to the COVID-19 pandemic in the case of the USA were collected from GitHub and the re-use of this data needs no ethical clearance. The control reproduction number was used to assess the dose-response relationship and critical vaccination coverage.
ResultsWe have calculated the probability of infection and the infection risk against the different exposure doses and the virus copies, respectively. The results show that the probability of infection increases with the increasing exposure dose for certain virus copies and the risk of infection decreases with the increasing of virus copies for a certain exposure dose. The results also show that the critical vaccination coverage demands increase with an increase in transmission rate and decrease with increasing vaccine efficacy.
ConclusionsIt was seen that the critical vaccination coverage corresponding to an increased transmission rate rise sharply in the beginning and then reached a threshold. Moreover, the real data of the total death cases in the USA were compared with the fitted curved of the model which validated the proposed model. Vaccination against COVID-19 is essential to control the pandemic, and achieving high vaccine uptake in the population can reduce the pandemic as fast as possible.
El objetivo de este estudio es desarrollar un modelo matemático para la pandemia de COVID-19 que incluya la vacunación, la transmisibilidad de la relación dosis-respuesta virus-patógeno, la eficacia de la vacuna y la tasa de vacunación.
MétodosSe aplicó el método de Runge-Kutta (RK-45) para resolver el modelo propuesto con código MATLAB y los resultados calculados muestran la dinámica de los individuos en cada compartimento. Los datos de muerte total por la pandemia de COVID-19 en el caso de EE. UU. se recopilaron de GitHub y la reutilización de estos datos no necesita autorización ética. El número de reproducción de control se utilizó para evaluar la relación dosis-respuesta y la cobertura de vacunación crítica.
ResultadosHemos calculado la probabilidad de infección y el riesgo de infección frente a las diferentes dosis de exposición y las copias del virus, respectivamente. Los resultados muestran que la probabilidad de infección aumenta con el aumento de la dosis de exposición para ciertas copias del virus y el riesgo de infección disminuye con el aumento de las copias del virus para una determinada dosis de exposición. Los resultados también muestran que las demandas críticas de cobertura de vacunación aumentan con el aumento de la tasa de transmisión y disminuyen con el aumento de la eficacia de la vacuna.
ConclusionesSe observó que las coberturas críticas de vacunación correspondientes a una mayor tasa de transmisión aumentaron bruscamente al principio y luego alcanzaron un umbral. Además, se compararon los datos reales del total de casos de muerte en EE. UU. con la curva ajustada del modelo que validó el modelo propuesto. La vacunación contra el COVID-19 es fundamental para controlar la pandemia, y lograr una alta captación de vacunas en la población puede reducir la pandemia lo más rápido posible.
Although the virus COVID-19 was first identified in Wuhan city, China1, however, it started taking a heavy toll on Europe, the United States, Brazil, and India and turned into an unexpected crisis in public health in all nooks and corners of the world. Early detection, isolation, tracing close contact, and treating mild cases are effective to control the outbreak of this disease and the proper interventions have a positive impact in delaying the epidemic peak and reducing the final epidemic size.2 Due to uncertainties of the disease, investigators have used several mathematical models considering vaccination impact to forecast the characteristics of transmission parameters and controling rate.
Many researchers developed a variety of epidemic models under the circumstance of limited resources and discussed the outbreak, and schemed the path of transmission in a different situation.3–8 Among the different models, a time-dependent SIR model and a standard SEIR model for transmission of COVID-19 and estimated a time-dependent reproduction number was developed by Hong and Li6 and Buckman et al.7, respectively. They suggested that social distancing during the early stages of the epidemic might lower the effective reproduction number each day and mitigate the spread of COVID-19. A model named SEIATR which was developed to estimate the epidemic peak and time-dependent reproduction number of COVID-19 in South Asian Countries (India, Pakistan, Bangladesh, and Afghanistan), suggested that the asymptomatic population played an important role in the trends of the pandemic.8 An asymptomatic individual might have a major influence on the transmitting as it affects the respiratory system.9 Time-dependent disease reproduction number can serve as a metric for timely evaluating effects of mass health policies.6 The literature review shows that the dynamics of COVID-19 through the entire population such as stability analysis, epidemic size, and epidemic spread based on basic reproduction number were well investigated. However, the performance of vaccine efficiency to human immunity against COVID-19 are not well investigated yet.
COVID-19 vaccination started in December 2020 and upto date, several vaccines, such as Pfizer BioNTech, Moderna, Oxford-AstraZeneca, Sinovac, Spotnic V, Jonson & Jonson, etc has been developed. It has been recognized that the COVID-19 vaccines are relatively safe,10 this finding is not widely available when vaccines are freshly distributed. Several studies already carried out to explore the effective vaccination strategies by using a mathematical model.11–16
Numerical simulations indicate that COVID-19 can be controlled in the community with the implementation of vaccination and treatment.16 The model results showed that random vaccination was efficient in reducing the overall number of infected individuals.17 Looking at vaccine effectiveness scenario modeling showed that a vaccine with more than 50% effectiveness will lead to pandemic control, provided that a high percentage of the population is optimally vaccinated.18
Furthermore, dose-response analysis is essential for the risk assessment paradigm, which describes the relationship between a certain dose of a pathogen and the probability of infection. Conceptual models of dose-response functions differ between microbes and chemical agents.19 The nature of data and the use of dose-response functions in risk assessment are similar. A better understanding of the vaccination program and dose-response relation-related parameters is essential to evaluate the effectiveness of fractional dose vaccination on disease control at the population level. A mathematical expression for the dose-response relation was established that described the probability of infection after contact and determined the success of pathogen establishment into host cells, and the shape of the observed dose.20 Watanabe et al.21 presented a dose-response model between humans and viruses and measured the risk of SARS via any possible routes of infection.21 Zhang et al.22 developed a dose-response relation for SARS, and MERS coronavirus based on mice experiments to shed light on the dose-response relation for humans and showed that the infection risk caused by one virus copy in viral shedding is about 1.5×10⁻⁶ to 1.6×10−5.22 Chu et al.23 showed that the dose-response relation for SARS and COVID-19 is an exponential function, which behaves nearly linearly if the probability of infection was less than 15%.23 Cascini et al.24 focused that the people who are unwilling to be vaccinated or reject vaccines constitute the major issue. Although, these studies have made significant contributions to investigate the COVID-19 in different aspects and its controlling system by vaccination, but we need more investigations to know about vaccine efficiency.
From the analysis of previous studies, it is apparent that proper modeling of COVID-19 depends strongly on the appropriate evaluation of the controling factors. This article, therefore, focuses on the two stains mathematical analysis of the COVID-19 pandemic including the vaccination and treatment compartment to the control reproduction number, transmissibility of the virus, vaccine efficacy, and vaccination rate. This paper is organized as follows. The proposed COVID-19 model is formulated in Section 2. Numerical analysis and results are presented in Section 3. Finally, the conclusions are summarized in Section 4.
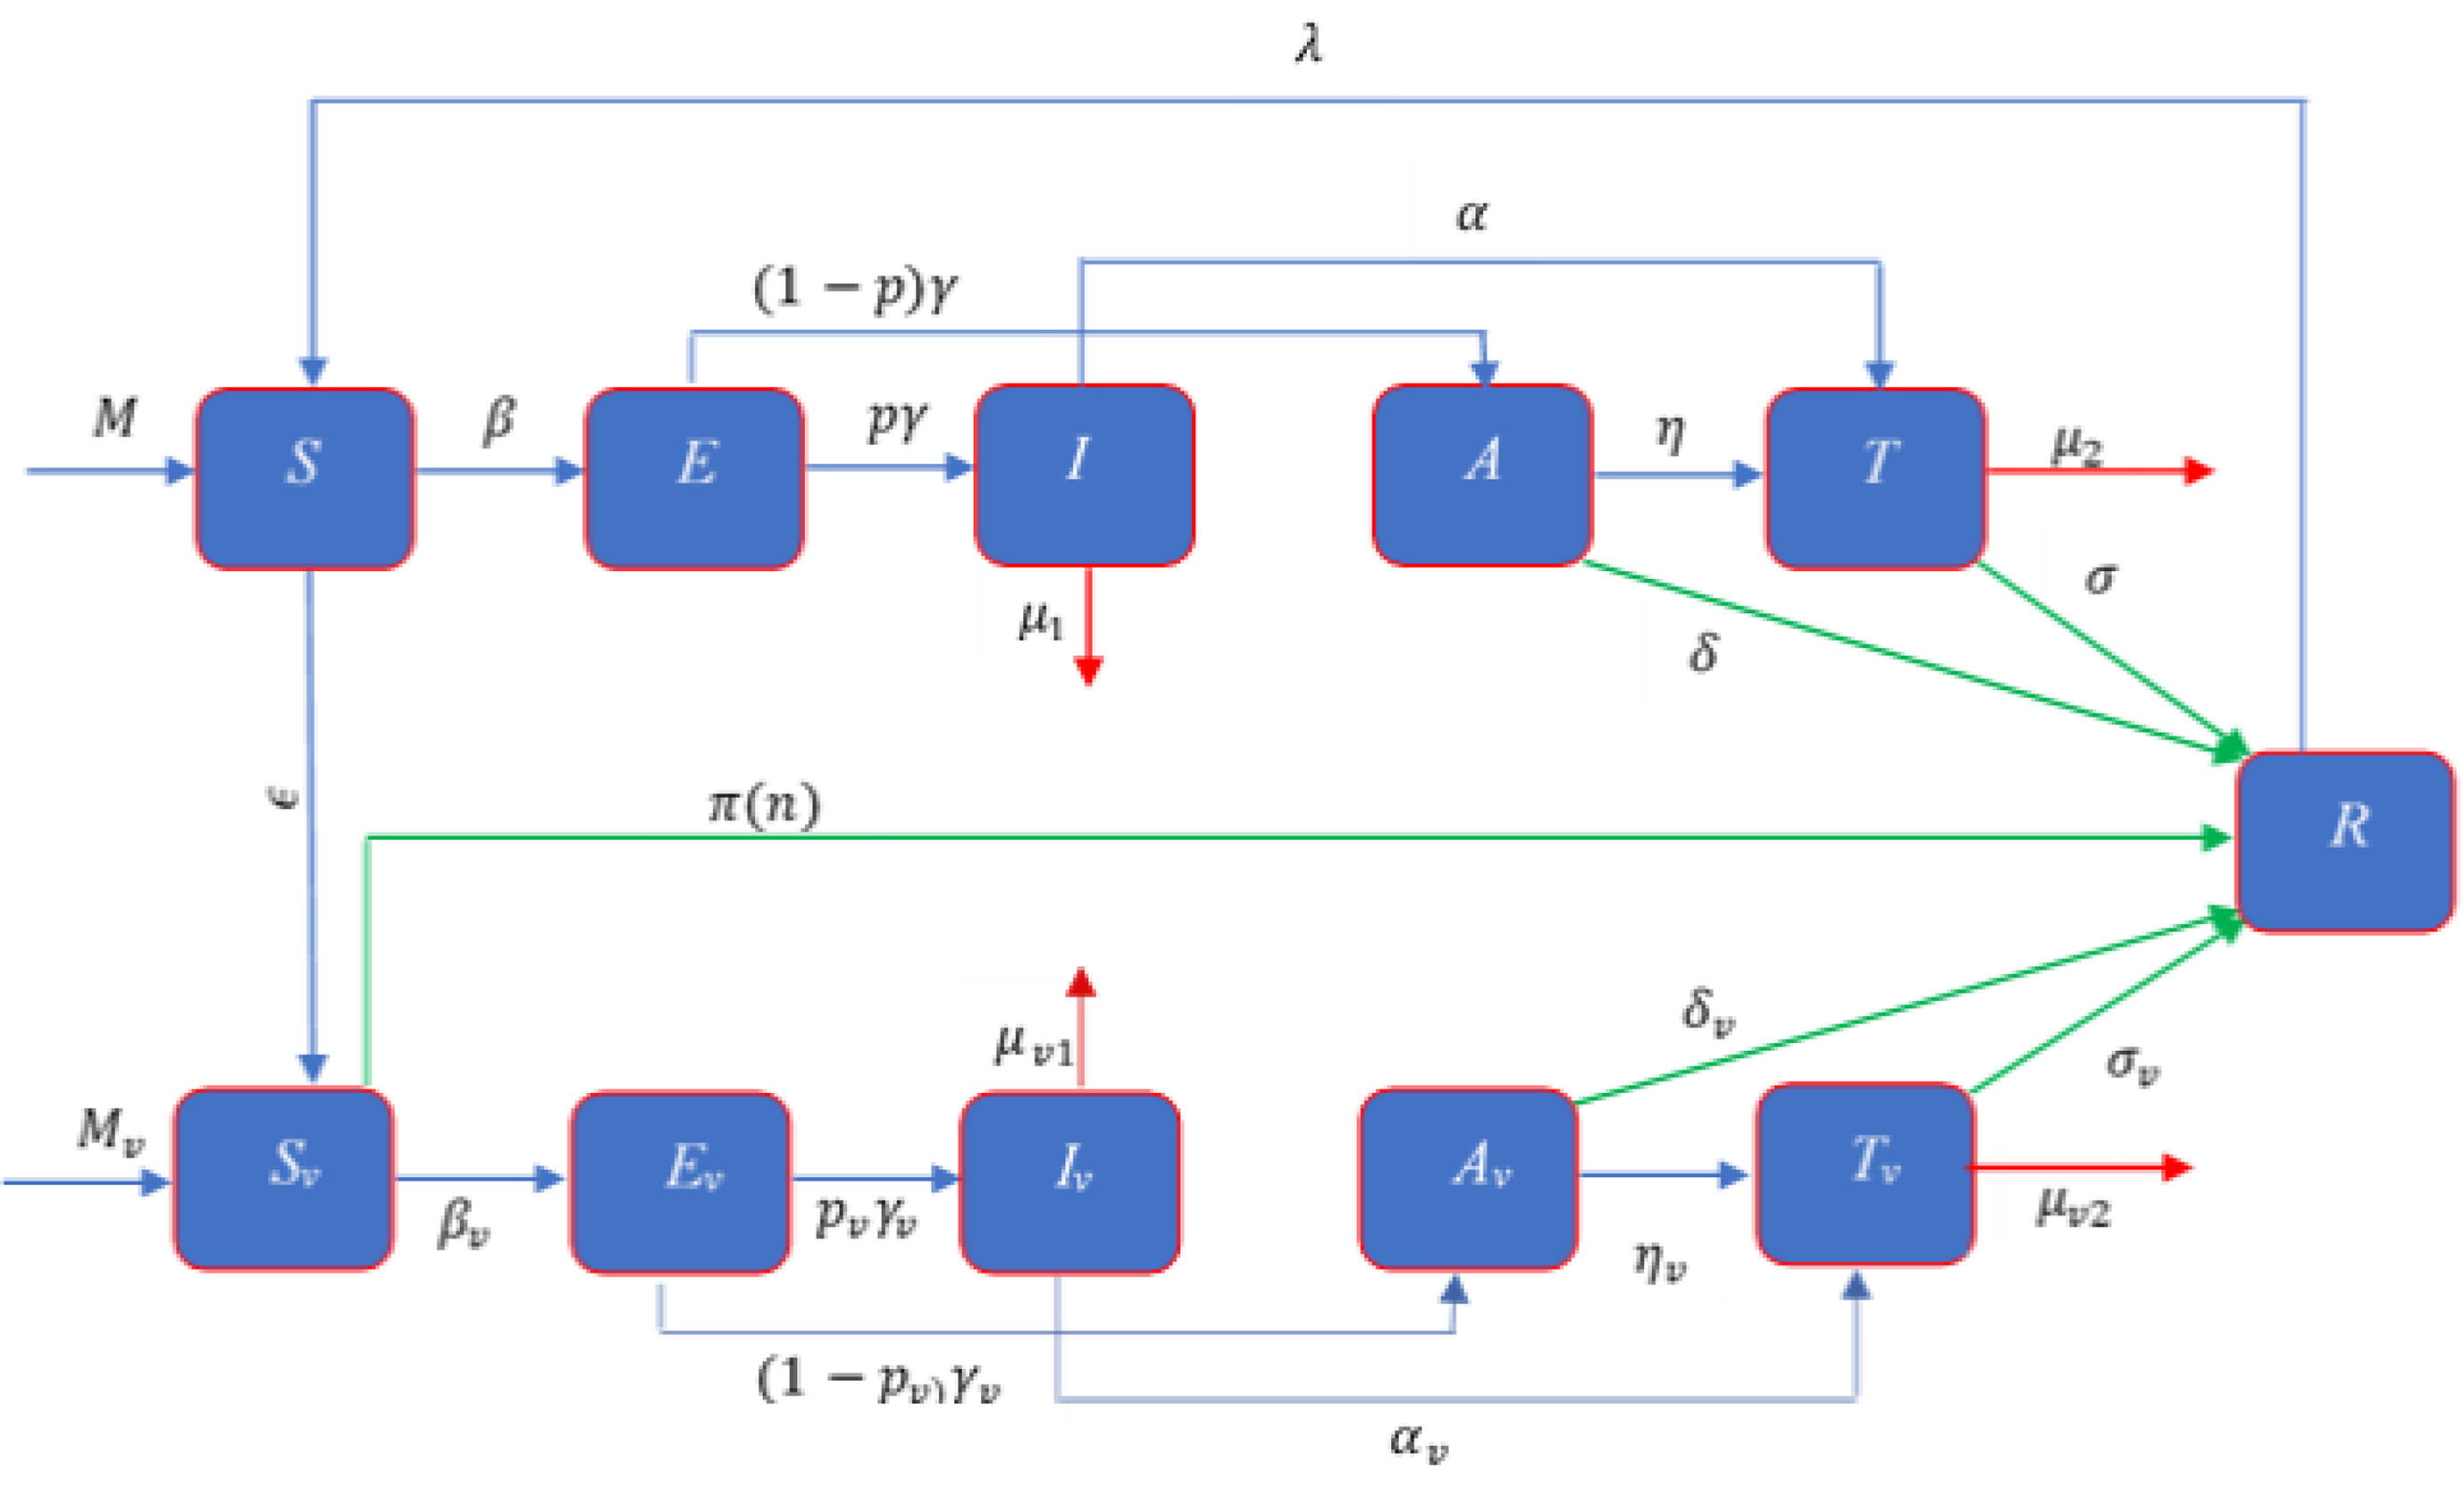
ModelModel formulationMathematical formulation based on the several compartments are very common technique for investigating the infectious diseases. In this technique, the total population is divided into several sub-compartments. The models are generally run with the ordinary differential equations those describe the flow patterns of individuals among the compartments. The proposed mathematical model is developed based on the SEIATR compartmental model.8 We divide the total population into two main compartments: non-vaccinated population and vaccinated population. We also assume that the population is vaccinated at a rate of ϵ, and π(n) is the effective rate of the vaccination which goes to the removal compartment (R). Furthermore, we divide the vaccinated population into five compartments: the susceptible population (Sv), the exposed compartment (Ev), the infected compartment (Iv), the asymptomatic population (Av), and the treatment compartment (Tv). Similarly, the non-vaccinated compartment is also divided into five compartments: the susceptible population (S), the exposed compartment (E), the infected compartment (I), the asymptomatic compartment (A), and the treatment compartment (T). The flow chart of individuals among the different compartments is illustrated in Fig. 1.
There are three main parameters, such as transmission dynamics, the vaccine’s efficacy, and antiviral treatment to estimate the new infective individuals across the hazard scale affected by the COVID-19. From the aforementioned and the model flow diagram (Fig. 1), we can derive the following nonlinear system of differential equations as:


Schematic diagram of the compartmental model describing the transmission of the COVID-19 pandemic taking into account the vaccination program. Variables and parameters are defined in Table 2.
where Q is defined by Q = I + ρ1A + ρ2T + Iv + ρv1Av + ρv2Tv, and the initial conditions are given by
S(0) = (1 − ε)S0,E(0) = E0,I(0) = I0,A(0) = A0,T(0) = T0,R(0) = R0 and

The symbols β and βv represent the transmission rate of the COVID-19 for non-vaccinated and vaccinated susceptible population, respectively, and [1,ρ1,ρ2, 1,ρv1,ρv2] is the row vector of relative horizontal transmissions of the diseases for I, A, T, Iv, Av, and Tv, respectively. Furthermore, 1γ and 1γv are the average incubation period for the non-vaccinated and vaccinated populations, respectively. p and pv are the fraction of the non-vaccinated exposed population (E) and vaccinated exposed population (Ev) those goes to non-vaccinated infective population compartment (I) and vaccinated infective population compartment (Iv) at a rate γ and γv, respectively and remain population goes to corresponding asymptomatic compartments (A, Av) which are shown in Fig. 1. For the non-vaccinated population, let α and η be the rate of the infective (I) and asymptomatic (A) population that goes to the treatment compartment (T), respectively. Similarly, for the vaccinated population, let αv and ηv be the rate of the infective (Iv) and asymptomatic (Av) population which goes to treatment compartment (Tv), respectively. 1σ and 1σv are the average treatment period for non-vaccinated and vaccinated population, respectively and 1δ and 1δv are the average recovery period of the non-vaccinated asymptomatic and vaccinated asymptomatic populations, respectively. We assume M and Mv as the migration rate of the non-vaccinated and vaccinated population, respectively, and λ be the re-susceptible rate. μ1, μ2, μv1, and, μv2 are the mortality rate of the non-vaccinated infective, non-vaccinated treatment, vaccinated infective, and vaccinated treatment population, respectively.
In addition, we assume that
- 1.
The transmission in a vaccinated population is τ times lower than that of the non-vaccinated population, that is, βv = τβ, where 0 ≤ τ ≤ 1.
- 2.
Vaccination reduces the rate of departure from Ev to Iv by a factor ς from that of the rate from E to I, that is, pv = ςp, where 0 ≤ ς ≤ 1.
- 3.
Vaccination can decrease at the rates γv, αv, ηv, μ1, μ2 and it is reasonable that γv ≤ γ, αv ≤ α, ηv ≤ η, μv1 ≤ μ1, μv2 ≤ μ2.
Also

We assume ξi = [0,1], where i = 1, 2, 3, 4, 5, 6, 7, 8, 9, and define the following relations
γv = ξ1γ,αv = ξ2α,ηv = ξ3η,μv1 = ξ4μ1,μv2 = ξ5μ2,σ = ξ6σv,δ = ξ7δv.
We also assume

Lemma: Subject to the initial conditions presented in Eq. (12), the total recovery population can be determined by the relation

Proof: The total non-vaccinated and vaccinated infected population can be defined, respectively as

and

Now adding Eq.(1) and Eq. (2), we get

Integrating Eq. (3) and taking the limit from 0 to t, we have

Again, integrating Eq.(13) with the limits from 0 to t, yields

Furthermore, integrating Eqs. (4) and (5) from 0 to t, we have


Similarly, Eqs. (8), (9) and (10) gives as follows


By integrating of Eq. (11) with the limits 0 to t, and simplifying it with the help of Eqs. (16), (18), (17), (19), and (20), we get

Thus,

Hence the lemma is proved.
Control reproduction numberThe basic reproduction number (R0) is the expected value of secondary infection by one infective population during its entire infectious period.25 This number is determined by the spectral radius of the next generation matrix FV−1for compartmental disease models,26 where F and V are the matrices of new secondary infection terms and the remaining transmission (increase or decrease of disease) term, respectively. From the system of Eqs.(1) –(11), we obtain the F and Vmatrices as follows


Thus, we obtain

where


Here Ru andRv are the basic reproduction number for the non-vaccinated population and vaccinated population, respectively. It is worth mentioning here that the infection at the beginning in a population that is not completely susceptible is called the control reproduction number Rc rather than the basic reproduction numberR0, and it is the number of secondary infections both in the vaccinated and non-vaccinated population.26
Dose-response relationshipThe fundamental dose-response relation which fixes a number of the pathogen (dose) with the probability of infection is important for evaluating and controlling the transmission risk of the disease. Zhang et al.22 proposed an exponential dose-response relation which is widely used for SARS, MERS, MHV-1, and COVID-19.21,27,28 Chu et al.23 calculated that the anticipated probability of viral infection is about 12.8% within 1 meter, which decreases to about 2.6% at a further distance.23 The dose-response relation proposed by Zhang et al.22 is given by

where p is the infection probability, d is the exposure dose and k is the pathogen-dependent parameter in the range of 6.19 × 10⁴to 7.28 × 10⁵ virus copies.
Dose-response relation possesses the following properties:
- (i)
If there are no pathogens, then the probability of infection is zero;
- (ii)
If there are a large number of the pathogen (doses), then the probability of infection is large, with limd→∞pd=1, i.e., the dose probability of infection tends to be one at an infinite dose.
For a homogeneously mixed population, the transmission rate (β) of the disease spread is the product of infection probability (p) with the individual contact rate,29 which depends on the population density (ρ).30 Hence,

With the help of Eq. (14) and Eq. (15), we obtain

where c0 is a constant.
Critical vaccination coverageFor homogeneously mixed populations, critical vaccination coverage (Vc) is defined as11

whereRcrepresents the control reproduction number as defined earlier. In terms of Rc , the minimum vaccination coverage can be defined as31

where r is the fraction of the vaccinated population that are completely immunized and s is the proportional reduction of the susceptibility for those who are partially immunized.
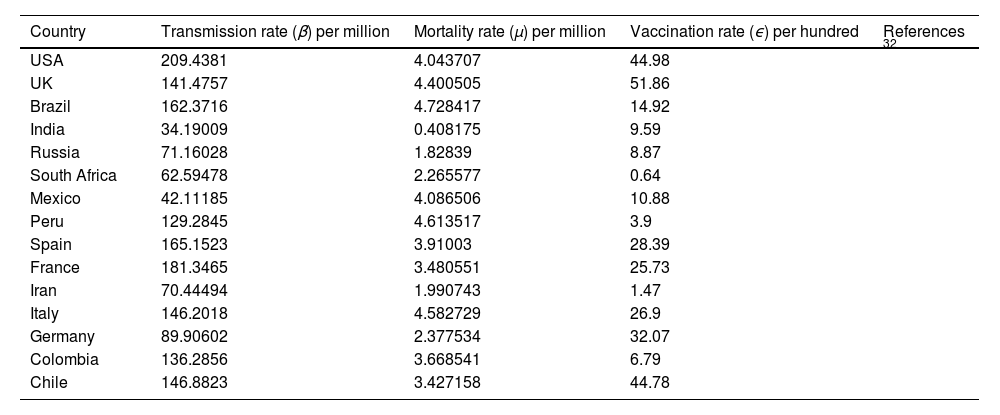
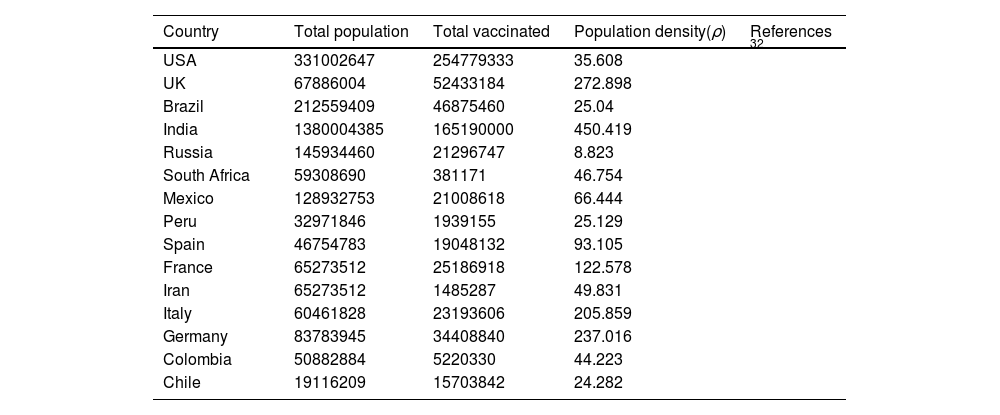
Numerical Simulations and ResultsTo illustrate the theoretical results, numerical simulations are carried out. We use the RK-45 numerical method to simulate the proposed model, dose-response relation, and critical vaccination number that are available in MATLAB. Due to the pandemic situation, compiling the value of the corresponding parameters are difficult. So, we have used the partial data in analyzing the times series; however, analysis based on the long time intervals may be too accurate. In this study, we used secondary data that is already available in the open data source GitHub and re-use of this data needs no ethical clearance. The parameter values used in the simulations are summarized in Tables 1-4. The mean transmission and mortality rate of the COVID-19 pandemic of several countries from the first reported date to 30 May 2021 are mentioned in Table 1. Whenever parameter values were not available in the literature, we assume realistic values for the purpose of illustration. Other values of the parameters that are used in the simulations are listed in Table 2. Efficiencies of different vaccines are summarized in Table 3. We thus fit the control reproduction number (Eq. 22), the dose-response relationship (Eqs.23-25), and critical vaccination coverage (Eq. 26) for different values of parameters to understand the evolution of vaccination throughout the pandemic. The data is fitted over non-intersecting parameter space to understand the change in the value of the parameters.
Average transmission rate (β) death rate (μ)and vaccination rate (ϵ) of COVID-19 per day till May 7, 2021of several countries.
| Country | Transmission rate (β) per million | Mortality rate (μ) per million | Vaccination rate (ϵ) per hundred | References |
|---|---|---|---|---|
| USA | 209.4381 | 4.043707 | 44.98 | 32 |
| UK | 141.4757 | 4.400505 | 51.86 | |
| Brazil | 162.3716 | 4.728417 | 14.92 | |
| India | 34.19009 | 0.408175 | 9.59 | |
| Russia | 71.16028 | 1.82839 | 8.87 | |
| South Africa | 62.59478 | 2.265577 | 0.64 | |
| Mexico | 42.11185 | 4.086506 | 10.88 | |
| Peru | 129.2845 | 4.613517 | 3.9 | |
| Spain | 165.1523 | 3.91003 | 28.39 | |
| France | 181.3465 | 3.480551 | 25.73 | |
| Iran | 70.44494 | 1.990743 | 1.47 | |
| Italy | 146.2018 | 4.582729 | 26.9 | |
| Germany | 89.90602 | 2.377534 | 32.07 | |
| Colombia | 136.2856 | 3.668541 | 6.79 | |
| Chile | 146.8823 | 3.427158 | 44.78 |
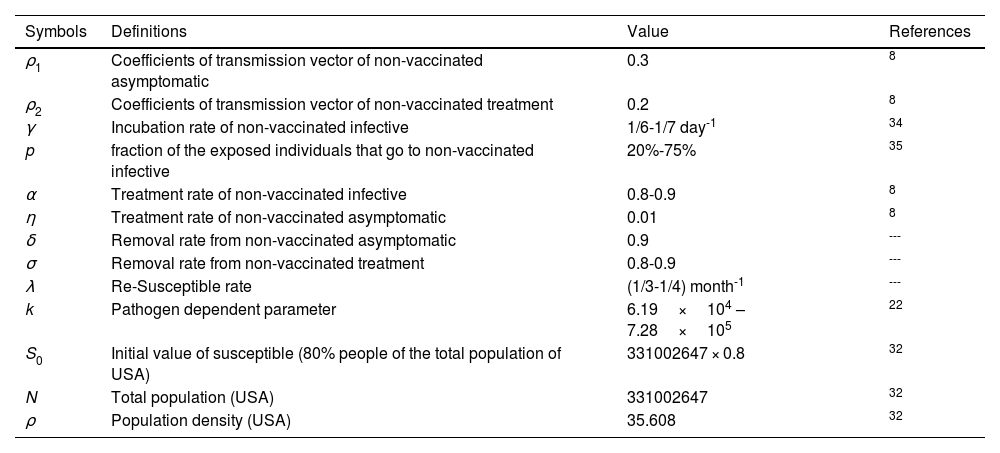
Definitions and under suitable selection of the model parameters.
| Symbols | Definitions | Value | References |
|---|---|---|---|
| ρ1 | Coefficients of transmission vector of non-vaccinated asymptomatic | 0.3 | 8 |
| ρ2 | Coefficients of transmission vector of non-vaccinated treatment | 0.2 | 8 |
| γ | Incubation rate of non-vaccinated infective | 1/6-1/7 day-1 | 34 |
| p | fraction of the exposed individuals that go to non-vaccinated infective | 20%-75% | 35 |
| α | Treatment rate of non-vaccinated infective | 0.8-0.9 | 8 |
| η | Treatment rate of non-vaccinated asymptomatic | 0.01 | 8 |
| δ | Removal rate from non-vaccinated asymptomatic | 0.9 | --- |
| σ | Removal rate from non-vaccinated treatment | 0.8-0.9 | --- |
| λ | Re-Susceptible rate | (1/3-1/4) month-1 | --- |
| k | Pathogen dependent parameter | 6.19×10⁴ – 7.28×10⁵ | 22 |
| S0 | Initial value of susceptible (80% people of the total population of USA) | 331002647 × 0.8 | 32 |
| N | Total population (USA) | 331002647 | 32 |
| ρ | Population density (USA) | 35.608 | 32 |
Total population, total vaccinated and population density till May 7, 2021.
| Country | Total population | Total vaccinated | Population density(ρ) | References |
|---|---|---|---|---|
| USA | 331002647 | 254779333 | 35.608 | 32 |
| UK | 67886004 | 52433184 | 272.898 | |
| Brazil | 212559409 | 46875460 | 25.04 | |
| India | 1380004385 | 165190000 | 450.419 | |
| Russia | 145934460 | 21296747 | 8.823 | |
| South Africa | 59308690 | 381171 | 46.754 | |
| Mexico | 128932753 | 21008618 | 66.444 | |
| Peru | 32971846 | 1939155 | 25.129 | |
| Spain | 46754783 | 19048132 | 93.105 | |
| France | 65273512 | 25186918 | 122.578 | |
| Iran | 65273512 | 1485287 | 49.831 | |
| Italy | 60461828 | 23193606 | 205.859 | |
| Germany | 83783945 | 34408840 | 237.016 | |
| Colombia | 50882884 | 5220330 | 44.223 | |
| Chile | 19116209 | 15703842 | 24.282 |
The present study of COVID-19 is developed mainly based on reports and do not follow to the general principles of experimental plans. Such collected data suffers from many limitations when used to derive scientific conclusions. These include confusing factors, unequal efficiencies, measurement errors, bias selection effects, poor judgement and each of these elements represents a source of uncertainty. Other important limitations are the human activities and other environmental factors.
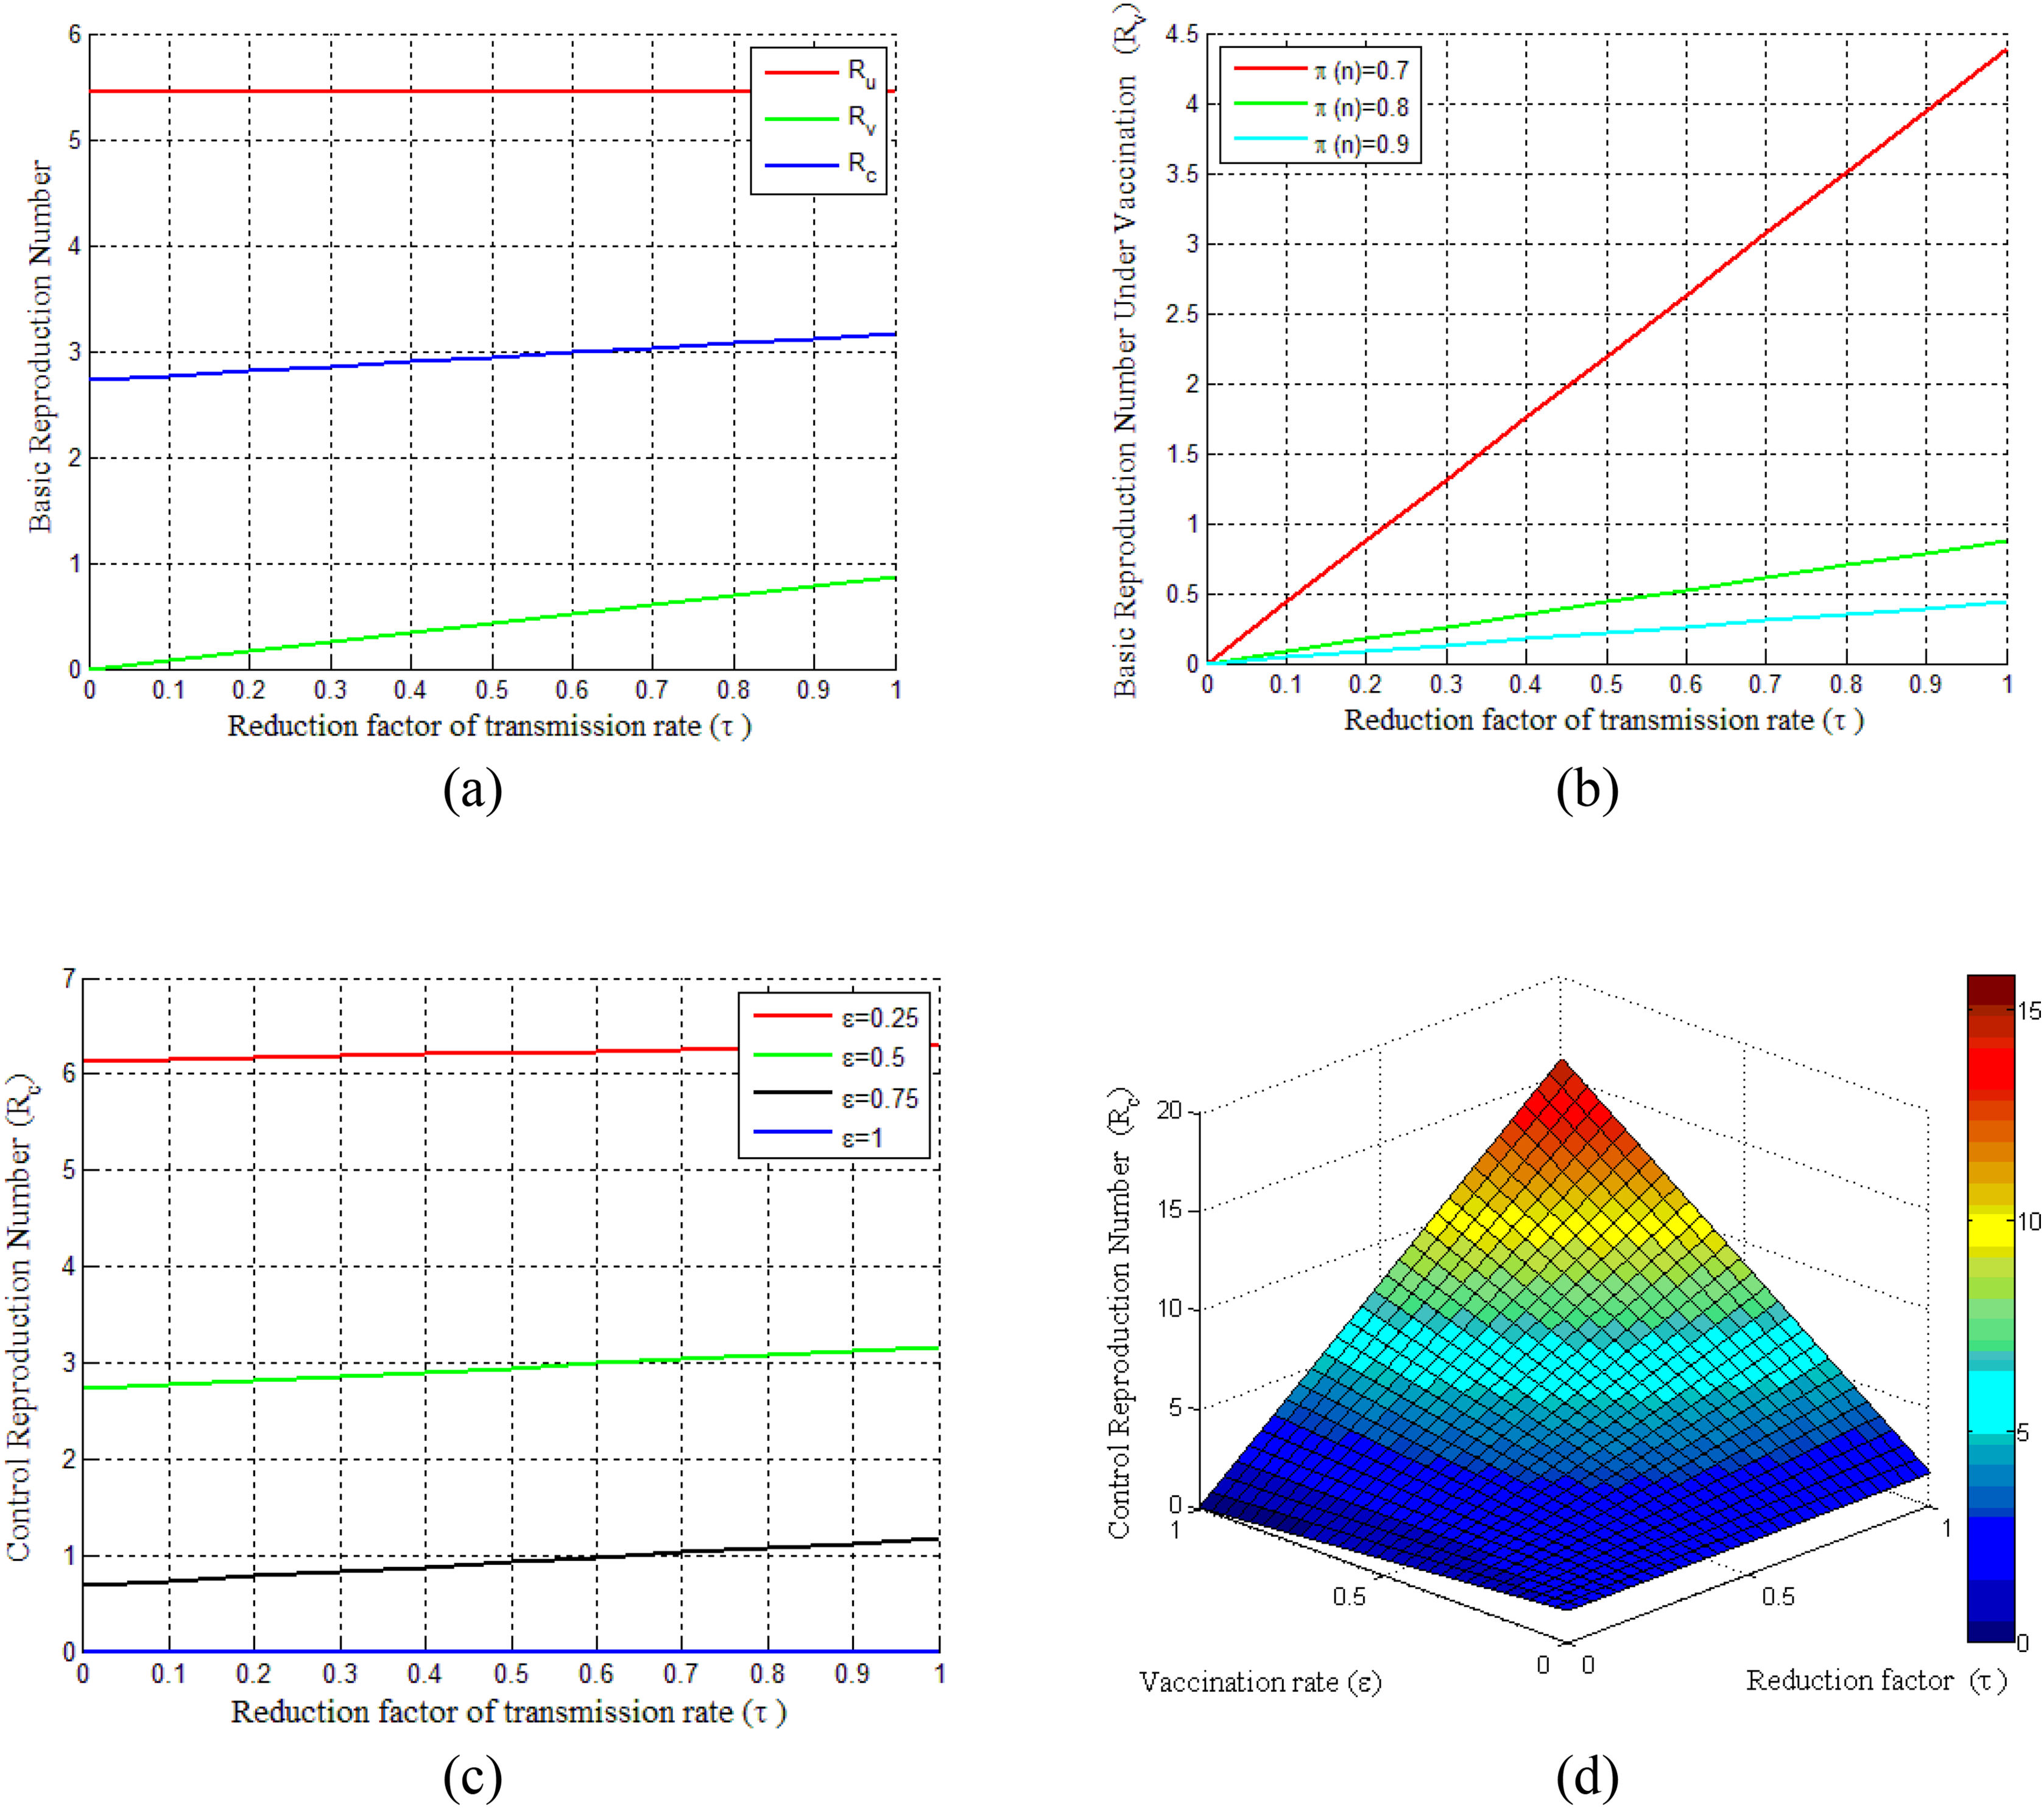
Basic reproduction numberBasic reproduction numbers under vaccination and non-vaccination and control reproduction numbers are plotted in Fig. 2. The control reproduction numberRc is composited of basic reproduction number under the non-vaccinated individualsRu and vaccinated individualsRv. It can be seen from Fig. 2(a) that control reproduction number Rcand basic reproduction number under vaccination Rv are both less than the reproduction number under non-vaccinated individualsRu. Besides, both Rc and Rv are seen to be increased with the increasing of vaccination rate τ (where 0 ≤ τ ≤ 1). However, the vaccination efficacy (π(n)) has a vital role on Rv, as shown in Fig. 2(b). This figure demonstrates that Rv decreases with the increase of vaccine efficacy. Fig. 2(c) illustrates that a smaller control reproduction number Rc can be achieved by administering vaccines at a higher rate (ε). Further, this figure shows that when the vaccination rate (ε)is larger than 0.75, the epidemic will die out and the control reproduction number is found to be less than one. The surface in Fig. 2(d) shows the changes of Rc for the reduction factor of the transmission rate (τ) by vaccination and the vaccination rate (ε) under two different cases of dose-response relationships.
 Basic reproduction number under the vaccination and non-vaccination for a different reduction factor of the transmission rate(τ). (b) Vaccinated basic reproduction number versus τ for different vaccine efficiencies. (c) Variation of control reproduction number under different vaccination rates. (d) Surface plot of Rc − ε − τ.")
Illustrates the COVID-19 pandemic dose-response and dynamics. (a) Basic reproduction number under the vaccination and non-vaccination for a different reduction factor of the transmission rate(τ). (b) Vaccinated basic reproduction number versus τ for different vaccine efficiencies. (c) Variation of control reproduction number under different vaccination rates. (d) Surface plot of Rc − ε − τ.
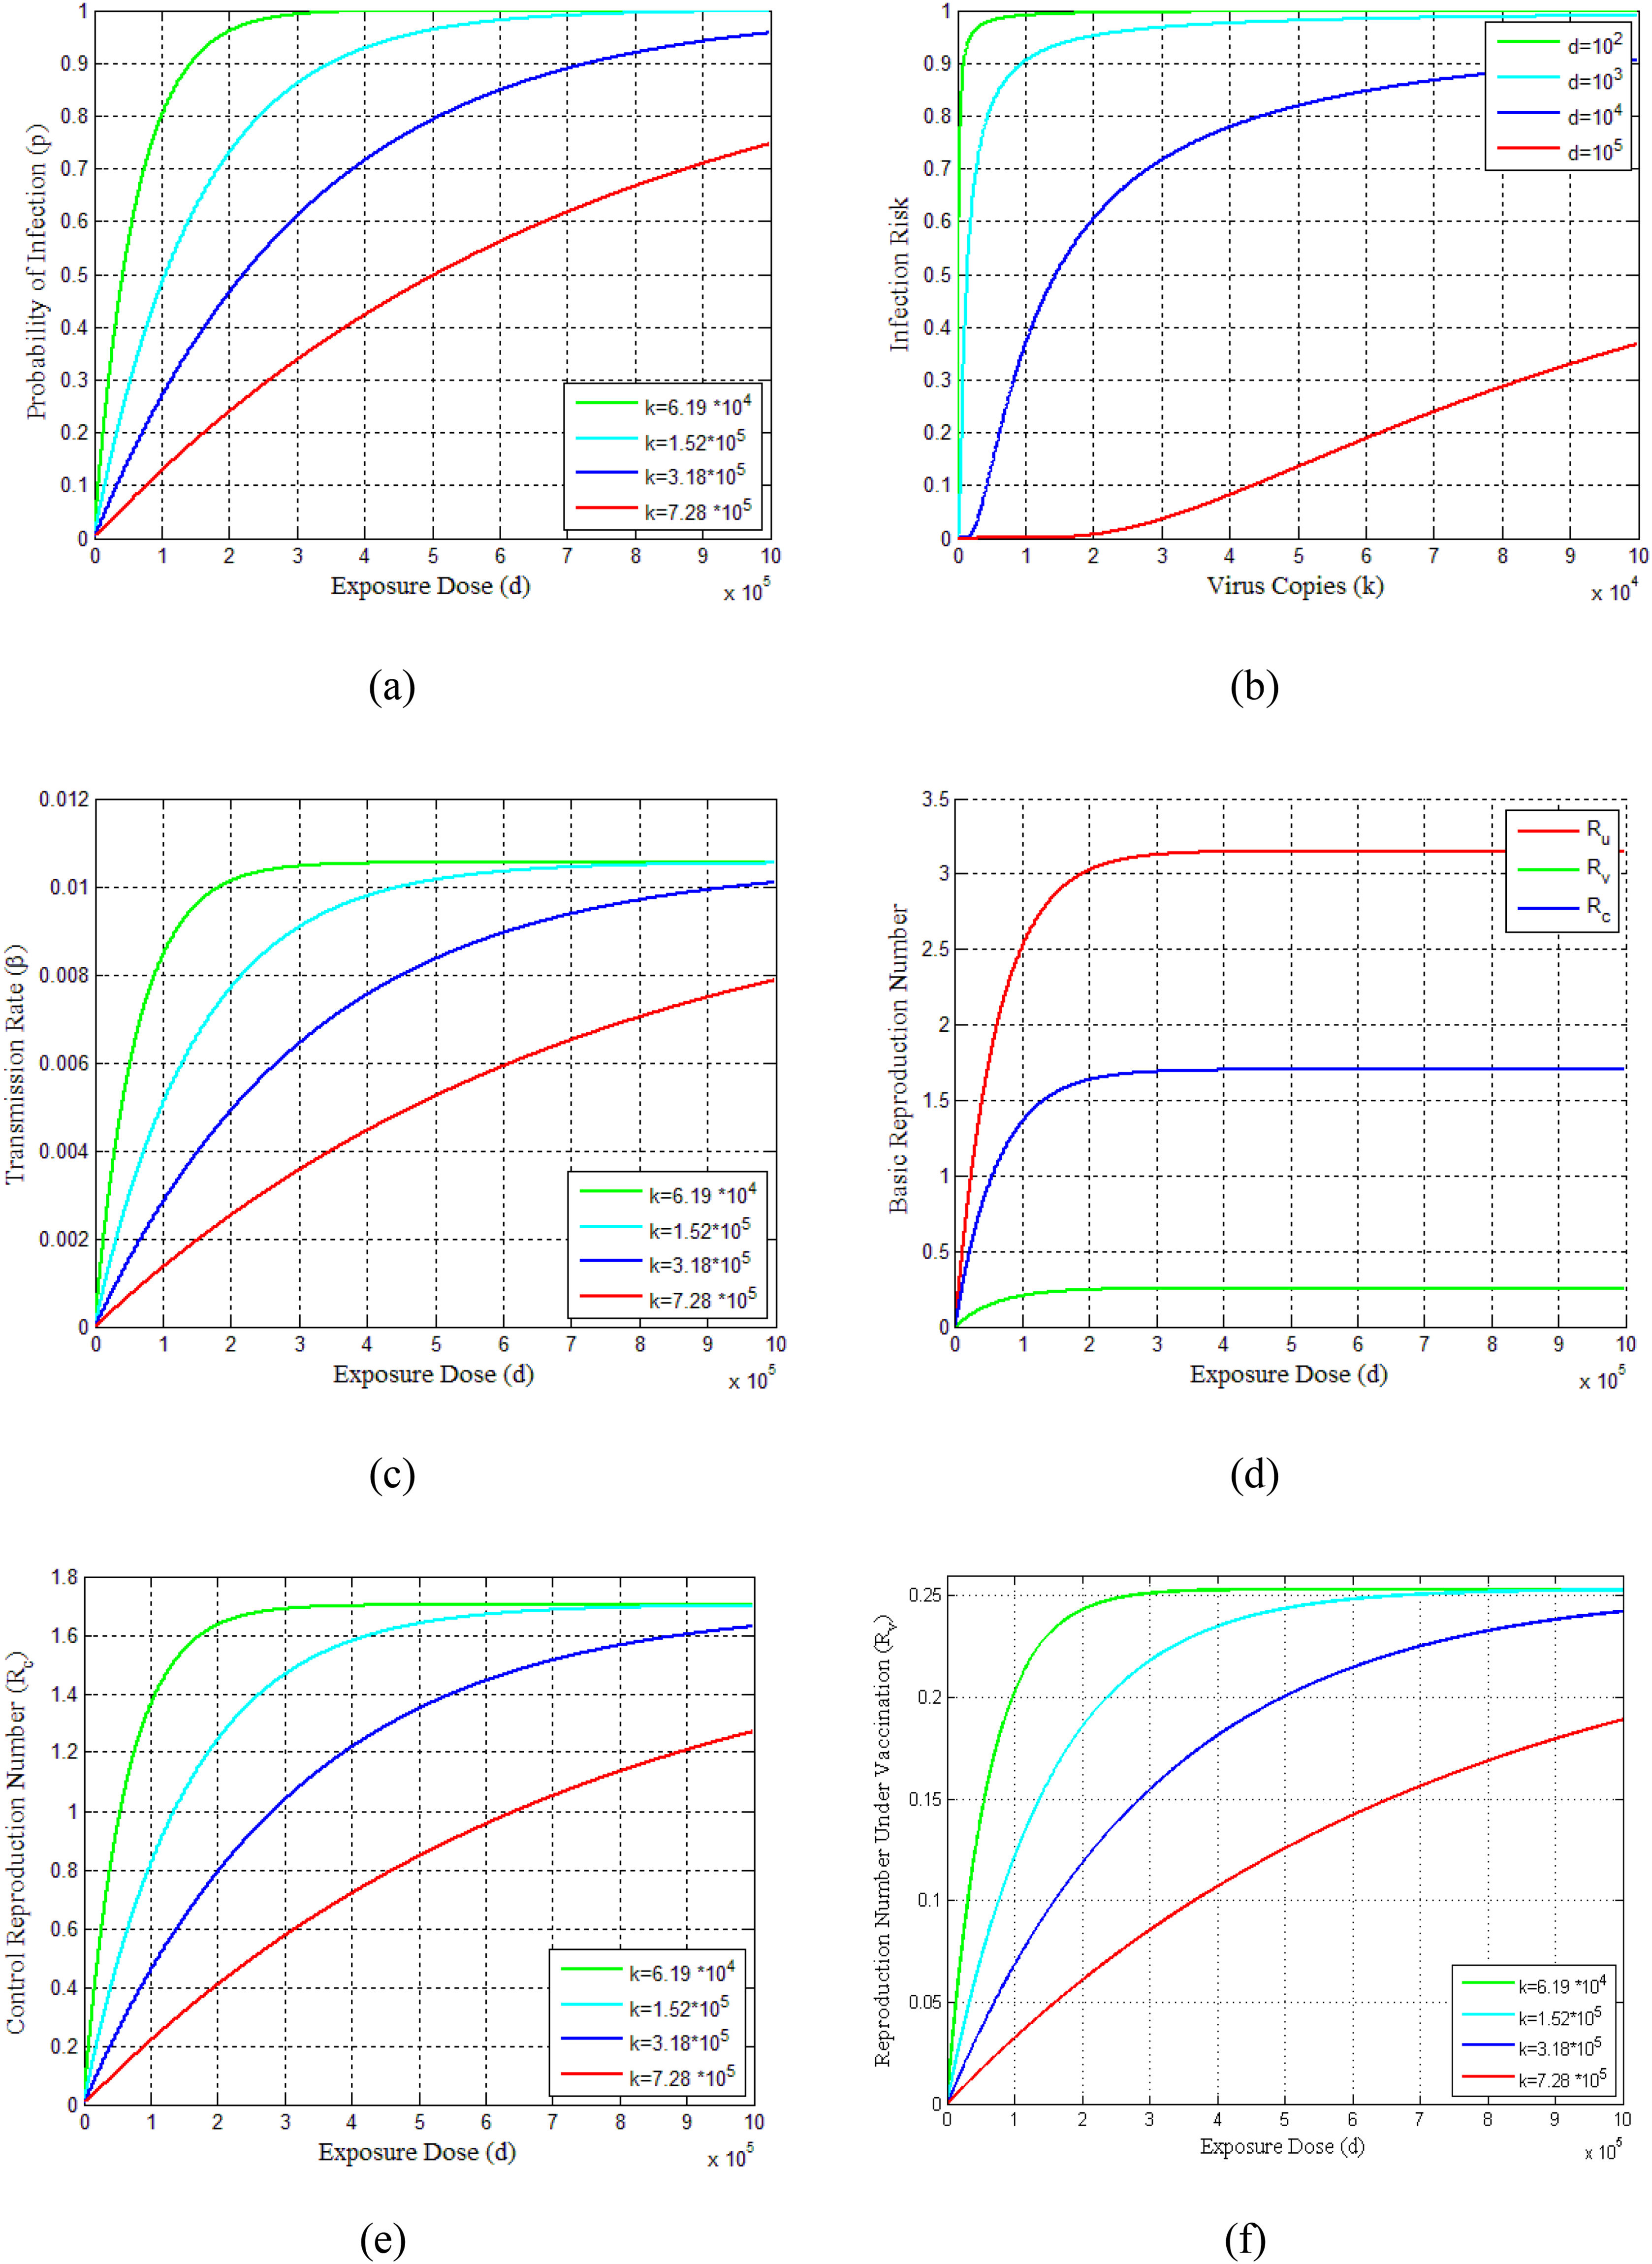
The probability of infections is estimated (Eq. 23-25) for virus copies (k) from 6.19 × 10⁴ to 7.28 × 10⁵dependent on the contribution of the flying virus-laden particles among the exposure dose as shown in Fig. 3(a). This figure indicates that as the exposure dose (d)increases, the probability of infection (p) also increases for various choices of virus copies (k). The infection risks for different exposure doses along with increasing virus copies are shown in Fig. 3(b). It can be seen from this figure that the infection risks are decreasing with the increasing exposure doses. Furthermore, the profiles of the transmission rate (β) versus the exposure dose (d) are presented in Fig. 3(c) for different virus copies (k). Since the exposure dose and virus copies affect the transmission rate and reflective patterns on disease situation, these parameters have also an effect on reproduction numbers Ru,Rv and Rc, as can be seen in Figs. 3(d)-3(f).
 Probability of infection estimates of dose-response functions for COVID-19. (b) Estimated infection risk of infected people under different dose-response relationships. (c) Model results of transmission rate under different dose-response relationships. (d) Estimated basic reproduction numbers (Ru, Rv, Rc) over different exposure doses. (e) Control reproduction number vs exposure dose for different dose responses. (f) Reproduction number under vaccination program.")
Demonstrates the vaccination dose-response relations of COVID-19 pandemic and dynamics. (a) Probability of infection estimates of dose-response functions for COVID-19. (b) Estimated infection risk of infected people under different dose-response relationships. (c) Model results of transmission rate under different dose-response relationships. (d) Estimated basic reproduction numbers (Ru, Rv, Rc) over different exposure doses. (e) Control reproduction number vs exposure dose for different dose responses. (f) Reproduction number under vaccination program.
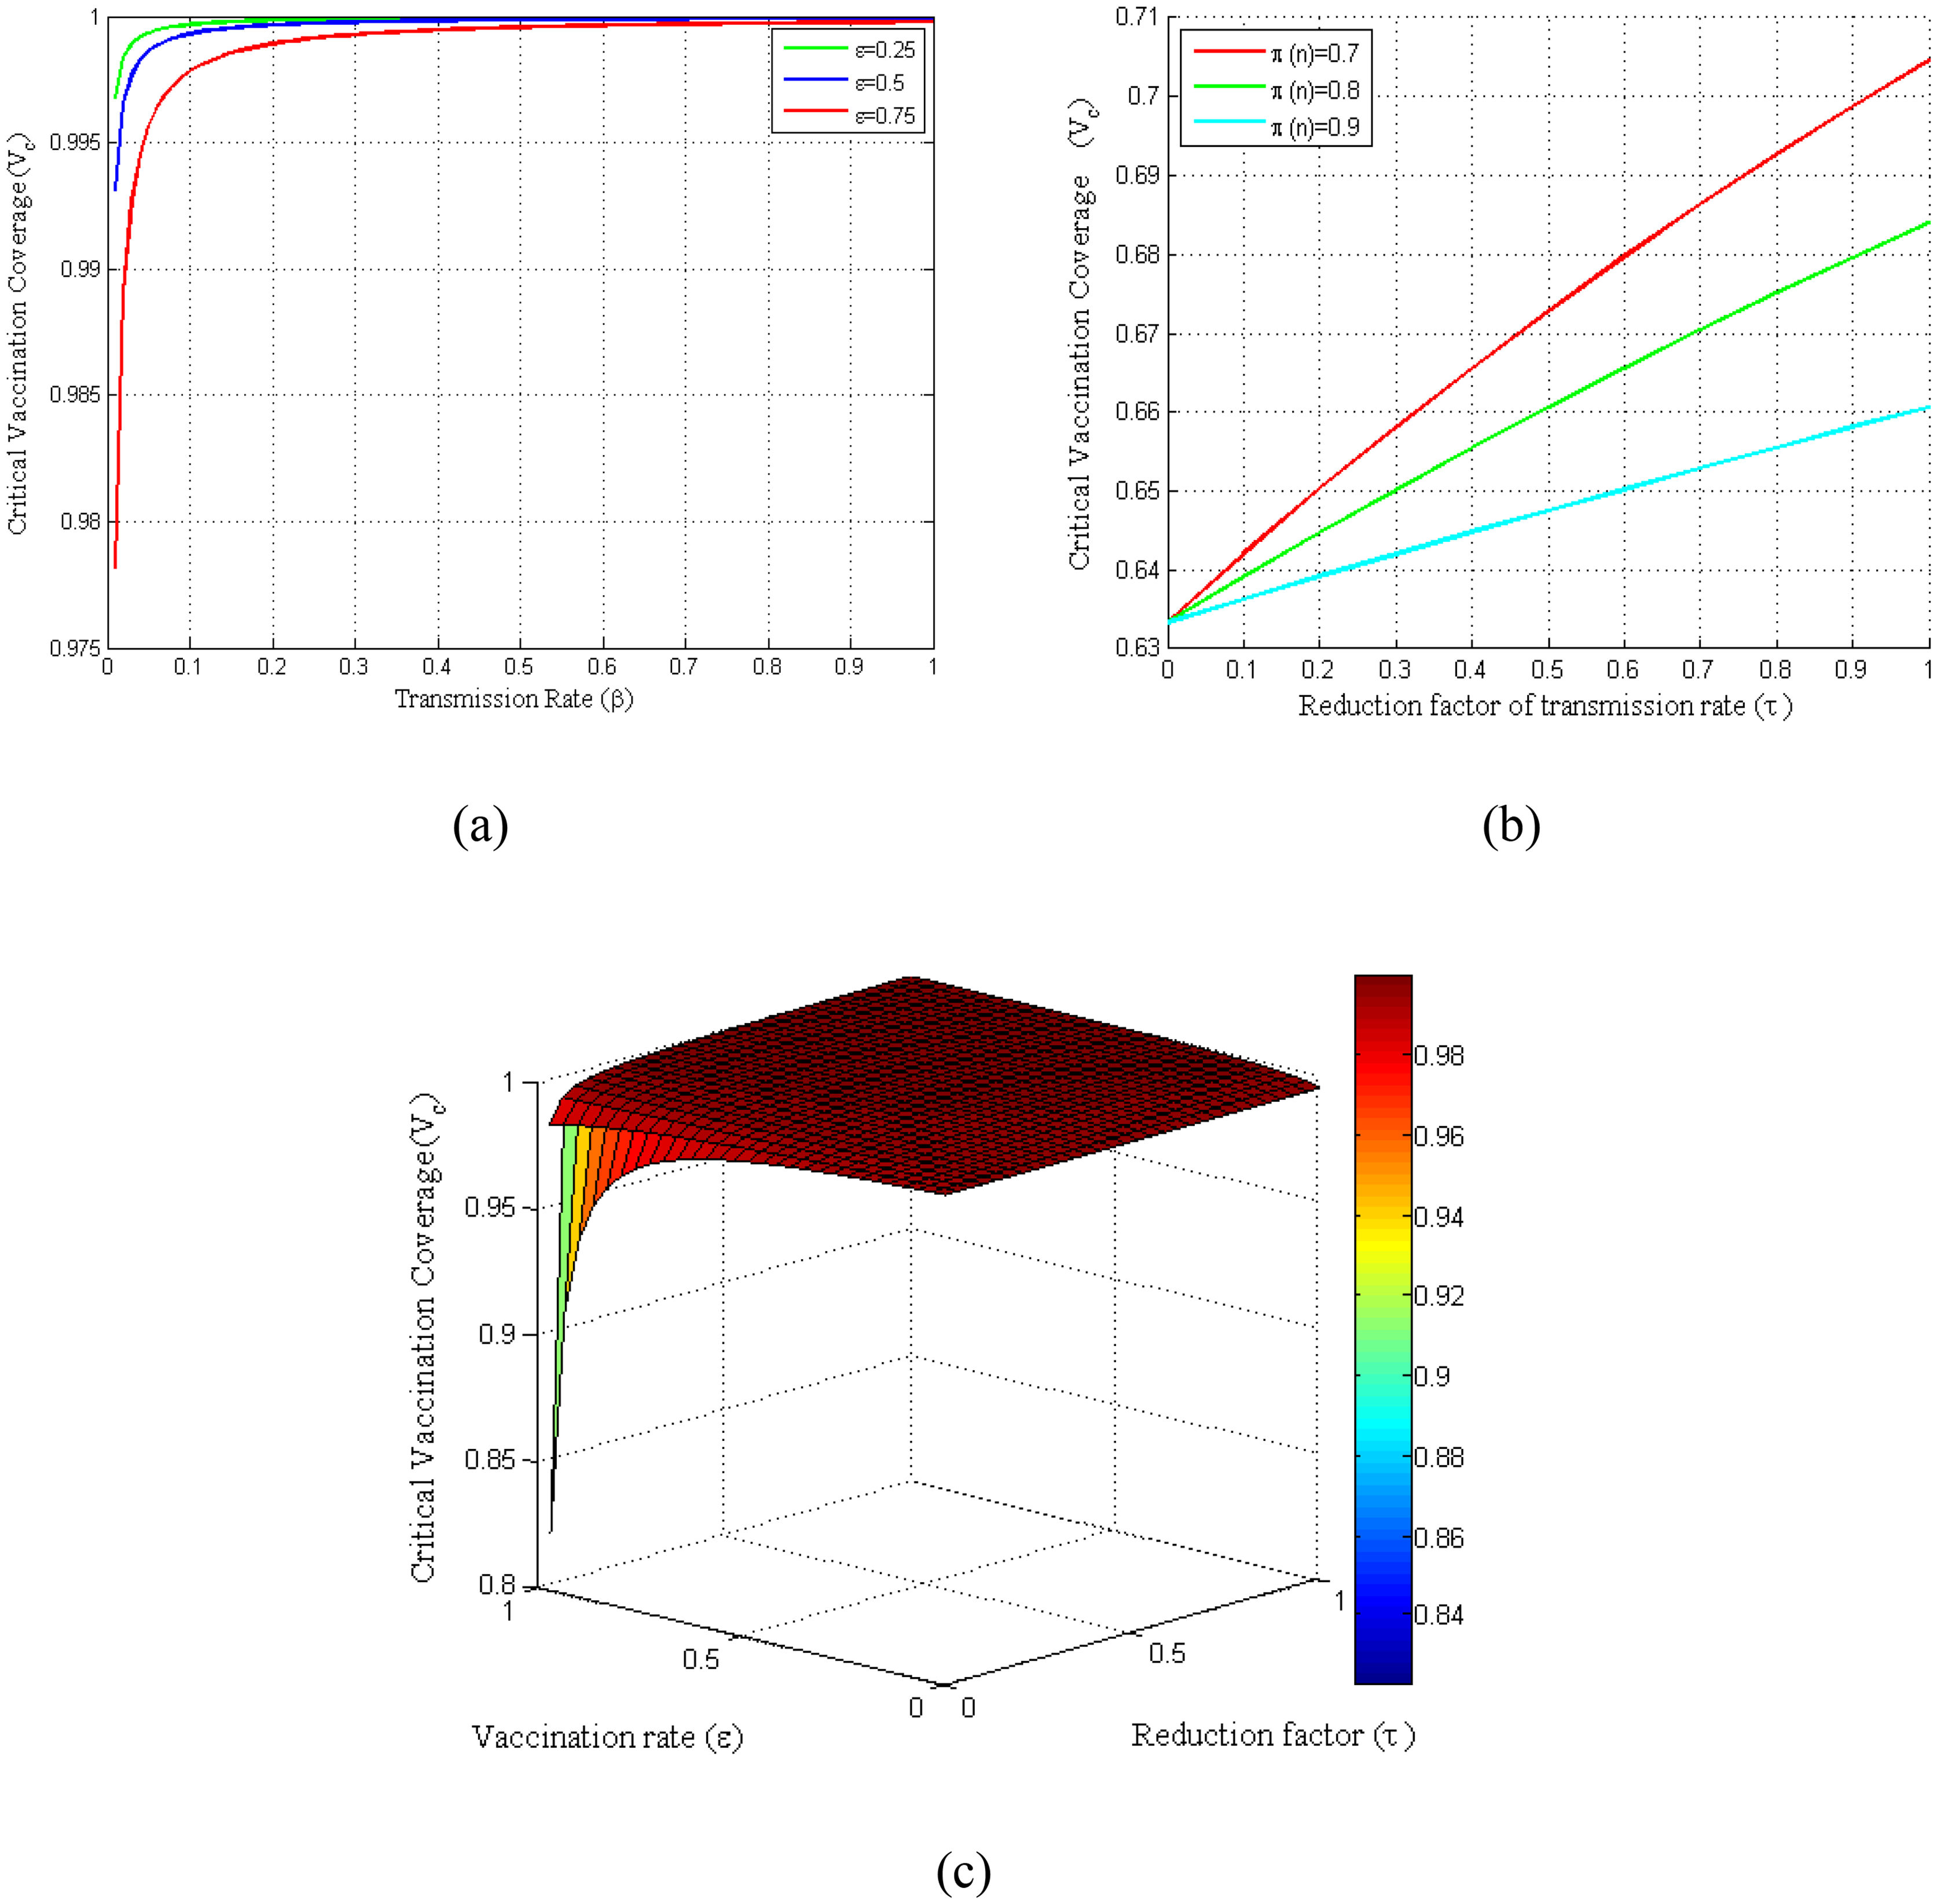
Basic reproduction number has direct impacts on the vaccination coverage as it is computed based on the basic reproduction number. Consequently, the critical vaccination coverage (Vc) depends on the parameters that are included in the control reproduction number (Rc). Fig. 4(a) shows the critical vaccination coverage corresponding to the transmission rate at several vaccine rates, whereas Fig. 4(b) shows the same corresponding to the reduction factor of the transmission rate (τ) at several vaccination efficiencies. Fig. 4(a) demonstrates that the critical vaccination coverage (Vc) demands with an increased transmission rate rise sharply in the beginning, which, however, reaches a threshold shortly and remains almost constant even though the transmission rate increases. In contrast, Fig. 4(b) demonstrates that it increases linearly with an increasing τ. Finally, to observe the dependency of Vc on both τ and ε at once, we have presented a surface plot taking the relationship of Vc with τ and ε into account (see Fig. 4(c)).
 Profiles of critical vaccination coverage against β in the range of 0 ≤ β ≤ 1 for different values of ε. (b) Critical vaccination coverage versus τ in the range of0 ≤ τ ≤ 1 for different values of π. (c) Surface plot of critical vaccination coverage for Vc − ε − τ.")
Variation of critical vaccination coverage for different parameters β, ε, π, τ. (a) Profiles of critical vaccination coverage against β in the range of 0 ≤ β ≤ 1 for different values of ε. (b) Critical vaccination coverage versus τ in the range of0 ≤ τ ≤ 1 for different values of π. (c) Surface plot of critical vaccination coverage for Vc − ε − τ.
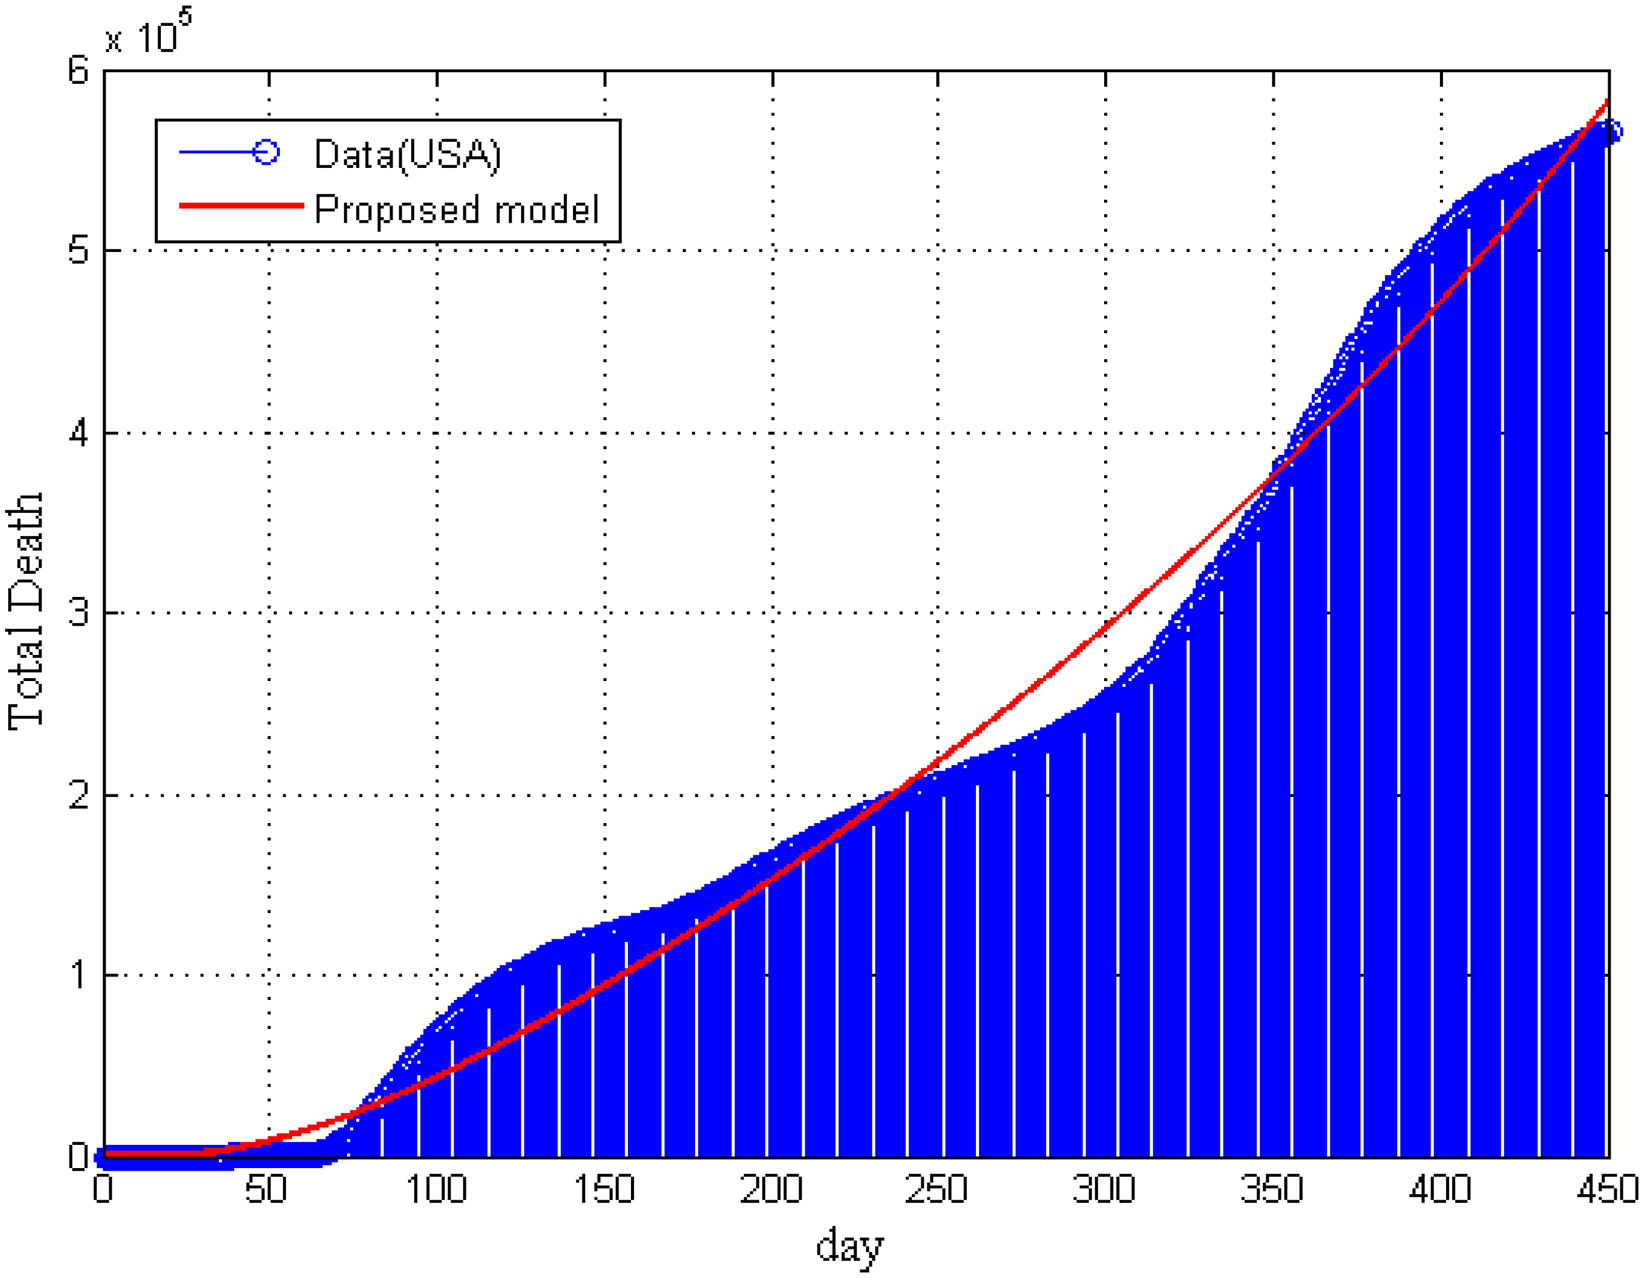
Furthermore, in Fig. 5, we have compared our model result with the real data of total deaths due to COVID-19 in the United States. It is seen that model’ result is supported by the collected data. In Fig. 5, we can not present the statistical data of total death for vaccinated and non-vaccinated compartment separately.
Conclusions
Due to a lack of a well-justified research design of COVID-19, we developed a modified SEIATR model8,33 based on a well-defined SEIR compartmental model to investigate the pandemic’s transmission dynamics, the vaccine’s efficacy, and antiviral treatment. We applied the RK-45 method for solving the model’s equations and verified these results by the statistical data. We provided the statistical data in the public repository GitHub32 with their sources for analyzing and simulating the model. It was observed that the probability of infection for different dose-response increased as the competency of transmission of various copies matched simultaneously with the SARS and MARS22. Furthermore, we also found that the infection risk decreased with an increasing exposure dose. In addition, we investigated the critical vaccination coverage demands corresponding to an increased transmission rate and reduction factor of the transmission rate. Furthermore, the results narrated that the critical vaccination coverage demands corresponding to an increased transmission rate raised sharply initially and then reached a threshold. In contrast, the critical vaccination coverage demands increased linearly with the increase of the reduction factor of the transmission rate for a certain vaccine efficiency rate. On the other hand, it was noted that if the vaccine efficacy was low and the disease transmission rate was high, the disease might not be eradicated. Similar results were derived by Diagne et al.16 The data for COVID-19 vaccinations were published quickly, confirming that most statistical and computational tools cannot correctly overcome the poor quality of acquired data. The primary evidence for this observation came from the poor reproducibility of results. This study is not exhaustive and future research could investigate the dynamics of COVID-19 on diabetic patients.
Funding informationThis research did not receive any specific grant from funding agencies in the public, commercial, or not-for-profit sectors.
Authors’ contributionsA. Malek designed the concept and methodology of this research work. In addition, he conducted the formal analysis and wrote the original draft of the manuscript. A. Haque supervised this research work. He also took part in the formal analysis, revising, and editing of the manuscript.
Declaration of interestThe authors declare no conflicts of interest. All the authors have equally agreed to publish the final version of the manuscript.