


Long follow-up studies show that the 10-year regrowth rate for grade I (benign) and II (atypical) meningiomas rises up to 15–25% and 30–35%, respectively, despite aggressive surgery. We investigated completely removed meningiomas grade I and II (n=135) to identify and compare prognostic markers for tumour recurrence. We determined the immunohistochemical expression of 30 biomarkers, cell death assay by in situ hybridisation (ApopDETEKTM) and loss of chromosome 1p36 by FISH. The univariate statistical analysis showed that WHO grade, high cellularity, nuclear atypia, loss of 1p36 (determined in 20 out of 107 valid cases), expression of COX-2 (9 positive cases and 126 negative cases), Cyclin A, Topoisomerase IIα and MIB1/ki67 were associated with recurrence-free survival. The multivariate linkage analysis for the prognostic variables revealed that only 1p36 loss, expression of COX-2 and MIB1 were independent factors for predicting meningioma recurrence. The statistical analysis of COX-2 and 1p36 loss co-variation showed an antagonistic effect for both prognostic markers. Meningiomas with 1p36 loss showed significant increase of necrosis, nuclear atypia and increased expression of Cyclin E, PAKT, PDGF and p21. COX-2 overexpression was associated with increased VEGF, PDGF, HER2 and MDM2 expression. COX-2 inhibitors may be used as a putative chemopreventive treatment for meningioma recurrence in tumours with COX-2 over-expression.
Diversos estudios con un largo periodo de seguimiento muestran que la tasa de recidiva para los meningiomas grado I (benignos) y II (atípicos) se sitúa entre el 15-25% y el 30-35% respectivamente, a pesar de una cirugía agresiva. Hemos investigado 135 meningiomas completamente resecados para identificar y comparar marcadores pronósticos de recurrencia tumoral. Hemos determinado la expresión inmunohistoquímica de 30 biomarcadores, la muerte celular por apoptosis mediante un ensayo de hibridación in situ (ApopDETEKTM) y las perdidas en el cromosoma 1p36 mediante FISH. El análisis estadístico univariante mostró que el grado tumoral de la OMS, la alta celularidad, la atipia nuclear, las pérdidas en el cromosoma 1p36 (determinadas en 20 de los 107 casos válidos) y la expresión de COX-2 (9 casos positivos y 126 negativos), Ciclina A, Topoisomerasa IIα y MIB1/Ki67 se asociaron con el periodo libre de recurrencia. El análisis multivariante de estas variables pronósticas reveló que solamente las pérdidas en el cromosoma 1p36 y la expresión de COX-2 y MIB1 eran factores independientes para la predicción de recidiva tumoral. El análisis estadístico para la covariación de COX-2 y las perdidas en 1p36 mostraron un efecto antagonista para ambos marcadores. Los meningiomas con pérdidas en 1p36 mostraron un incremento significativo de la necrosis, la atipia nuclear y la expresión de Ciclina E, PAKT, PDGF y p21. La sobreexpresión de COX-2 se asocia a su vez con un aumento de la expresión de VEGF, PDGF, HER2 y MDM2. Los inhibidores selectivos de COX-2 podrían ser usados como un tratamiento quimiopreventivo putativo para evitar la recurrencia en aquellos meningiomas con sobreexpresión de COX-2.
Meningiomas are usually classified by the revised WHO grading scheme into grade I (benign), grade II (atypical) and grade III (anaplastic or malignant).1 This histopathological based grading system has proved useful in predicting prognosis and in defining treatment regimens for meningiomas. Long follow-up studies demonstrate that the 10-year regrowth rate for grade I and II meningiomas rises up to 15–25% and 30–35%, respectively.1–5 Immunohistochemical or molecular biomarkers may provide a different insight from the WHO grading scheme and play an additional role to predict the likelihood of tumour recurrence for both meningiomas grade I and II.4–6
Clinical variables associated with a higher rate of tumour recurrence are age <40 years, male gender and unfavourable tumour location.5 Numerous efforts have been made for the identification of prognostic markers by immunohistochemical assays.7–14 The evaluation of Ki-67/MIB-1 labelling index, VEGF, p53, PTEN, p16 protein accumulation or progesterone receptors among others has been proposed as prognostic indicators but its association with tumour grade or clinical outcome is still controversial.10–14 We have shown in a previous study that the expression of COX-2, γ-Catenin, Topoisomerase IIα, VEGF and MIB-1 was significantly higher in recurrent meningiomas.15 The purpose of this study is to redefine and investigate further the prognostic significance of the expression of these immunohistochemical markers and deletions of 1p36 in tumour recurrence. To do this we completed the data we presented in a previous study with a univariate and multivariate statistical analysis in a cohort of patients with completely resected meningiomas (Simpson grades 1–3). In this way, the more detailed statistical analysis of the association between different biomarkers may unravel underlying molecular mechanisms driving meningioma tumorigenesis and thus indicate potentially useful molecular targets for individualised and more effective tumour treatment.
Material and methodsSelection of casesOur study was planned as a retrospective observational cohort study. We reviewed two hundred and forty-seven consecutive intracranial meningioma grade I (benign) and II (atypical) cases obtained from the Hospital Clinico San Carlos files (from 1980 to 2005), Madrid, Spain. The study has been approved by the Hospital ethic committee. Patients with multiple meningiomas (n=5), cases with adjuvant therapy (n=2), Simpson grade of surgical resection higher than three (n=19) or insufficient data for the Simpson grading scale (n=60), and patients with other tumours occurring during the follow-up period (n=8) or lost of follow-up were not included (n=18). Finally, 135 completely removed intracranial meningioma cases were included in the study. Histopathological specimens were evaluated independently by two pathologists (JR and AM) according to the current WHO criteria.
Clinical parameters included in our study were: gender, age, tumour recurrence recorded as either present or absent, primary tumour site (two categories: cerebral convexity and other location), Simpson grade of surgical resection (I–III), tumour size and clinical follow-up (recurrence-free survival and overall survival). Date of tumour relapse or last contact was evaluated as the end of the study. The time of relapse was determined as the date at which tumour progression or recurrence was confirmed by Computerised Tomography (CT) or Magnetic Resonance Imaging (MRI).
The histopathological parameters were: histopathological subtype, WHO grading system (grade I and II) and the presence or absence of haemorrhage, psammoma bodies, necrosis, nuclear atypia, macronucleoli, cellular pleomorphism, transition to small cell, sheet-like growth, high cellularity or brain invasion. Increased mitotic activity was recorded when 4 or more mitosis per 10 high-power fields were detected.
Tissue microarrays constructionTissue microarrays (TMA)16–18 were constructed from formalin-fixed, paraffin-embedded tissue blocks using a manual tissue arrayer (Beecham Instrument, Hackensack, USA). An H&E stained section from each donor block was examined and the areas of interest were identified and marked. We constructed four TMA that contained two 1mm cores representative of each case.
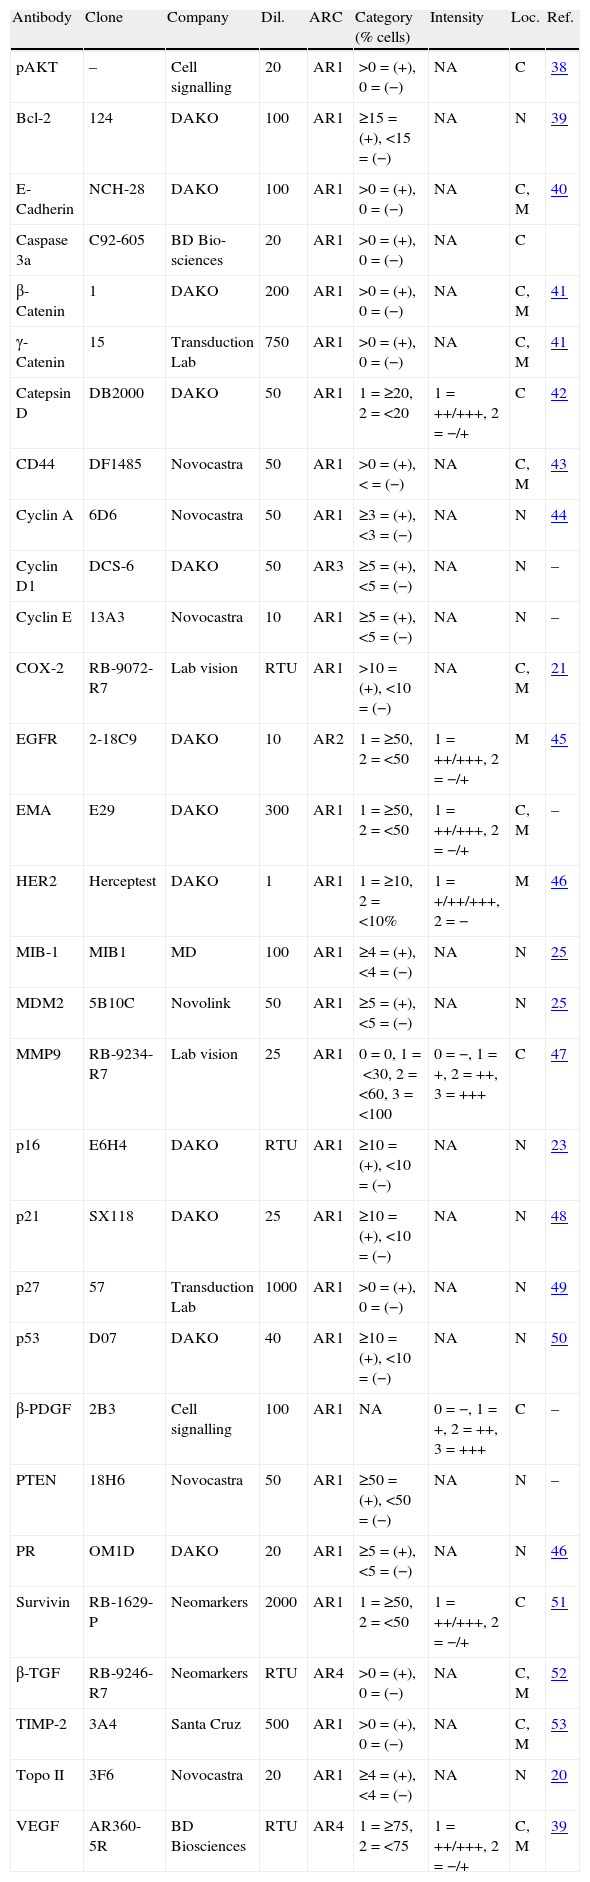
Immunohistochemical staining of tumoursAll immunohistochemical sections were stained with a Dako Autostainer (Glostrup, Denmark) utilising standard immunohistochemical techniques. Serial sections of 4μm were deparaffinised and rehydrated. We tested for these markers: pAKT,19 Bcl-2, E-Cadherin, Caspase 3α, β-Catenin, γ-Catenin, Catepsin D, CD44, Cyclin A, Cyclin D, Cyclin E, COX-2, EGFR, EMA, HER2, MIB-1, MDM2, MMP9, p16, p21, p27, p53, β-PDGF, PTEN, PR, Survivin, β-TGF, TIMP-2, Topo II and VEGF. Table 1 summarises the antibodies (n=30), dilutions and antigen retrieval methods that we used. After peroxidase blocking, sections were incubated with primary antibody for 30min at room temperature, washed and incubated with secondary antibody. Finally, sections were incubated with DAB (3,3 diaminobenzidine substrate) for 5min, counterstained with haematoxylin, dehydrated and coverslipped.
Antibodies, dilutions and antigen retrieval condition.
| Antibody | Clone | Company | Dil. | ARC | Category (% cells) | Intensity | Loc. | Ref. |
| pAKT | – | Cell signalling | 20 | AR1 | >0=(+), 0=(−) | NA | C | 38 |
| Bcl-2 | 124 | DAKO | 100 | AR1 | ≥15=(+), <15=(−) | NA | N | 39 |
| E-Cadherin | NCH-28 | DAKO | 100 | AR1 | >0=(+), 0=(−) | NA | C, M | 40 |
| Caspase 3a | C92-605 | BD Bio-sciences | 20 | AR1 | >0=(+), 0=(−) | NA | C | |
| β-Catenin | 1 | DAKO | 200 | AR1 | >0=(+), 0=(−) | NA | C, M | 41 |
| γ-Catenin | 15 | Transduction Lab | 750 | AR1 | >0=(+), 0=(−) | NA | C, M | 41 |
| Catepsin D | DB2000 | DAKO | 50 | AR1 | 1=≥20, 2=<20 | 1=++/+++, 2=−/+ | C | 42 |
| CD44 | DF1485 | Novocastra | 50 | AR1 | >0=(+), <=(−) | NA | C, M | 43 |
| Cyclin A | 6D6 | Novocastra | 50 | AR1 | ≥3=(+), <3=(−) | NA | N | 44 |
| Cyclin D1 | DCS-6 | DAKO | 50 | AR3 | ≥5=(+), <5=(−) | NA | N | – |
| Cyclin E | 13A3 | Novocastra | 10 | AR1 | ≥5=(+), <5=(−) | NA | N | – |
| COX-2 | RB-9072-R7 | Lab vision | RTU | AR1 | >10=(+), <10=(−) | NA | C, M | 21 |
| EGFR | 2-18C9 | DAKO | 10 | AR2 | 1=≥50, 2=<50 | 1=++/+++, 2=−/+ | M | 45 |
| EMA | E29 | DAKO | 300 | AR1 | 1=≥50, 2=<50 | 1=++/+++, 2=−/+ | C, M | – |
| HER2 | Herceptest | DAKO | 1 | AR1 | 1=≥10, 2=<10% | 1=+/++/+++, 2=− | M | 46 |
| MIB-1 | MIB1 | MD | 100 | AR1 | ≥4=(+), <4=(−) | NA | N | 25 |
| MDM2 | 5B10C | Novolink | 50 | AR1 | ≥5=(+), <5=(−) | NA | N | 25 |
| MMP9 | RB-9234-R7 | Lab vision | 25 | AR1 | 0=0, 1=<30, 2=<60, 3=<100 | 0=−, 1=+, 2=++, 3=+++ | C | 47 |
| p16 | E6H4 | DAKO | RTU | AR1 | ≥10=(+), <10=(−) | NA | N | 23 |
| p21 | SX118 | DAKO | 25 | AR1 | ≥10=(+), <10=(−) | NA | N | 48 |
| p27 | 57 | Transduction Lab | 1000 | AR1 | >0=(+), 0=(−) | NA | N | 49 |
| p53 | D07 | DAKO | 40 | AR1 | ≥10=(+), <10=(−) | NA | N | 50 |
| β-PDGF | 2B3 | Cell signalling | 100 | AR1 | NA | 0=−, 1=+, 2=++, 3=+++ | C | – |
| PTEN | 18H6 | Novocastra | 50 | AR1 | ≥50=(+), <50=(−) | NA | N | – |
| PR | OM1D | DAKO | 20 | AR1 | ≥5=(+), <5=(−) | NA | N | 46 |
| Survivin | RB-1629-P | Neomarkers | 2000 | AR1 | 1=≥50, 2=<50 | 1=++/+++, 2=−/+ | C | 51 |
| β-TGF | RB-9246-R7 | Neomarkers | RTU | AR4 | >0=(+), 0=(−) | NA | C, M | 52 |
| TIMP-2 | 3A4 | Santa Cruz | 500 | AR1 | >0=(+), 0=(−) | NA | C, M | 53 |
| Topo II | 3F6 | Novocastra | 20 | AR1 | ≥4=(+), <4=(−) | NA | N | 20 |
| VEGF | AR360-5R | BD Biosciences | RTU | AR4 | 1=≥75, 2=<75 | 1=++/+++, 2=−/+ | C, M | 39 |
Final threshold used for the statistical analysis is the sum of percentage and the intensity (% of positive cells/stain intensity/location). References (previous studies with more detailed description of cutoffs and interpretation). ARC antigen-retrieval condition AR1: CB 10mM pH 6.5 15′ Steam; AR2: Peroxide Blk 5′+PK 5′; AR3: CB pH 6.5+PK 10′ 37°; AR4: CB pH 9 45′ BM 95°; CB: citric buffer; PK: proteinase K; Intensity: +=weak, ++=moderate, +++=strong; N: nucleus; C: cytoplasm; M: membrane; Loc.: location; NA: not assessable; Dil.: dilution (1/x); pAKT: pAKT, ser473; MD: master diagnostica.
The immunostaining for each antigen was evaluated independently by two pathologists (JR and JS) using a blind method. The observers had no information about the specimens examined. Standard criteria were used to classify the immunohistochemical findings as positive or negative for each marker (Table 1), using an Olympus BX40 microscope (100× magnification).
FISH analysis of chromosome 1p36 deletionsTest and reference probe mixtures for chromosomes 1 (1p36/1q25) were purchased from Vysis (Des Plaines, IL, USA). The 1p36 probe was 435kb in length and was pre-labelled with an orange fluorophore. The 1q25 reference probe was 618kb in length, pre-labelled with a green fluorophore.
Three-micron sections of TMA were deparaffinised in xylene, rehydrated through an ethanol series, and dried at room temperature. The slides were then heat pretreated at >98°C for 20min. After 20min, the slides were transferred to dH2O and washed twice. The slides were incubated at 37°C in a humidified chamber for 20min and the slides washed in dH2O, then dehydrated through an ethanol series. After air drying at room temperature, the slides were placed on a 37°C warming tray and 2μl of the probe mix was applied. The section and probe mix were then co-denatured at 95°C for 20min, and finally placed in a 37°C humidified chamber overnight. Post hybridisation, the slides were washed for 2min in 0.4M SSC/0.3% NP-40 at 37°C. They were then transferred to 2M SSC/0.1% NP-40 at room temperature for 30s to 1min. The slides were allowed to air dry in the dark before 6μl of 4′-6-diamidino-2-phenylindole (DAPI) counterstain was applied. They were then cover slipped, wrapped in aluminium foil and stored in a −20°C freezer until they were scored.
Sections were examined under a multiple filter Olympus BX50 fluorescence microscope (Olympus Australia Pty Ltd, Mount Waverley, VIC, Australia). Under 1000× oil immersion, two investigators each assessed 20 nuclei at 10 different sites for a total of 200 nuclei. Nuclei were scored for reference to test probe signal ratio. Reference to test probe signal ratio of 2:2, in more than 50% of cells was taken to indicate no deletion. Reference to test probe signal ratio of 2:1 was regarded as indicating deletion. Two or more copies of the sequence being probed with a disproportionate number of reference probe signals (e.g. 3:2 or 4:3) were considered to indicate imbalance. Imbalance ratios may indicate deletion, but, equally, may be due to artefact or nuclear truncation. Such cells were scored but not counted as either deleted or normal.
PCR analysis of LOH at 1p3613 cases of meningioma were selected from the population of study: all the cases that showed 1p36 loss by FISH with matched normal and tumoral tissue (n=8) and control cases with normal chromosome 1 with matched normal and tumoral tissues (n=5). Microdissected procured cells were resuspended in a solution containing 0.1mg/ml proteinase K, and incubated 48h at 55°C. The mixture was boiled for 10min to inactivate proteinase K. 1.5μl of this mixture was used as a template in each PCR-based microsatellite analysis. Matched fibroid or renal cancer cells and normal cells from the same patient were subjected to PCR analysis. Fluorescent labelled primers were obtained from Research Genetics (Huntsville, AL). Oligonucleotide primers flanking microsatellite polymorphisms at D1S226 (Forward primer: GCTAGTCAGGCATGAGCG; Reverse primer: GGTCACTTGACATTCGTGG; PCR product size: 90–106bp), and at D1S199 (Forward primer: GGTGA CAGAGTGAGACCCTG; Reverse primer: CAAAGACCATGTGCTCCGTA; PCR product size: 94–116bp), were used in the study. The fluorescently labelled PCR primers used to amplify microsatellite loci were purchased from Applied Biosystems (ABI; Foster City, CA). The PCR was performed using ABI Prism True Allele PCR Premix. Each 10-μl reaction consisted of 1.5mM MgCl2, 0.5μM of each primer and 0.2 units of Taq polymerase from PE. Amplification was done at 94°C for 5min, followed by 35 cycles of 94°C for 30s, 57°C for 30s, 72°C for 1min. Water blanks were included in each PCR. 1μl of labelled amplified DNA was mixed with 12.5μl of formamide and 0.5μl of Genescan 500 TAMRA. The samples were denatured for 5min at 94°C and then analysed by capillary electrophoresis on the PE Applied Biosystems 310 Genetic Analyser with Genescan 2.1 software. The Genotyper labels the alleles of the normal cells and the corresponding peaks in meningioma tumour tissue. All DNA templates were coded such that investigators were unaware of the pathological data from patients until the analysis was complete. Only primers that demonstrated heterozygosity in normal cell DNA were considered informative. Non-informative cases included those with homozygous alleles in normal tissue and cases in which allelic patterns could not be clearly distinguished by the capillary electrophoretic methods used.
Allelic loss (LOH) was calculated by comparison of the allele ratio of normal cells with the allele ratio in fibroid and tumour cells. The criterion for LOH was at least a 40% reduction of the lesional allele with the subsequent modification of the allele ratio. To assess the reproducibility of the LOH patterns we microdissected different areas from the same tumour section. A consistent pattern was observed in all cases when studies were repeated (data not shown).
Statistical analysisStatistical analysis was performed by using SPSS software, version 15.0 (SPSS Inc., Chicago, IL). Qualitative variables are shown with their frequency distribution and quantitative variables with mean and standard deviation (SD). The distribution of each immunohistochemical or molecular biomarker on several tumour features as histopathological subtype, WHO grade, invasion of CNS, and recurrence was compared either by the chi square χ2 test for categorical variables or using Fisher exact test.
We analysed the correlation between each molecular marker with RFS. Survival analysis was performed according to the Kaplan–Meier method and Breslow test for comparison of curves. The multivariate analysis was used for finding out independent variables. The proportional hazards model with stepwise backward selection to evaluate independent prognostic factors was expressed as hazard ratio and 95% confidence interval. Probability values <0.05 were considered significant.
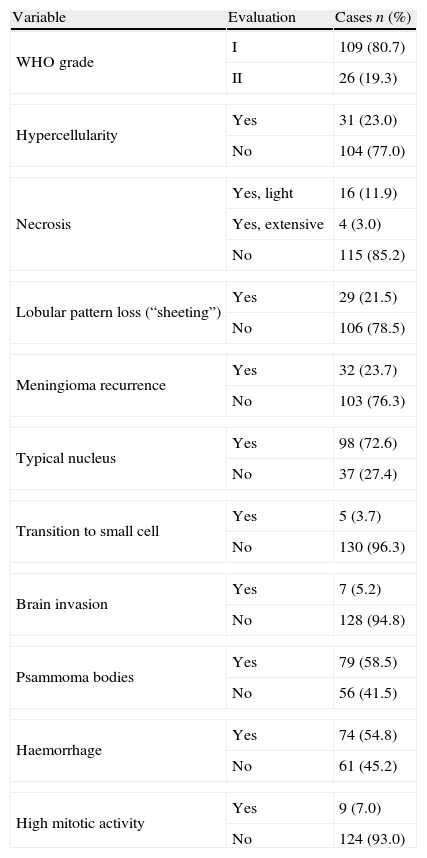
ResultsThe clinical data distribution for the meningiomas included in our series (n=135) showed that meningiomas were more predominant in female patients (69.6%), had a mean age of 58-year-old (range 24–82) and a mean size of 3.2cm (range 2.38–5). The lateral convex (44%) was the most common location, followed by anterior base (18%), parasagittal medial (17%), posterior fosse (12%), spinal region (6.7%), or posterior base (1.5%). Complete surgical resection of meningiomas (Simpson grade 1, 2 and 3) was performed in 92, 34 and 9 cases, respectively. The mean follow-up period in our series was 8 years and 2 months (range 1 year and 6 months to 25 years). Tumour recurrence was found in 32 out of 135 meningiomas (23.7%). Table 2 shows all the histopathological findings in our series. Following the WHO criteria, 109 cases were considered to be grade I and 26 cases were considered to be grade II. No grade III (anaplastic) meningiomas were included in our study. The histopathological subtypes of meningiomas were distributed in our series as follows: Transitional 63 (46.7%), Fibrous 18 (13.3%), Psammomatous 14 (10.4%), Meningotheliomatous 10 (7.1%), Angiomatous 3 (2.2%), Microcystic 3 (2.2%), Secretory 1 (0.7%), Metaplastic 2 (1.5%) and Clear cells 1 (0.7%). There were 26 cases of meningioma that fulfilled the criteria of grade II of the WHO, one of which was the clear cell meningioma, 15 with no particular histological pattern (15.6%) and 5 cases with the histological patterns previously described but with brain invasion.
Histopathological data (n=135).
| Variable | Evaluation | Cases n (%) |
| WHO grade | I | 109 (80.7) |
| II | 26 (19.3) | |
| Hypercellularity | Yes | 31 (23.0) |
| No | 104 (77.0) | |
| Necrosis | Yes, light | 16 (11.9) |
| Yes, extensive | 4 (3.0) | |
| No | 115 (85.2) | |
| Lobular pattern loss (“sheeting”) | Yes | 29 (21.5) |
| No | 106 (78.5) | |
| Meningioma recurrence | Yes | 32 (23.7) |
| No | 103 (76.3) | |
| Typical nucleus | Yes | 98 (72.6) |
| No | 37 (27.4) | |
| Transition to small cell | Yes | 5 (3.7) |
| No | 130 (96.3) | |
| Brain invasion | Yes | 7 (5.2) |
| No | 128 (94.8) | |
| Psammoma bodies | Yes | 79 (58.5) |
| No | 56 (41.5) | |
| Haemorrhage | Yes | 74 (54.8) |
| No | 61 (45.2) | |
| High mitotic activity | Yes | 9 (7.0) |
| No | 124 (93.0) | |
High mitotic activity: 4 or more mitosis per 10 HPF.
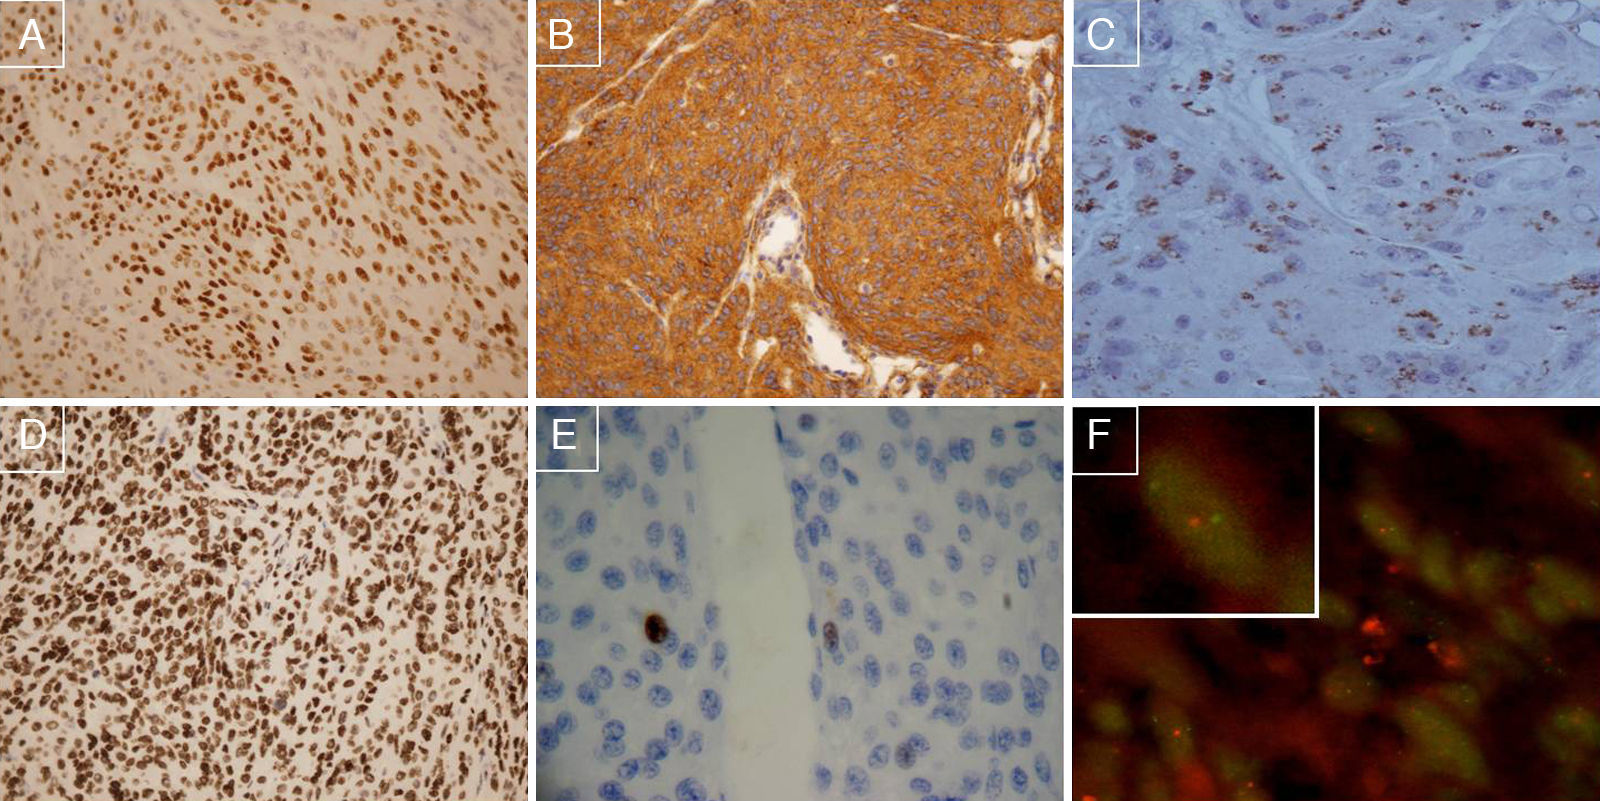
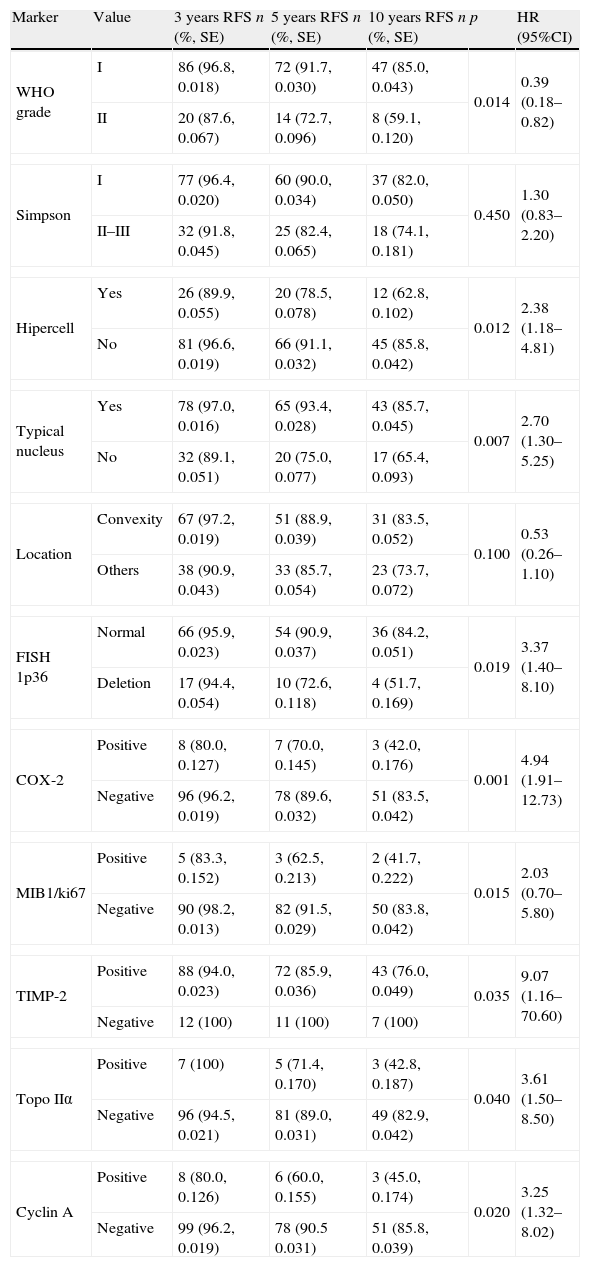
To identify prognostic markers of recurrence-free survival (RFS) for completely removed grade I and II meningiomas, an univariate linkage analysis was first performed on all the clinicopathological variables and molecular biomarkers. We were unable to show any statistically significant associations between the following clinicopathological variables and recurrence-free survival: age at diagnosis, gender, haemorrhage, presence of Psammoma bodies, transition to small cell, “sheeting”, mitosis, necrosis (data not shown), tumour location or Simpson grade of surgical resection (Tables 3a and 3b). The most relevant prognostic indicators were WHO grade II (26 meningiomas were grade II and 109 grade I, p=0.01), hypercellularity (31 out of 135 cases, p=0.015), nuclear atypia (37 out of 135 cases, p=0.007), loss of 1p36 (determined in 20 out of 107 valid cases, p=0.01) and positive expression of COX-2 (9 positive cases and 126 negative cases, p=0.001), Cyclin A (9 out of 130 valid cases, p=0.002), MIB1/ki67 (6 out of 133, p=0.01), Topoisomerase IIα (8 out of 133, p=0.04) or TIMP2 (16 out of 131, p=0.04). The other immunohistochemical markers had no statistical association with RFS. Fig. 1 shows representative cases of meningioma with COX-2 overexpression, positive immunostaining for Progesterone receptor, PDGF positive immunostaining, PTEN positive immunostaining, MIB1 negative immunostaining (threshold: <4% nuclei), and chromosome 1p deletion.
Tumour recurrence accumulated probability for meningiomas grade I and II (n=135) at 3, 5 and 10 years follow-up compared with each molecular marker. Differences between meningiomas grade I and II, Simpson grade of surgical resection I versus II–III as well as the clinical variables and molecular biomarkers that demonstrated a statistical association with recurrence-free survival (RFS).
| Marker | Value | 3 years RFS n (%, SE) | 5 years RFS n (%, SE) | 10 years RFS n (%, SE) | p | HR (95%CI) |
| WHO grade | I | 86 (96.8, 0.018) | 72 (91.7, 0.030) | 47 (85.0, 0.043) | 0.014 | 0.39 (0.18–0.82) |
| II | 20 (87.6, 0.067) | 14 (72.7, 0.096) | 8 (59.1, 0.120) | |||
| Simpson | I | 77 (96.4, 0.020) | 60 (90.0, 0.034) | 37 (82.0, 0.050) | 0.450 | 1.30 (0.83–2.20) |
| II–III | 32 (91.8, 0.045) | 25 (82.4, 0.065) | 18 (74.1, 0.181) | |||
| Hipercell | Yes | 26 (89.9, 0.055) | 20 (78.5, 0.078) | 12 (62.8, 0.102) | 0.012 | 2.38 (1.18–4.81) |
| No | 81 (96.6, 0.019) | 66 (91.1, 0.032) | 45 (85.8, 0.042) | |||
| Typical nucleus | Yes | 78 (97.0, 0.016) | 65 (93.4, 0.028) | 43 (85.7, 0.045) | 0.007 | 2.70 (1.30–5.25) |
| No | 32 (89.1, 0.051) | 20 (75.0, 0.077) | 17 (65.4, 0.093) | |||
| Location | Convexity | 67 (97.2, 0.019) | 51 (88.9, 0.039) | 31 (83.5, 0.052) | 0.100 | 0.53 (0.26–1.10) |
| Others | 38 (90.9, 0.043) | 33 (85.7, 0.054) | 23 (73.7, 0.072) | |||
| FISH 1p36 | Normal | 66 (95.9, 0.023) | 54 (90.9, 0.037) | 36 (84.2, 0.051) | 0.019 | 3.37 (1.40–8.10) |
| Deletion | 17 (94.4, 0.054) | 10 (72.6, 0.118) | 4 (51.7, 0.169) | |||
| COX-2 | Positive | 8 (80.0, 0.127) | 7 (70.0, 0.145) | 3 (42.0, 0.176) | 0.001 | 4.94 (1.91–12.73) |
| Negative | 96 (96.2, 0.019) | 78 (89.6, 0.032) | 51 (83.5, 0.042) | |||
| MIB1/ki67 | Positive | 5 (83.3, 0.152) | 3 (62.5, 0.213) | 2 (41.7, 0.222) | 0.015 | 2.03 (0.70–5.80) |
| Negative | 90 (98.2, 0.013) | 82 (91.5, 0.029) | 50 (83.8, 0.042) | |||
| TIMP-2 | Positive | 88 (94.0, 0.023) | 72 (85.9, 0.036) | 43 (76.0, 0.049) | 0.035 | 9.07 (1.16–70.60) |
| Negative | 12 (100) | 11 (100) | 7 (100) | |||
| Topo IIα | Positive | 7 (100) | 5 (71.4, 0.170) | 3 (42.8, 0.187) | 0.040 | 3.61 (1.50–8.50) |
| Negative | 96 (94.5, 0.021) | 81 (89.0, 0.031) | 49 (82.9, 0.042) | |||
| Cyclin A | Positive | 8 (80.0, 0.126) | 6 (60.0, 0.155) | 3 (45.0, 0.174) | 0.020 | 3.25 (1.32–8.02) |
| Negative | 99 (96.2, 0.019) | 78 (90.5 0.031) | 51 (85.8, 0.039) | |||
SE: standard error; n=cases remaining in the system; p: p-value, Breslow test; HR (95%CI): hazards ratio (95% confidence interval); Topo IIα: topoisomerase IIα; Hipercell: hipercellularity.
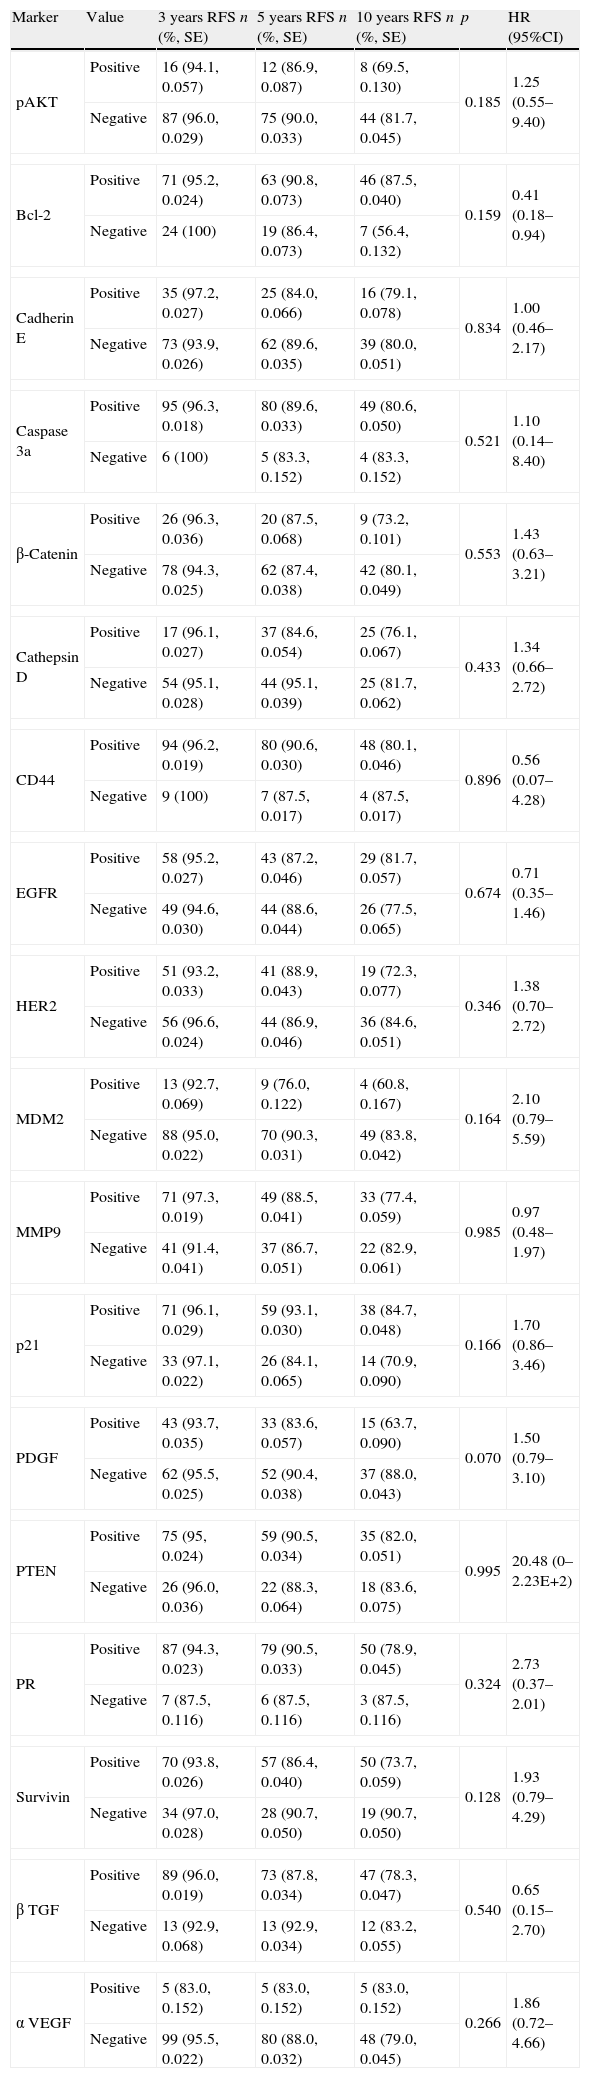
Tumour recurrence accumulated probability for meningiomas grade I and II (n=135) at 3, 5 and 10 years follow-up compared with each molecular marker. Other molecular biomarkers with no RFS statistical association.
| Marker | Value | 3 years RFS n (%, SE) | 5 years RFS n (%, SE) | 10 years RFS n (%, SE) | p | HR (95%CI) |
| pAKT | Positive | 16 (94.1, 0.057) | 12 (86.9, 0.087) | 8 (69.5, 0.130) | 0.185 | 1.25 (0.55–9.40) |
| Negative | 87 (96.0, 0.029) | 75 (90.0, 0.033) | 44 (81.7, 0.045) | |||
| Bcl-2 | Positive | 71 (95.2, 0.024) | 63 (90.8, 0.073) | 46 (87.5, 0.040) | 0.159 | 0.41 (0.18–0.94) |
| Negative | 24 (100) | 19 (86.4, 0.073) | 7 (56.4, 0.132) | |||
| Cadherin E | Positive | 35 (97.2, 0.027) | 25 (84.0, 0.066) | 16 (79.1, 0.078) | 0.834 | 1.00 (0.46–2.17) |
| Negative | 73 (93.9, 0.026) | 62 (89.6, 0.035) | 39 (80.0, 0.051) | |||
| Caspase 3a | Positive | 95 (96.3, 0.018) | 80 (89.6, 0.033) | 49 (80.6, 0.050) | 0.521 | 1.10 (0.14–8.40) |
| Negative | 6 (100) | 5 (83.3, 0.152) | 4 (83.3, 0.152) | |||
| β-Catenin | Positive | 26 (96.3, 0.036) | 20 (87.5, 0.068) | 9 (73.2, 0.101) | 0.553 | 1.43 (0.63–3.21) |
| Negative | 78 (94.3, 0.025) | 62 (87.4, 0.038) | 42 (80.1, 0.049) | |||
| Cathepsin D | Positive | 17 (96.1, 0.027) | 37 (84.6, 0.054) | 25 (76.1, 0.067) | 0.433 | 1.34 (0.66–2.72) |
| Negative | 54 (95.1, 0.028) | 44 (95.1, 0.039) | 25 (81.7, 0.062) | |||
| CD44 | Positive | 94 (96.2, 0.019) | 80 (90.6, 0.030) | 48 (80.1, 0.046) | 0.896 | 0.56 (0.07–4.28) |
| Negative | 9 (100) | 7 (87.5, 0.017) | 4 (87.5, 0.017) | |||
| EGFR | Positive | 58 (95.2, 0.027) | 43 (87.2, 0.046) | 29 (81.7, 0.057) | 0.674 | 0.71 (0.35–1.46) |
| Negative | 49 (94.6, 0.030) | 44 (88.6, 0.044) | 26 (77.5, 0.065) | |||
| HER2 | Positive | 51 (93.2, 0.033) | 41 (88.9, 0.043) | 19 (72.3, 0.077) | 0.346 | 1.38 (0.70–2.72) |
| Negative | 56 (96.6, 0.024) | 44 (86.9, 0.046) | 36 (84.6, 0.051) | |||
| MDM2 | Positive | 13 (92.7, 0.069) | 9 (76.0, 0.122) | 4 (60.8, 0.167) | 0.164 | 2.10 (0.79–5.59) |
| Negative | 88 (95.0, 0.022) | 70 (90.3, 0.031) | 49 (83.8, 0.042) | |||
| MMP9 | Positive | 71 (97.3, 0.019) | 49 (88.5, 0.041) | 33 (77.4, 0.059) | 0.985 | 0.97 (0.48–1.97) |
| Negative | 41 (91.4, 0.041) | 37 (86.7, 0.051) | 22 (82.9, 0.061) | |||
| p21 | Positive | 71 (96.1, 0.029) | 59 (93.1, 0.030) | 38 (84.7, 0.048) | 0.166 | 1.70 (0.86–3.46) |
| Negative | 33 (97.1, 0.022) | 26 (84.1, 0.065) | 14 (70.9, 0.090) | |||
| PDGF | Positive | 43 (93.7, 0.035) | 33 (83.6, 0.057) | 15 (63.7, 0.090) | 0.070 | 1.50 (0.79–3.10) |
| Negative | 62 (95.5, 0.025) | 52 (90.4, 0.038) | 37 (88.0, 0.043) | |||
| PTEN | Positive | 75 (95, 0.024) | 59 (90.5, 0.034) | 35 (82.0, 0.051) | 0.995 | 20.48 (0–2.23E+2) |
| Negative | 26 (96.0, 0.036) | 22 (88.3, 0.064) | 18 (83.6, 0.075) | |||
| PR | Positive | 87 (94.3, 0.023) | 79 (90.5, 0.033) | 50 (78.9, 0.045) | 0.324 | 2.73 (0.37–2.01) |
| Negative | 7 (87.5, 0.116) | 6 (87.5, 0.116) | 3 (87.5, 0.116) | |||
| Survivin | Positive | 70 (93.8, 0.026) | 57 (86.4, 0.040) | 50 (73.7, 0.059) | 0.128 | 1.93 (0.79–4.29) |
| Negative | 34 (97.0, 0.028) | 28 (90.7, 0.050) | 19 (90.7, 0.050) | |||
| β TGF | Positive | 89 (96.0, 0.019) | 73 (87.8, 0.034) | 47 (78.3, 0.047) | 0.540 | 0.65 (0.15–2.70) |
| Negative | 13 (92.9, 0.068) | 13 (92.9, 0.034) | 12 (83.2, 0.055) | |||
| α VEGF | Positive | 5 (83.0, 0.152) | 5 (83.0, 0.152) | 5 (83.0, 0.152) | 0.266 | 1.86 (0.72–4.66) |
| Negative | 99 (95.5, 0.022) | 80 (88.0, 0.032) | 48 (79.0, 0.045) | |||
PR: progesterone receptor.
 Positive immunostaining for Progesterone receptor, 100×; (B) PDGF positive immunostaining, 100×; (C) COX-2 positive case, 200×; (D) PTEN positive immunostaining, 100×; (E) MIB1 negative immunostaining (threshold: <4% nuclei), 200×; (F) FISH preparation showing 1p deletion in a meningioma cell. One red signal is seen for the 1p36 test probe, and two green signals are seen for the 1q25 reference probe, indicating loss of one copy of 1p36.")
(A) Positive immunostaining for Progesterone receptor, 100×; (B) PDGF positive immunostaining, 100×; (C) COX-2 positive case, 200×; (D) PTEN positive immunostaining, 100×; (E) MIB1 negative immunostaining (threshold: <4% nuclei), 200×; (F) FISH preparation showing 1p deletion in a meningioma cell. One red signal is seen for the 1p36 test probe, and two green signals are seen for the 1q25 reference probe, indicating loss of one copy of 1p36.
The LOH analysis by PCR of all the cases with chromosome 1p loss determined by FISH where it was possible to obtain matched populations of normal and tumour cells (n=8) corroborated the LOH at 1p36 with all the informative microsatellite markers in every case.
To establish a prognostic model, a multivariate linkage analysis for 6 variables (WHO grade, chromosome 1p loss, Cyclin A, TIMP2, COX-2 and MIB1/ki67) was performed by COX test. Topoisomerase IIα and MIB1/ki67 showed a significant co-variation (p<0.001), thus providing similar prognostic information; therefore, Topoisomerase IIα was not included in the analysis. The analysis showed that only loss of chromosome 1p36 (HR 3.29; 95%CI 1.33–8.17; p=0.010), COX-2 (HR 3.28; 95% CI: 1.10–9.68; p=0.032) and MIB1/ki67 (HR 3.44; 98% CI 1.12–10.55; p=0.031) were independent variables.
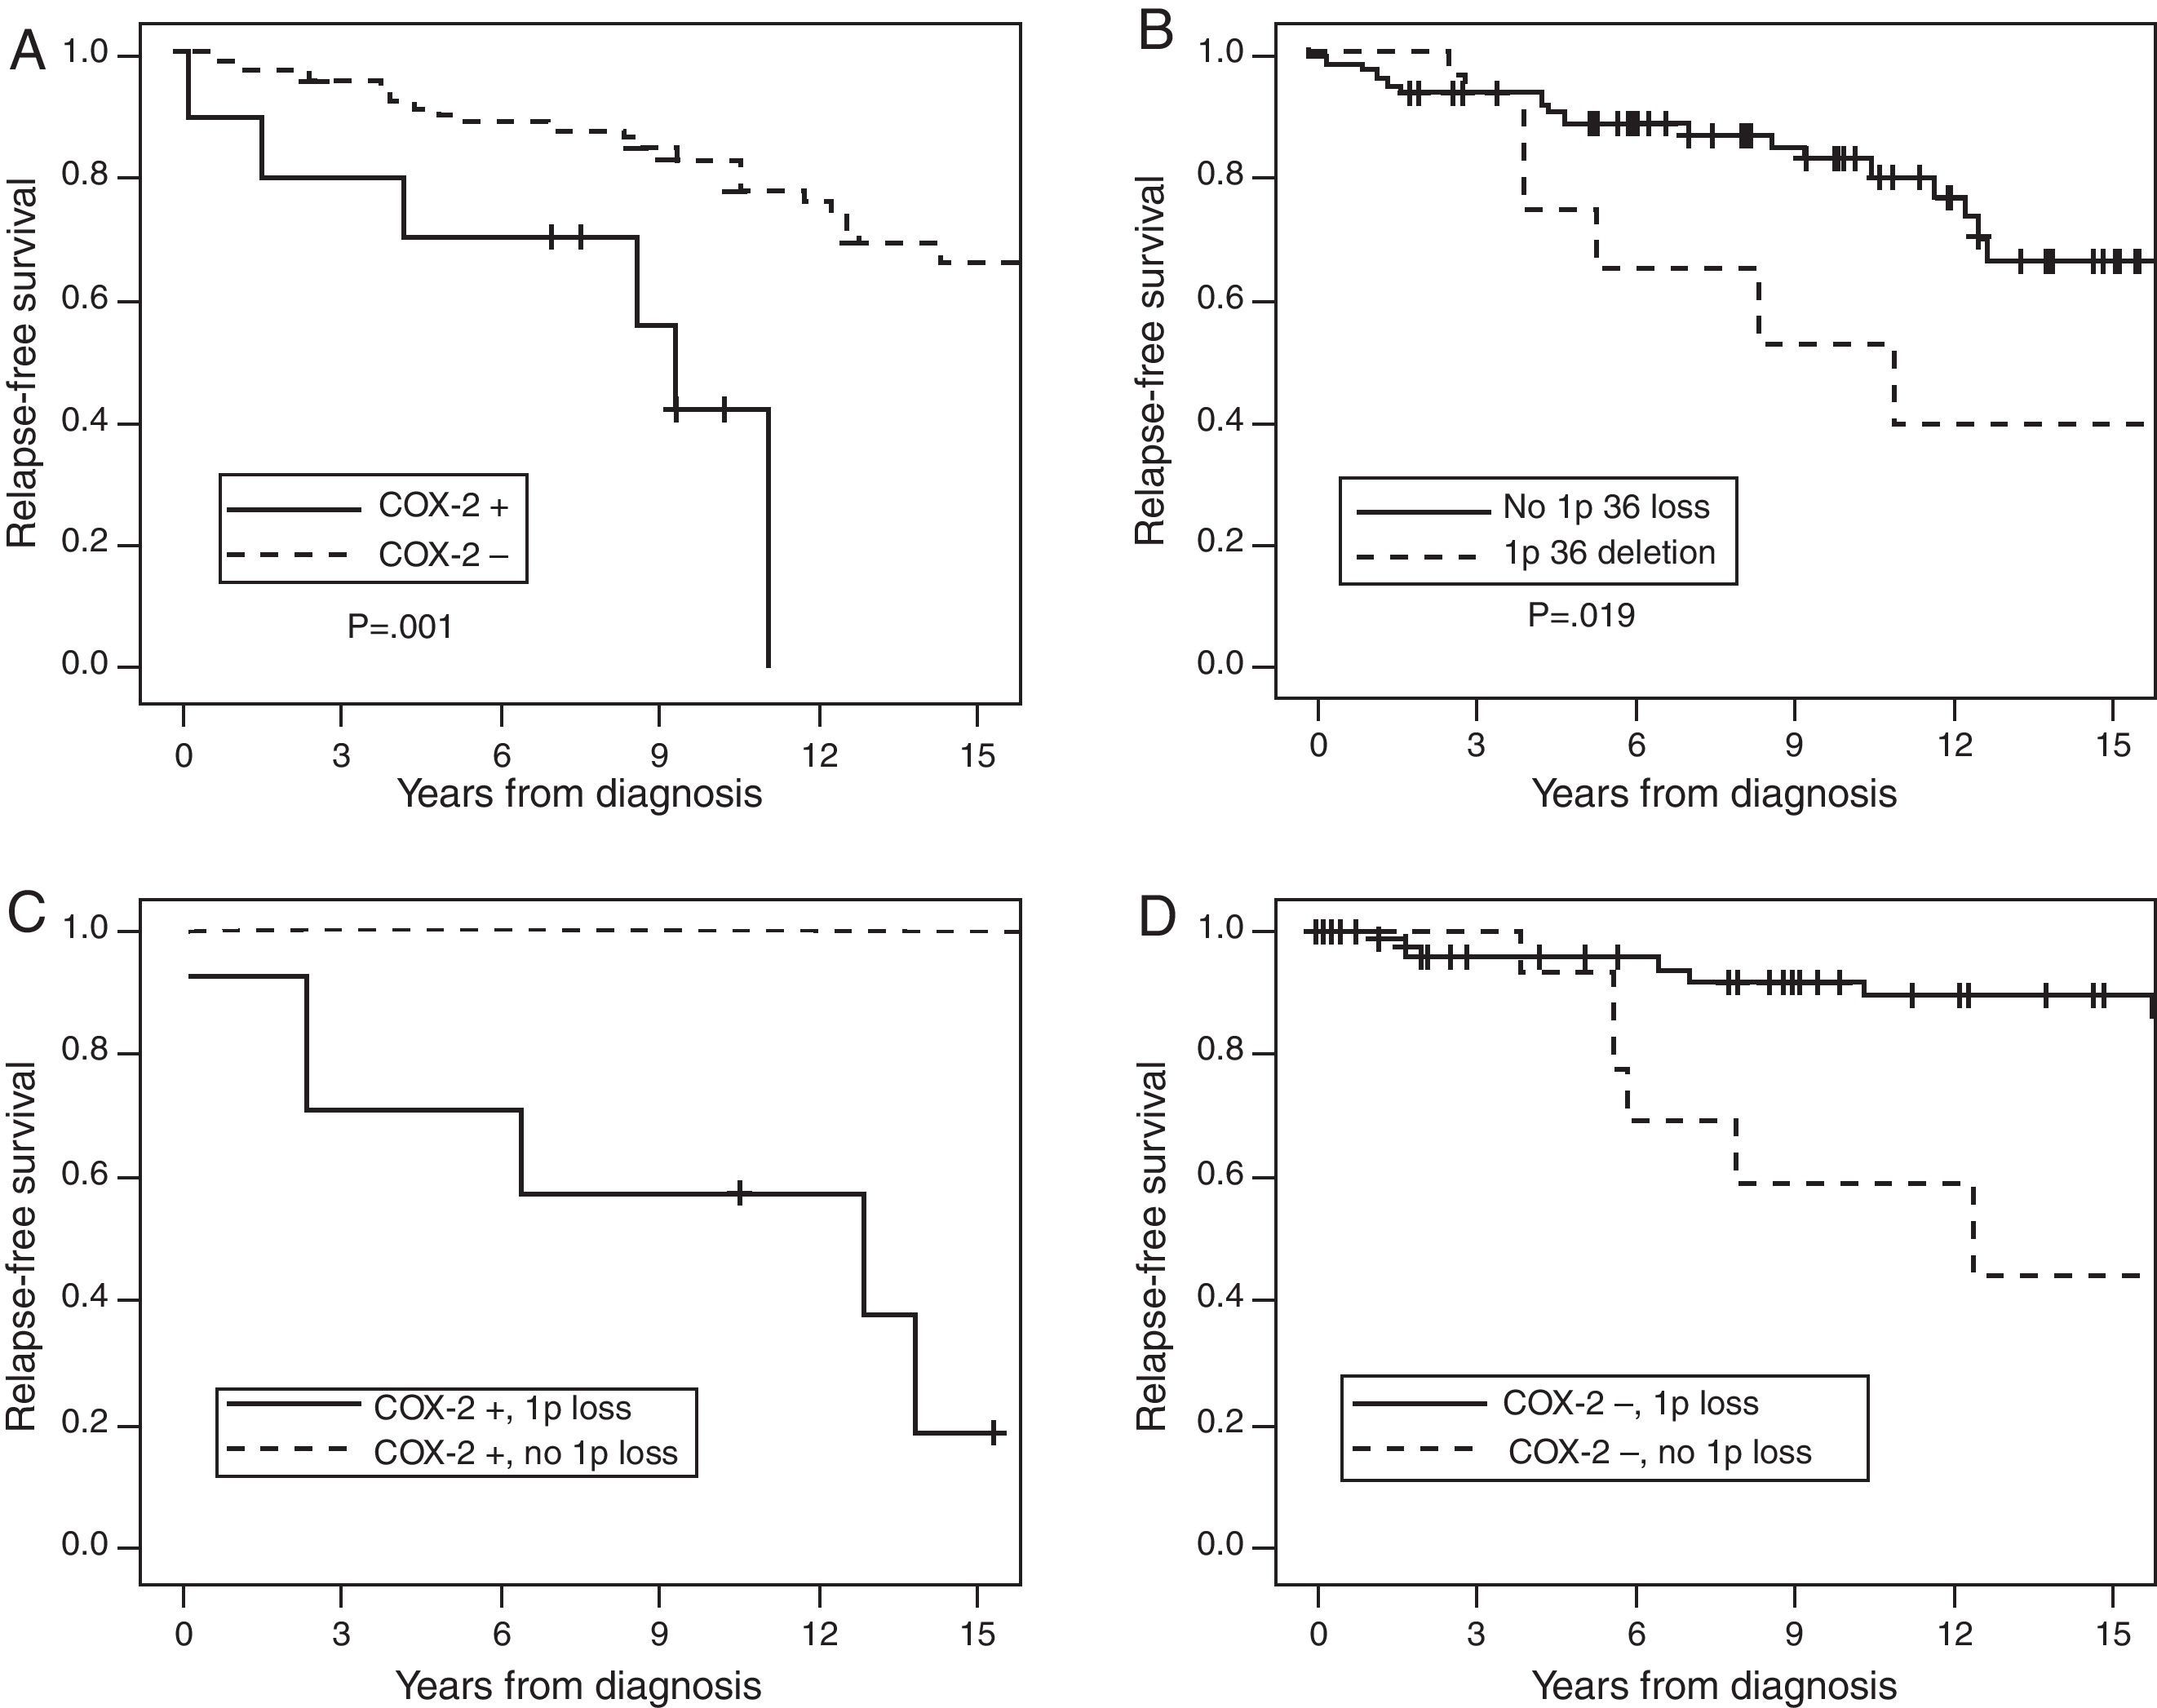
Kaplan–Meier curve for the first two predictive variables is shown in Fig. 2. The figure also shows the antagonistic effect of COX-2 expression and chromosome 1p36 loss (Panel 2C and 2D). Panel 2C shows that 80% of the meningiomas that showed 1p36 deletion associated with COX-2 overexpression will recur before 10 years of follow-up. Panel 2D shows that COX-2 negative meningiomas with 1p36 deletion have a better prognosis than COX-2 negative meningiomas with a normal chromosome 1p.
. Kaplan–Meier table curves for COX-2 expression (A) and 1p36 deletions determined by FISH (B). Antagonistic effect of COX-2 expression and chromosome 1p36 loss: (C) a comparison between meningiomas that overexpress COX-2 associated with 1p36 deletion (dark continuous line) and meningiomas with COX-2 overexpression without 1p36 deletion (discontinuous line). (D) The comparison of COX-2 negative meningiomas with (dark continuous line) or without (discontinuous line) chromosome 1p36 deletion.")
Cumulative relapse-free survival rates for Simpson grade I–III meningiomas (n=135). Kaplan–Meier table curves for COX-2 expression (A) and 1p36 deletions determined by FISH (B). Antagonistic effect of COX-2 expression and chromosome 1p36 loss: (C) a comparison between meningiomas that overexpress COX-2 associated with 1p36 deletion (dark continuous line) and meningiomas with COX-2 overexpression without 1p36 deletion (discontinuous line). (D) The comparison of COX-2 negative meningiomas with (dark continuous line) or without (discontinuous line) chromosome 1p36 deletion.
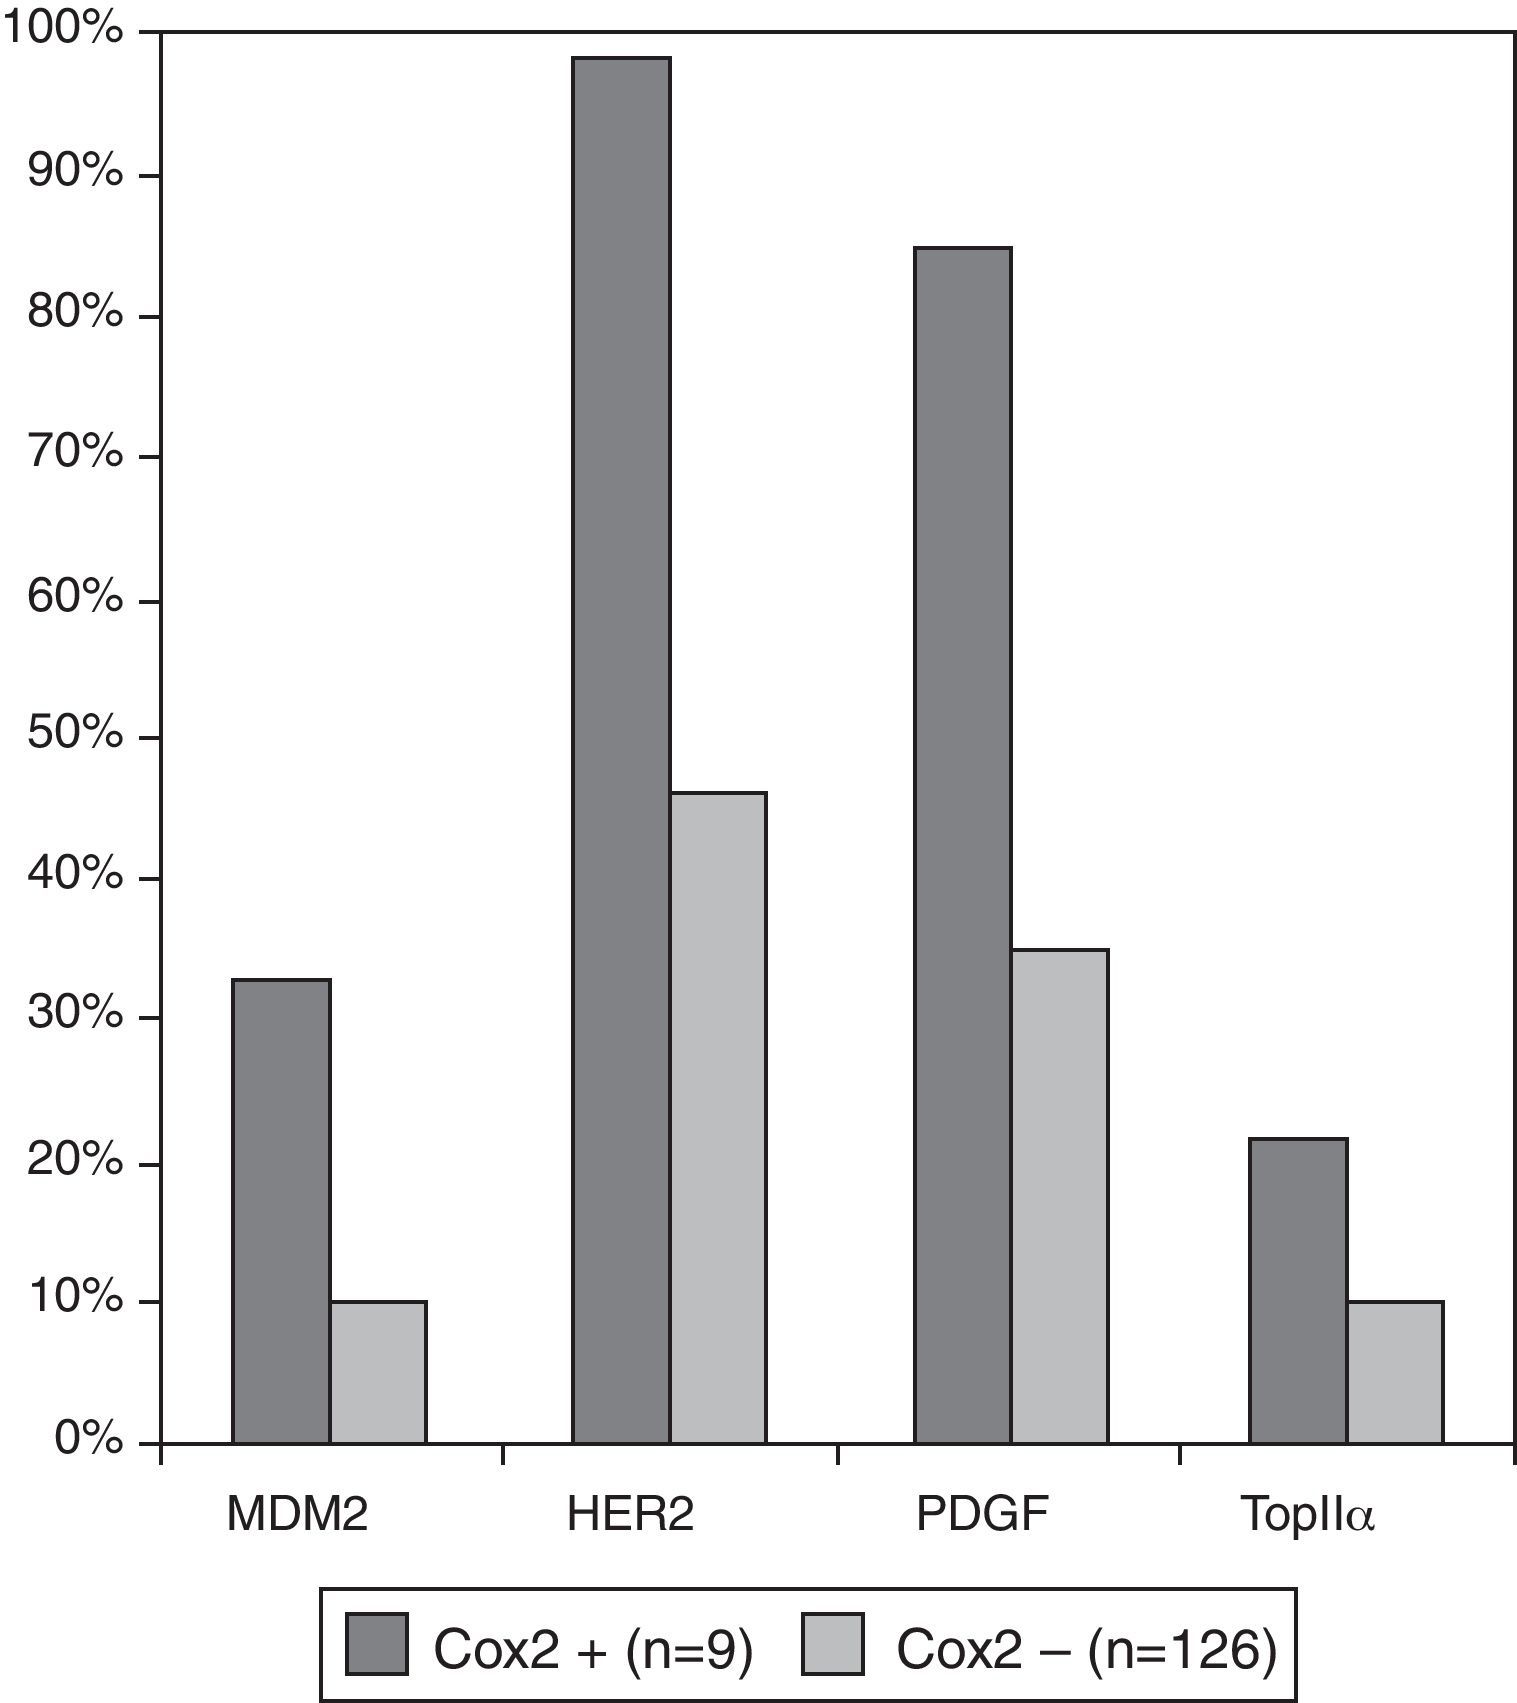
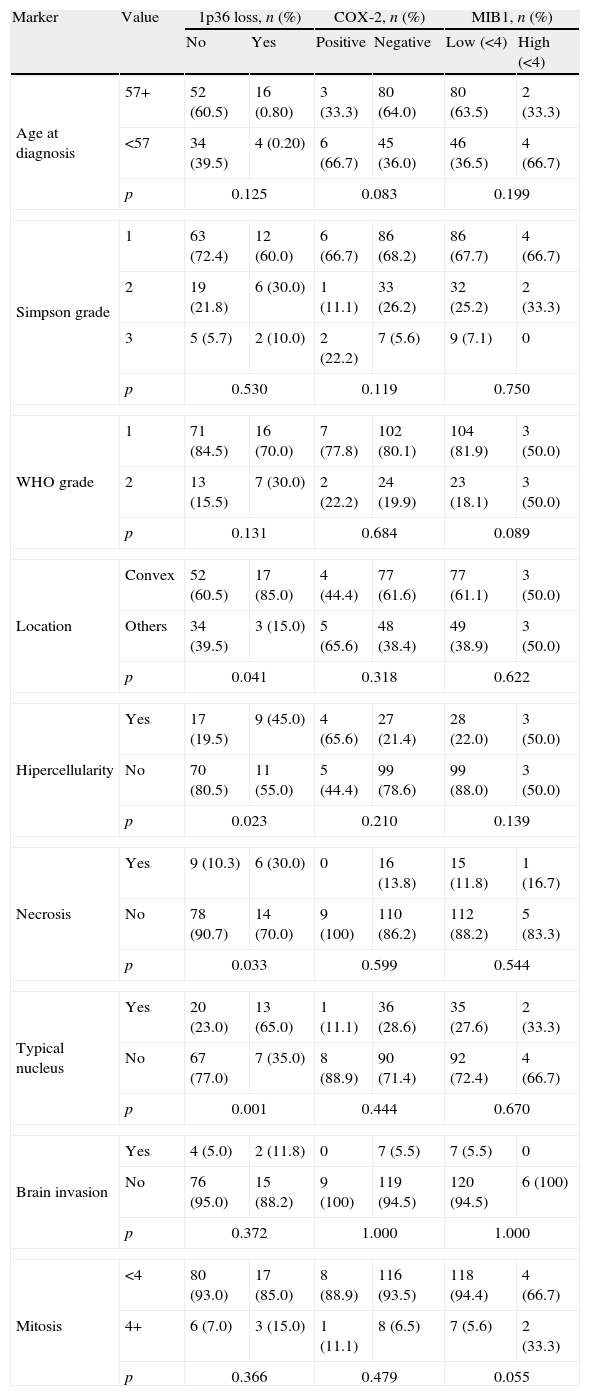
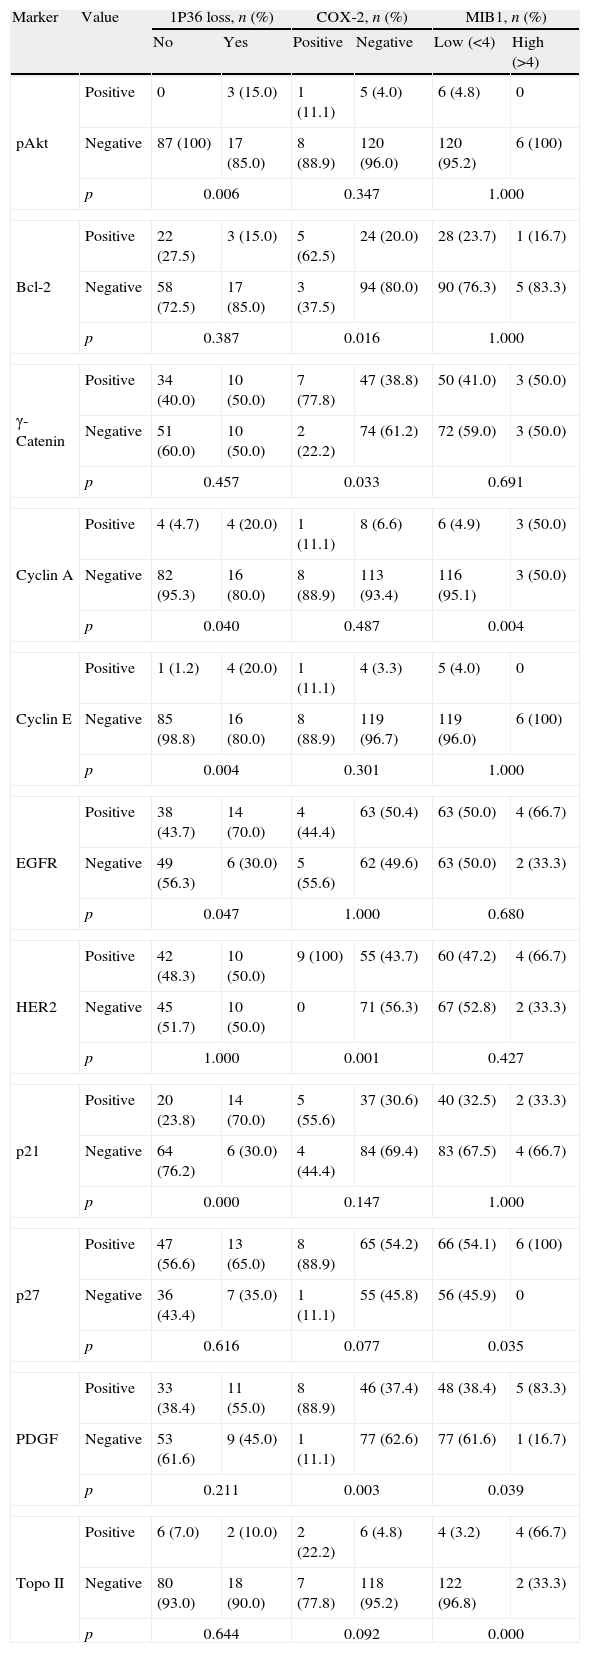
We investigated which clinicopathological variables (Table 4a) or immunohistochemical markers (Table 4b) were associated with these independent variables: loss of chromosome 1p36, COX-2 and MIB1/ki67 overexpression. There were no statistically significant differences between benign (grade I) and atypical (grade II) meningiomas regarding the presence of chromosome 1p36 deletion, COX-2 and MIB1/ki67 overexpression (p=0.176, 0.747 and 0.09, respectively). Meningiomas with loss of chromosome 1p36 showed significant increase of necrosis (p=0.05) and nuclear atypia (p=0.010). This genetic abnormality was more frequently found in meningiomas located at the convex than in other locations (p=0.04). Meningiomas showing 1p loss had increased expression of Cyclin E (p=0.013), PAKT (p=0.009), PDGF (p=0.048) and p21 (p=0.013). Meningiomas with COX-2 overexpression did not have specific clinicopathological features and were associated with increased expression of growth factors and receptors (PDGF and HER2) and increased cell proliferation indicators (Topoisomerase IIα and MDM2) (Fig. 3).
Co-variation (Chi-square test) between clinicopathological variables and 1p36 chromosomal loss, Cox2 and MIB1 overexpression in meningiomas grade I and II (n=135).
| Marker | Value | 1p36 loss, n (%) | COX-2, n (%) | MIB1, n (%) | |||
| No | Yes | Positive | Negative | Low (<4) | High (<4) | ||
| Age at diagnosis | 57+ | 52 (60.5) | 16 (0.80) | 3 (33.3) | 80 (64.0) | 80 (63.5) | 2 (33.3) |
| <57 | 34 (39.5) | 4 (0.20) | 6 (66.7) | 45 (36.0) | 46 (36.5) | 4 (66.7) | |
| p | 0.125 | 0.083 | 0.199 | ||||
| Simpson grade | 1 | 63 (72.4) | 12 (60.0) | 6 (66.7) | 86 (68.2) | 86 (67.7) | 4 (66.7) |
| 2 | 19 (21.8) | 6 (30.0) | 1 (11.1) | 33 (26.2) | 32 (25.2) | 2 (33.3) | |
| 3 | 5 (5.7) | 2 (10.0) | 2 (22.2) | 7 (5.6) | 9 (7.1) | 0 | |
| p | 0.530 | 0.119 | 0.750 | ||||
| WHO grade | 1 | 71 (84.5) | 16 (70.0) | 7 (77.8) | 102 (80.1) | 104 (81.9) | 3 (50.0) |
| 2 | 13 (15.5) | 7 (30.0) | 2 (22.2) | 24 (19.9) | 23 (18.1) | 3 (50.0) | |
| p | 0.131 | 0.684 | 0.089 | ||||
| Location | Convex | 52 (60.5) | 17 (85.0) | 4 (44.4) | 77 (61.6) | 77 (61.1) | 3 (50.0) |
| Others | 34 (39.5) | 3 (15.0) | 5 (65.6) | 48 (38.4) | 49 (38.9) | 3 (50.0) | |
| p | 0.041 | 0.318 | 0.622 | ||||
| Hipercellularity | Yes | 17 (19.5) | 9 (45.0) | 4 (65.6) | 27 (21.4) | 28 (22.0) | 3 (50.0) |
| No | 70 (80.5) | 11 (55.0) | 5 (44.4) | 99 (78.6) | 99 (88.0) | 3 (50.0) | |
| p | 0.023 | 0.210 | 0.139 | ||||
| Necrosis | Yes | 9 (10.3) | 6 (30.0) | 0 | 16 (13.8) | 15 (11.8) | 1 (16.7) |
| No | 78 (90.7) | 14 (70.0) | 9 (100) | 110 (86.2) | 112 (88.2) | 5 (83.3) | |
| p | 0.033 | 0.599 | 0.544 | ||||
| Typical nucleus | Yes | 20 (23.0) | 13 (65.0) | 1 (11.1) | 36 (28.6) | 35 (27.6) | 2 (33.3) |
| No | 67 (77.0) | 7 (35.0) | 8 (88.9) | 90 (71.4) | 92 (72.4) | 4 (66.7) | |
| p | 0.001 | 0.444 | 0.670 | ||||
| Brain invasion | Yes | 4 (5.0) | 2 (11.8) | 0 | 7 (5.5) | 7 (5.5) | 0 |
| No | 76 (95.0) | 15 (88.2) | 9 (100) | 119 (94.5) | 120 (94.5) | 6 (100) | |
| p | 0.372 | 1.000 | 1.000 | ||||
| Mitosis | <4 | 80 (93.0) | 17 (85.0) | 8 (88.9) | 116 (93.5) | 118 (94.4) | 4 (66.7) |
| 4+ | 6 (7.0) | 3 (15.0) | 1 (11.1) | 8 (6.5) | 7 (5.6) | 2 (33.3) | |
| p | 0.366 | 0.479 | 0.055 | ||||
Immunohistochemical markers with statistically significant association with 1p36 chromosomal loss, Cox2 and MIB1 overexpression in meningiomas grade I and II. Molecular biomarkers with no statistical association with those three variables are not shown (n=135).
| Marker | Value | 1P36 loss, n (%) | COX-2, n (%) | MIB1, n (%) | |||
| No | Yes | Positive | Negative | Low (<4) | High (>4) | ||
| pAkt | Positive | 0 | 3 (15.0) | 1 (11.1) | 5 (4.0) | 6 (4.8) | 0 |
| Negative | 87 (100) | 17 (85.0) | 8 (88.9) | 120 (96.0) | 120 (95.2) | 6 (100) | |
| p | 0.006 | 0.347 | 1.000 | ||||
| Bcl-2 | Positive | 22 (27.5) | 3 (15.0) | 5 (62.5) | 24 (20.0) | 28 (23.7) | 1 (16.7) |
| Negative | 58 (72.5) | 17 (85.0) | 3 (37.5) | 94 (80.0) | 90 (76.3) | 5 (83.3) | |
| p | 0.387 | 0.016 | 1.000 | ||||
| γ-Catenin | Positive | 34 (40.0) | 10 (50.0) | 7 (77.8) | 47 (38.8) | 50 (41.0) | 3 (50.0) |
| Negative | 51 (60.0) | 10 (50.0) | 2 (22.2) | 74 (61.2) | 72 (59.0) | 3 (50.0) | |
| p | 0.457 | 0.033 | 0.691 | ||||
| Cyclin A | Positive | 4 (4.7) | 4 (20.0) | 1 (11.1) | 8 (6.6) | 6 (4.9) | 3 (50.0) |
| Negative | 82 (95.3) | 16 (80.0) | 8 (88.9) | 113 (93.4) | 116 (95.1) | 3 (50.0) | |
| p | 0.040 | 0.487 | 0.004 | ||||
| Cyclin E | Positive | 1 (1.2) | 4 (20.0) | 1 (11.1) | 4 (3.3) | 5 (4.0) | 0 |
| Negative | 85 (98.8) | 16 (80.0) | 8 (88.9) | 119 (96.7) | 119 (96.0) | 6 (100) | |
| p | 0.004 | 0.301 | 1.000 | ||||
| EGFR | Positive | 38 (43.7) | 14 (70.0) | 4 (44.4) | 63 (50.4) | 63 (50.0) | 4 (66.7) |
| Negative | 49 (56.3) | 6 (30.0) | 5 (55.6) | 62 (49.6) | 63 (50.0) | 2 (33.3) | |
| p | 0.047 | 1.000 | 0.680 | ||||
| HER2 | Positive | 42 (48.3) | 10 (50.0) | 9 (100) | 55 (43.7) | 60 (47.2) | 4 (66.7) |
| Negative | 45 (51.7) | 10 (50.0) | 0 | 71 (56.3) | 67 (52.8) | 2 (33.3) | |
| p | 1.000 | 0.001 | 0.427 | ||||
| p21 | Positive | 20 (23.8) | 14 (70.0) | 5 (55.6) | 37 (30.6) | 40 (32.5) | 2 (33.3) |
| Negative | 64 (76.2) | 6 (30.0) | 4 (44.4) | 84 (69.4) | 83 (67.5) | 4 (66.7) | |
| p | 0.000 | 0.147 | 1.000 | ||||
| p27 | Positive | 47 (56.6) | 13 (65.0) | 8 (88.9) | 65 (54.2) | 66 (54.1) | 6 (100) |
| Negative | 36 (43.4) | 7 (35.0) | 1 (11.1) | 55 (45.8) | 56 (45.9) | 0 | |
| p | 0.616 | 0.077 | 0.035 | ||||
| PDGF | Positive | 33 (38.4) | 11 (55.0) | 8 (88.9) | 46 (37.4) | 48 (38.4) | 5 (83.3) |
| Negative | 53 (61.6) | 9 (45.0) | 1 (11.1) | 77 (62.6) | 77 (61.6) | 1 (16.7) | |
| p | 0.211 | 0.003 | 0.039 | ||||
| Topo II | Positive | 6 (7.0) | 2 (10.0) | 2 (22.2) | 6 (4.8) | 4 (3.2) | 4 (66.7) |
| Negative | 80 (93.0) | 18 (90.0) | 7 (77.8) | 118 (95.2) | 122 (96.8) | 2 (33.3) | |
| p | 0.644 | 0.092 | 0.000 | ||||
Topo II: topoisomerasa IIα.
 and COX-2 negative (clear boxes).")
In a previous study15 we provided clinicopathological and immunohistochemical characterisation of meningiomas, distinguishing meningiomas grade I and II by the 2007 revised WHO grading system which proved to be a useful prognostic factor for RFS. We concluded that the presence of a high cellularity in meningeal neoplasms, MIB-1 or Topoisomerase IIα, γ-Catenin, and cyclooxigenase 2 overexpression are additional useful prognostic factors for predicting recurrence of benign and atypical meningiomas. We also concluded that loss of chromosome 1p36 is a frequent event in meningiomas and needs further evaluation.
The present study, one of the largest series of completely removed meningiomas grade I and II with long-term follow-up, re-evaluated with WHO 2007 criteria, shows (Table 3a) a 10-year recurrence rate of 15% for completely removed meningiomas grade I (RFS: 85% of the cases) and 40.9% for meningiomas grade II (RFS: 59.1%), consistent with the ranges previously reported, from 15% to 25% for histologically benign (WHO grade I) and from 20% to 45% for atypical (grade II) tumours.2,5,6 These rates are sufficiently high to warrant the consideration of different and independent prognostic factors, apart from the WHO grading.
We compared the prognostic significance of different clinicopathological variables, loss of chromosome 1p36 by FISH, LOH of 1p36 by PCR, and immunohistochemical markers to predict RFS. All the clinicopathological findings described in our series are virtually identical to those reported previously.20,21 The univariate statistical analysis (Table 3a) showed that among the histopathological features commonly found in meningiomas grade II, absence of a characteristic nucleus and increased cellularity are relevant variables that, when evaluated independently, are also associated with RFS. On the other hand, mitotic activity, necrosis, Simpson grade of surgical resection (from I to III), haemorrhage, presence of Psammoma bodies, transition to small cell, “sheeting” or tumour location did not have any prognostic significance. The immunohistochemical and molecular markers of RFS were also analysed and when compared with the WHO grade using the COX proportional hazards model showed that chromosome 1p36 loss, positive expression of COX-2 and MIB1/ki67 were found to be the stronger predictors for meningioma progression. There are no statistical associations between those markers and WHO grading (Tables 4a and 4b), suggesting that the molecular prognostic indicators provide a different insight of crucial molecular mechanisms involved in an increased recurrence probability.
Numerous previous efforts have focused on the evaluation of meningioma growth fraction as a prognostic marker.10,13,14,22–25 We found that both MIB1/ki67 and Topoisomerase IIα positive immunostainings are useful prognostic indicators for RFS when using a cut-off value of 4%, as previously shown by others.10–16,26Table 4b shows that there is a co-variation between Ki67 and Topoisomerase II (p=0.000) and that they are also associated with the number of mitosis. However, the number of cases of meningiomas grade I and II with more than 4% of the cells showing a positive immunostaining for ki67 is low (3 and 3 cases, respectively).
The cyclo-oxygenase-2 (COX-2) is an enzyme catalysing fatty acid oxidation causally linked to the progress from normal cell growth through hyperplasia to neoplasia and cancer,27–29 as well as to protect cells from apoptosis induced by various cellular stresses. COX-2 inhibits detachment-induced apoptosis (anoikis) in cancer from activation of the PI-3K/Akt pathway.29 The small subset of cases in our series that showed COX-2 overexpression (n=9) showed increased expression of markers associated with cell proliferation: MDM2 (p=0.07), Topoisomerase IIα (p=0.09), PDGF (p=0.03), and HER2 (p=0.01) (Fig. 3). Therefore, COX-2 overexpression may indicate a small subgroup of meningiomas with increased cellular “stress” and growth stimulation and a higher recurrence rate, independent of the WHO grading system. Chemoprevention based on COX-2 inhibitors has already been achieved in a wide range of cancers or as adjuvant therapy of established disease.30,31 The increased COX-2 expression in recurrent meningioma may also suggest a putative role of COX-2 inhibitors to prevent recurrence, as we showed previously.15
Loss of chromosome 1p36 is frequently found in meningeal neoplasms and has been previously reported to be increased in the pathogenesis of atypical and anaplastic tumours, eventually associated with prognosis.32–37 We believe this marker may be informative and useful clinically. We have not found significant differences for 1p losses between benign and atypical meningiomas. Meningiomas with loss of chromosome 1p36 showed significant increased necrosis, nuclear atypia and increased expression of Cyclin E, PAKT, PDGF and p21. All the molecular biomarkers associated with 1p36 loss may participate in the PI3/Akt molecular pathway, suggesting that this pathway may play a major role in tumorigenesis when there is a loss of chromosome 1p. The prognostic significance of 1p36 deletion is higher when it is associated with COX-2 overexpression and meningiomas showing that both features have an 80% recurrence rate (Fig. 2).
In conclusion, we found two molecular biomarkers that can predict recurrence of grade I and II meningiomas. Cyclooxigenase 2 overexpression and the loss of chromosome 1p36 are independent prognostic factors. COX-2 positive immunostaining identifies a small group of meningiomas with higher risk of tumour recurrence and increased presence of other cell proliferation immunohistochemical markers. Chromosome 1p36 deletion identifies a subgroup of grade I or II meningiomas (18% in our series) with increased recurrence rates associated with the AKt/PI3K molecular pathway activation. Meningiomas that share both COX-2 positive staining and chromosome 1p36 deletion have an 80% recurrence rate after ten years. We also suggest a putative role of COX-2 inhibitors as a chemopreventive treatment for the increased risk of recurrence.
Ethical disclosuresProtection of human and animal subjectsThe authors declare that no experiments were performed on humans or animals for this investigation.
Confidentiality of dataThe authors declare that they have followed the protocols of their work centre on the publication of patient data and that all the patients included in the study have received sufficient information and have given their informed consent in writing to participate in that study.
Right to privacy and informed consentThe authors declare that no patient data appear in this article.
Conflict of interestWe declare that authors have no financial relationship with the organisation that partially sponsored the research.
To Fundación Mutua Madrileña, for the partial financing of this work.

