
To evaluate the impact of obesity on ICU mortality.
DesignObservational, retrospective, multicentre study.
SettingIntensive Care Unit (ICU).
PatientsAdults patients admitted with COVID-19 and respiratory failure.
InterventionsNone.
Primary variables of interestCollected data included demographic and clinical characteristics, comorbidities, laboratory tests and ICU outcomes. Body mass index (BMI) impact on ICU mortality was studied as (1) a continuous variable, (2) a categorical variable obesity/non-obesity, and (3) as categories defined a priori: underweight, normal, overweight, obesity and Class III obesity. The impact of obesity on mortality was assessed by multiple logistic regression and Smooth Restricted cubic (SRC) splines for Cox hazard regression.
Results5,206 patients were included, 20 patients (0.4%) as underweight, 887(17.0%) as normal, 2390(46%) as overweight, 1672(32.1) as obese and 237(4.5%) as class III obesity. The obesity group patients (n = 1909) were younger (61 vs. 65 years, p < 0.001) and with lower severity scores APACHE II (13 [9–17] vs. 13[10−17, p < 0.01) than non-obese. Overall ICU mortality was 28.5% and not different for obese (28.9%) or non-obese (28.3%, p = 0.65). Only Class III obesity (OR = 2.19, 95%CI 1.44–3.34) was associated with ICU mortality in the multivariate and SRC analysis.
ConclusionsCOVID-19 patients with a BMI > 40 are at high risk of poor outcomes in the ICU. An effective vaccination schedule and prolonged social distancing should be recommended.
Evaluar el impacto de la obesidad en la mortalidad de la UCI.
DiseñoEstudio observacional, retrospectivo y multicéntrico.
ÁmbitoUnidad de Cuidados Intensivos (UCI).
PacientesPacientes adultos con COVID-19 e insuficiencia respiratoria.
IntervencionesNinguna.
Variables de interés principalesCaracterísticas demográficas y clínicas, comorbilidades, pruebas de laboratorio y evolución en la UCI. El impacto del índice de masa corporal (IMC) sobre la mortalidad se estudió como (1) una variable continua, (2) una variable categórica obesidad/no obesidad, y (3) como categorías definidas a priori: bajo peso, normal, sobrepeso, obesidad y obesidad clase III. El impacto de la obesidad se evaluó mediante regresión logística múltiple y splines cúbicos suaves restringidos (SRC) para la regresión de riesgos de Cox.
ResultadosSe incluyeron 5.206 pacientes, 20 (0,4%) con bajo peso, 887 (17,0%) con peso normal, 2.390 (46%) con sobrepeso, 1.672 (32,1%) con obesidad y 237 (4,5%) con obesidad clase III. Los pacientes obesos (n = 1909) eran más jóvenes (61 vs. 65 años, p < 0,001) y con un nivel más bajo de APACHE II (13 [9–17] frente a 13[10−17, p < 0,01) que los no obesos. La mortalidad global en la UCI fue del 28,5% y no fue diferente entre obesos (28,9%) y no obesos (28,3%,p = 0,65). Sólo la obesidad clase III (OR = 2,19; IC del 95%: 1,44−3,34) se asoció con la mortalidad en la UCI en el análisis multivariante y SRC.
ConclusionesLos pacientes con COVID-19 con un IMC > 40 tienen un alto riesgo de mala evolución en la UCI. Debe recomendarse un calendario de vacunación eficaz y un distanciamiento social prolongado.
The COVID-19 pandemic has impacted global morbidity and mortality without precedent in the past decades. To determine patients’ prognoses, many risk factors have been considered. In previous pandemics, such as influenza A(H1N1)pdm,1–3 an elevated body mass index (BMI) has been associated with worse outcomes, including a higher need for invasive mechanical ventilation (IMV) and/or longer ICU stay.
In patients with COVID-19, the association between obesity and worse clinical outcomes is still unclear.4–13 It has been previously recognised that adipokines and cytokines represent a marker of chronic low-grade inflammation characteristic of abdominal obesity, which may impair immune response and potentially have further effects on the lung of patients affected with SARS-CoV-2 infection.14,15 Despite the rational evidence, multiple studies and meta-analyses have been published and could not determine that obesity is associated with worse outcomes in patients with COVID-19 infection.16,17
Previous studies18 have reported that many patients with COVID-19 infection had an elevated BMI. Despite these elevated rates, most studies suggest that elevated BMI does not represent an independent risk factor for mortality. Moreover, the association between high BMI and bad outcomes has yet to be further explored in critically ill patients affected by COVID-19 infection.4–11 Interestingly, a recently published meta-analysis13 found that obesity was associated with an increased risk of death in patients with COVID-19. This study was one of the very few analysing BMI, and the results should be interpreted cautiously due to a high risk of bias and the certainty that their evidence needed to be better classified.
In this study, we aimed to determine the association of high BMI with patients’ outcomes considering the lack of adequate and definitive data, especially when considering critically ill patients. We hypothesise that patients with obesity are not at increased risk of death when admitted to the ICU. Therefore, the study aims to evaluate the impact of obesity on crude ICU mortality in critically ill patients admitted by COVID-19.
Material and methodsStudy designThis was an observational, retrospective cohort study with prospectively collected data of COVID-19 patients involving 74 ICUs (seventy-two from Spain, one from Andorra, and one from the Republic of Ireland). Between February 13th, 2020 and December 31st, 2021, consecutive ICU-admitted patients with a confirmed test by positive reverse transcriptase-polymerase chain reaction for SARS-CoV-2 from upper or lower respiratory tract samples were included in a large-scale patient database supported by the SEMICYUC (Spanish Society of Intensive Care Medicine and Coronary Units).
The need for informed consent was waived, and the ethical board approved the study as per Institution’s Internal Review Board (Comitè Ètic d’Investigació amb Medicaments [CEIm] from Institut d’Investigació Sanitària Pere Virgili [IISPV] - IRB# CEIM/066/2020). Local researchers-maintained contact with a study team member, and participating hospitals obtained local ethics committee approval. The study was carried out according to the principles of the Declaration of Helsinki and the Clinical Trials Directive 2001/20/EC of the European Parliament relating to the Good Clinical Practice guidelines.
We reported results by the Strengthening the Reporting of Observational Studies in Epidemiology (STROBE) guidelines.19 The study was registered in Clinicaltrials.gov with the reference number NCT 04948242.
PatientsConsecutive patients older than 16 years of age were prospectively included if admitted to one of the participating ICUs with the diagnosis of acute respiratory failure (ARF) and a COVID-19 diagnosis was confirmed by a positive reverse transcriptase-polymerase chain reaction for SARS-CoV-2 from upper or lower respiratory tract samples.17 The follow-up of patients was scheduled until March 1, 2022, which confirmed ICU discharge or death, whichever occurred first.
Data collectionDemographic and clinical data of the patients participating in the study were recorded in a case report form. After anonymising the data, the forms were sent to the Study Coordinator and all the information was entered in the COVID-19 SEMICYUC registry by two different Data Entry Investigators and validated after data accuracy confirmation. Collected data included demographic characteristics (age, gender, height and weight), comorbidities, time course of the illness (dates of the symptoms onset, diagnosis, hospital admission, and ICU admission), laboratory test, microbiologic results, radiological findings, respiratory support (non-invasive and invasive) at ICU admission and day one, complications and organ support measures, treatments used, and ICU outcomes.
The severity of patients was evaluated at 24 h of ICU admission using the Acute Physiology and Chronic Health Evaluation (APACHE) II score and the Sequential Organ Failure Assessment (SOFA) score.
COVID-19 diagnosis was confirmed with a positive reverse transcription-polymerase chain reaction for SARS-CoV-2 of collected specimens from the upper (naso/oropharyngeal swabs) or lower respiratory tract (tracheal aspirate or bronchoalveolar lavage).
DefinitionsBody mass index (BMI) was calculated using the first height and weight recorded during the SARS-CoV-2 ICU admission. BMI was categorised as follows: BMI as (1) a categorical variable obesity (cut-off ≥30)/non-obesity, and (2) as categories defined a priori by using the World Health Organization criteria.20,21 into underweight (<18.5 kg/m2), normal weight (18.5–24.9 kg/m2), overweight (25.0–29.9 kg/m2), obesity which included the following: class I (30–34.9 kg/m2) and II (35–39.9 kg/m2), and the former term of “morbid obesity” that is now classified as class III (≥40 kg/m2). Further definitions used in the study can be found in the Supplementary material.
ObjectivesPrimary: The primary objective was to evaluate the impact of Obesity on ICU mortality according to presence or absence and the defined BMI categories.
Secondary: The secondary objectives were to determine the need for invasive mechanical ventilation (IMV), the incidence of ventilator-associated pneumonia (VAP), days under IMV and the development of acute kidney injury (AKI), including the need for continuous renal replacement techniques (CRRT) in patients with and without obesity.
OutcomesThe primary outcome was the crude mortality rate at ICU discharge according to the presence or absence of high obesity and according to the BMI categories defined.
Data preparationWe first assessed the value distributions and missingness of the variables. For data quality control, continuous variables with missing data >40% were excluded from the database. Missing data for continuous variables were imputed using the R-package "missForest" for the statistical software R/CRAN. The imputation was applied to impute the missing values of PCT (18%), D dimer (15%), D-Lactate dehydrogenase (17%), Procalcitonin (10%), and C-reactive protein (CRP) (0.6%). Categorical data (including ICU mortality) were available for all included patients.
Statistical analysisNo statistical sample size calculation was performed a priori, and the sample size was equal to the number of patients admitted to the participant’s ICUs with confirmed COVID-19 during the study period. To describe baseline characteristics, the continuous variables were expressed as median (Q1–Q3 range]) and categorical variables as number of cases (percentage). For patient demographics and clinical characteristics, differences between groups were assessed using the chi-squared test, Fisher’s exact test for categorical variables, and the Mann–Whitney U or Wilcoxon test for continuous variables.
The ICU admission criteria, use of antiviral, antibiotic or co-adjuvant treatment, and also the measures that would determine the need to intubate and type of ventilator support required (oxygenation, high flow nasal cannula [HFNC], non-invasive [NIV] or invasive [IMV] mechanical ventilation) were not standardized between centres. They were left to the discretion of the attending physician, according to SEMICYUC and the National Ministry of Health.22 They were included in the case report form and confirmed by the medical records. We also collected hospital-level data, including city, county, and number of hospital beds available.
Analysis planIn the first step, a multilevel conditional logistic modelling and the intraclass correlation coefficient (ICC) were calculated (Table S1, Supplementary material) with patients nested in hospital to characterise hospital-level variation of ICU mortality and determine if a significant inter-hospital variation is present.
In the second step, we describe the differences between patients with and without obesity according to BMI categorisation. Subsequently, we present the characteristics of the patients according to their evolution at ICU discharge. All data, except those related to evolution, are shown concerning ICU admission values.
In the third step, the relationship between BMI and laboratory variables has been studied by Pearson correlation.
In the fourth step, to study the impact of obesity, BMI categories and BMI as a continuous variable on mortality, we used multiple logistic regression, including all variables with significance in the univariate mortality analysis. Because the subgroup of underweight patients is very small relative to the other subgroups, this causes the dataset to be class unbalanced. In these cases, it is difficult to create adequate test and training data sets, as most classifiers are built assuming that the test data come from the same distribution as the training data. Considering that unbalanced data will produce undesirable results, such as much lower performance in the test data than in the training data, we have decided to exclude this subgroup from the multivariate mortality analysis.
For all model internal validation, the database was randomly split into two subsets: (a) a “training set” (70%) and (b) a “validation set” (30%). Models’ performance was examined using accuracy test, sensitivity(S), specificity (Sp), positive predictive value (PPV), negative predictive value (NPV) and area under the ROC curve (AUC). Multicollinearity was checked by calculating the variance inflation ratio (VIF).
In the fifth step, Smooth Restricted cubic splines (RCS) for Cox hazard regression were used to model possible non-linear relationships between BMI and outcome. Spline functions estimate exposure effects for specific intervals of the exposure variable of interest (BMI) through polynomial functions joined together at five knots. The estimated associations between the exposure and the outcome were plotted as a graphical depiction.
Finally, sensitivity analyses stratified by age, sex, diabetes, and hypertension were performed using adjusted logistic regression analysis. In the age-stratified analysis, we used a cut-off point of 63 years because 63 was the cut-off point with the lowest HR in the smooth RCS plot (Figure S1, Supplemental material). Results are shown as OR and 95% CI.
In a post hoc analysis, we evaluated the impact of class III obesity within the subgroup of obese patients to confirm whether class III obesity remains a condition associated with increased mortality.
Data analysis was performed using R software (cran.r-project.org).
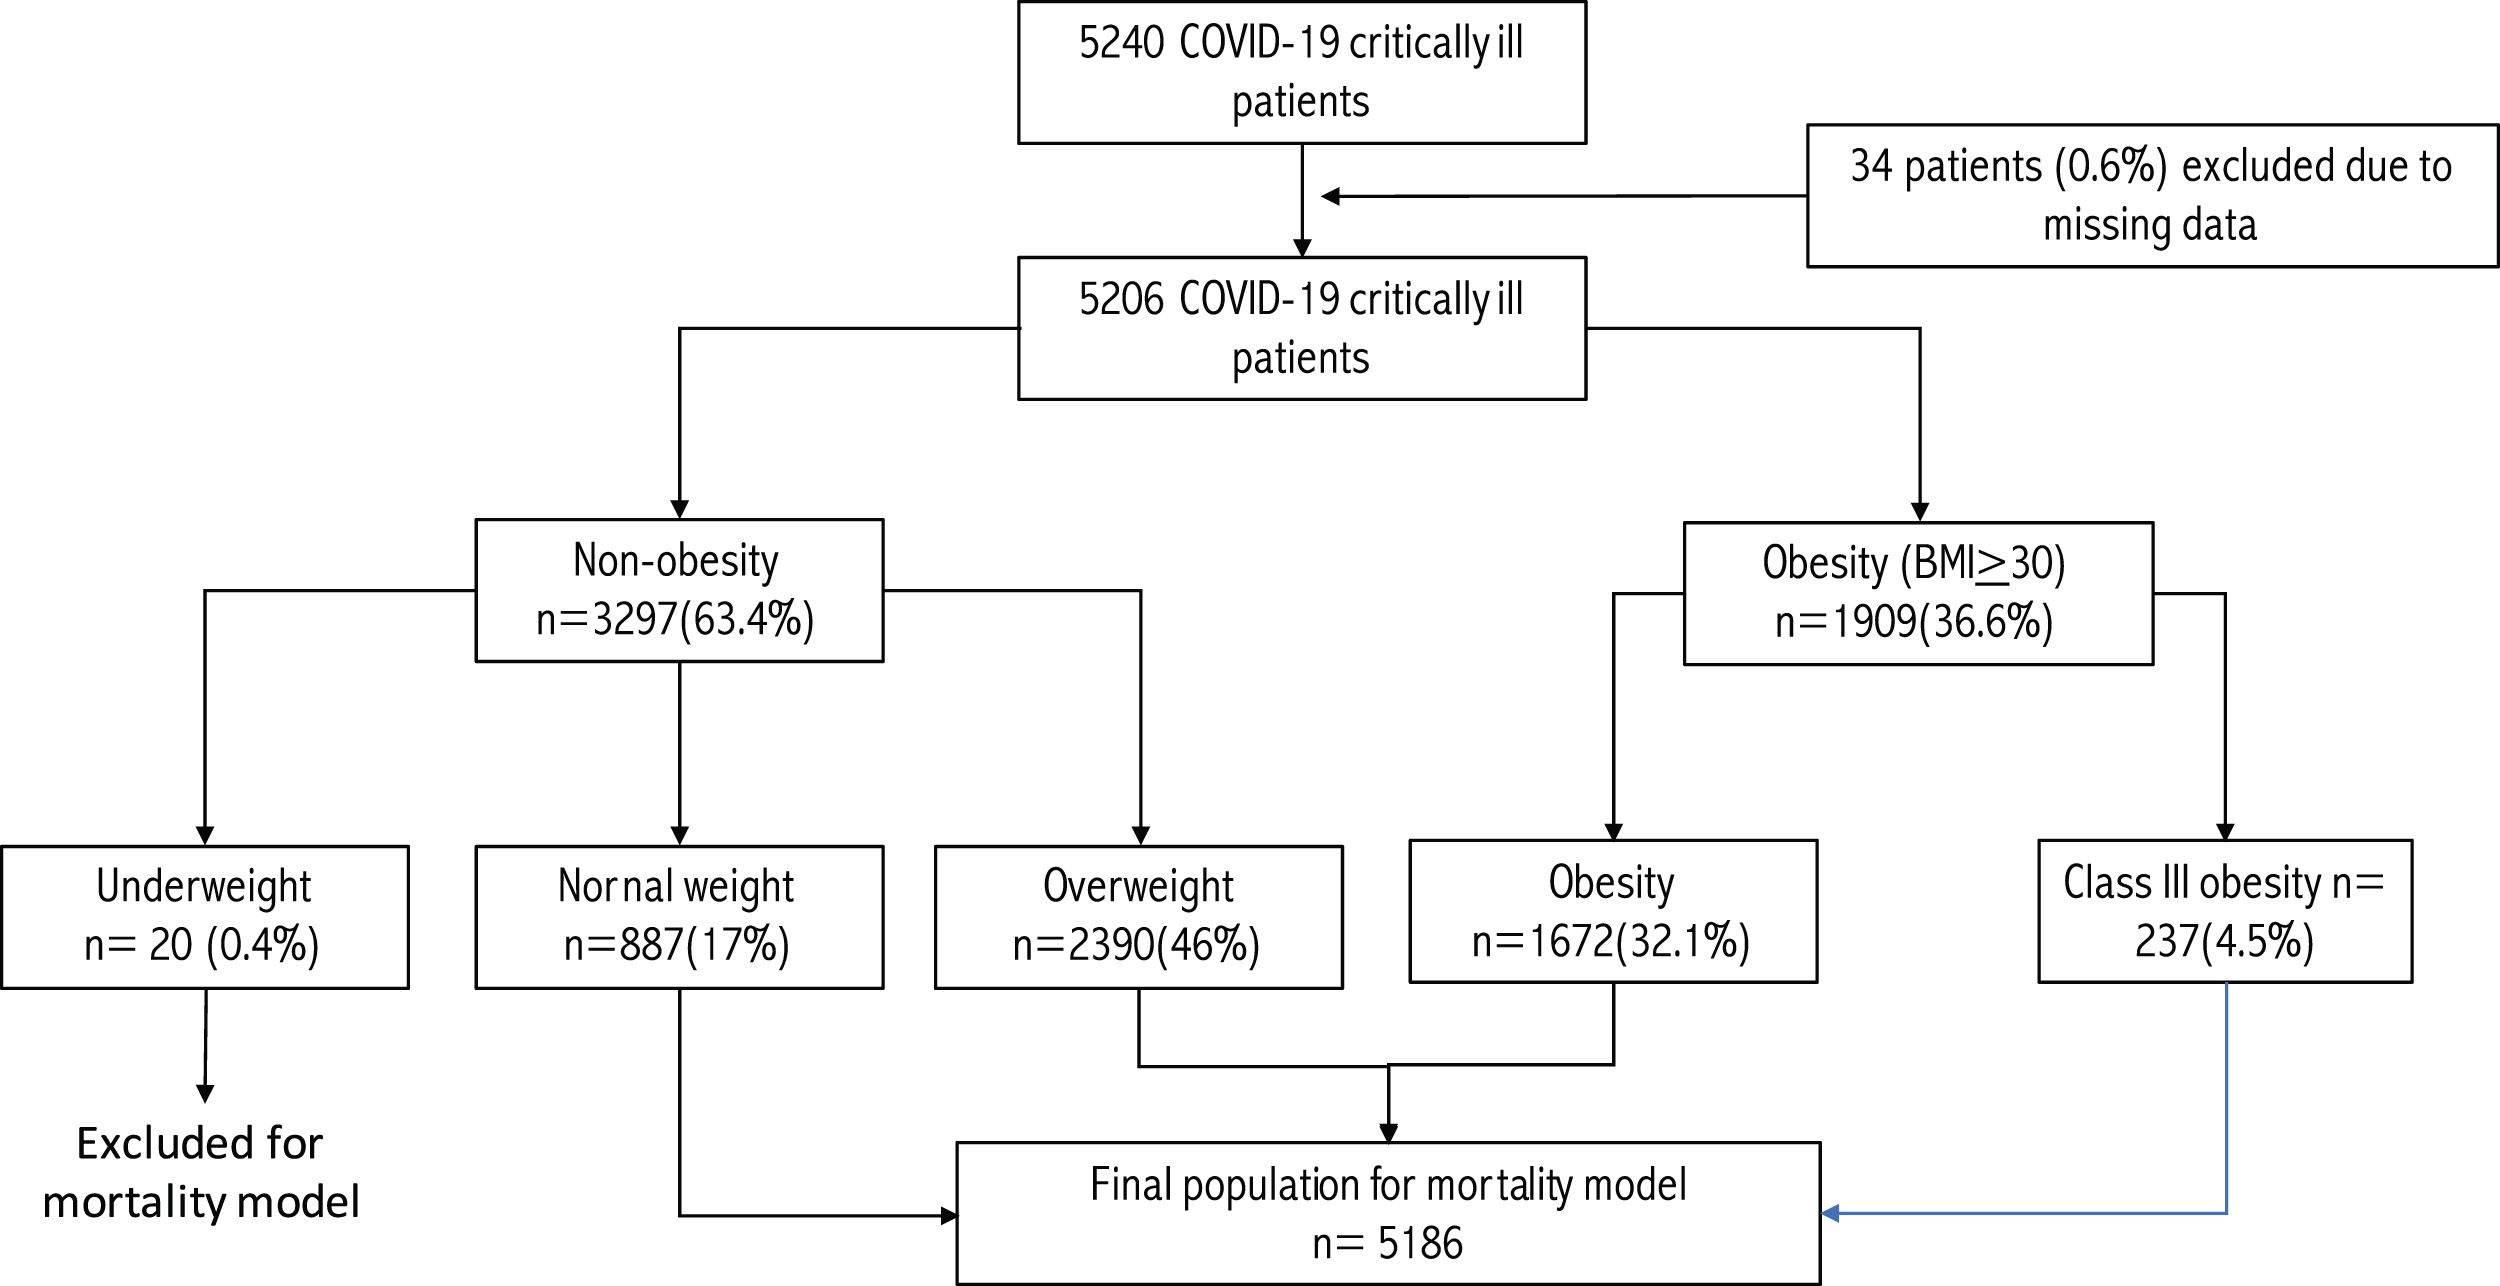
ResultsPatients’ characteristics at ICU admissionA total of 5,240 critically ill patients were included in the database, of which 34 had to be excluded due to a lack of data on weight or height. Therefore, 5,206 patients were included in the analysis. A detailed flowchart is displayed in Fig. 1 by STROBE guidelines.

According to the BMI, 20 patients (0.4%) were classified as underweight, 887 (17.0%) as normal weight, 2390 (46%) as overweight, 1672 (32.1) as obese and the remaining 237 (4.5%) as class III obesity.
Due to the low incidence of underweight patients and to make the multivariate risk models more reliable, it was decided to exclude this population from the mortality analysis. Underweight patients were younger (59 [44–73]) years compared to the overall population of 63 (55−71) years, but without statistical significance (p = 0.53). There was no significant difference in severity level (APACHE II 12.5 vs. 13.0, p = 0.92) or degree of organ dysfunction (SOFA score (4.5 vs. 4.0, p = 0.45) compared to the overall population. Finally, the crude mortality in this group, 25% (5/20), was like that observed in the rest of the population, 28.5% (1479/5186, p = 0.72).
After excluding underweight patients, 5186 patients are included in the present analysis. The median age was 63 (55–72) years, 3,664 (70.6%) were men, and 55% were admitted during the first pandemic wave.
Arterial hypertension (n = 2358; 45.3%) and obesity (n = 1909; 36.8%) were the most frequently comorbid reported conditions. The severity of illness was reported with an APACHE score of II (13 [10–17]) and a SOFA score of 4 [3–7]) scores. A detailed clinical characteristic of the patients and laboratory findings are displayed in Table 1.
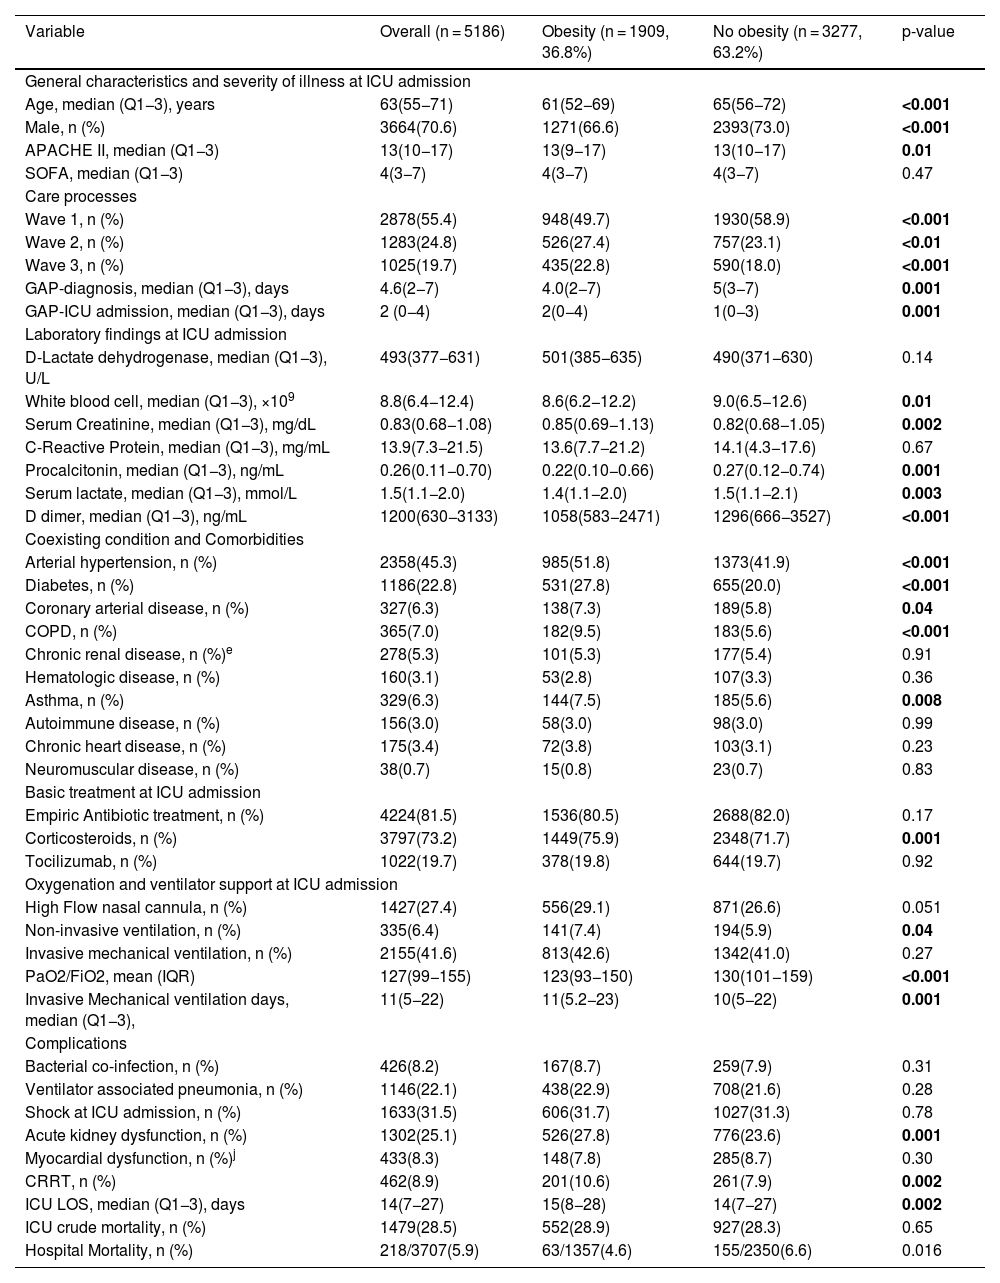
Characteristics of 5186 critically ill patients included in the study according to presence of obesity (BMI ≥ 30) or not.
| Variable | Overall (n = 5186) | Obesity (n = 1909, 36.8%) | No obesity (n = 3277, 63.2%) | p-value |
|---|---|---|---|---|
| General characteristics and severity of illness at ICU admission | ||||
| Age, median (Q1−3), years | 63(55−71) | 61(52−69) | 65(56−72) | <0.001 |
| Male, n (%) | 3664(70.6) | 1271(66.6) | 2393(73.0) | <0.001 |
| APACHE II, median (Q1−3) | 13(10−17) | 13(9−17) | 13(10−17) | 0.01 |
| SOFA, median (Q1−3) | 4(3−7) | 4(3−7) | 4(3−7) | 0.47 |
| Care processes | ||||
| Wave 1, n (%) | 2878(55.4) | 948(49.7) | 1930(58.9) | <0.001 |
| Wave 2, n (%) | 1283(24.8) | 526(27.4) | 757(23.1) | <0.01 |
| Wave 3, n (%) | 1025(19.7) | 435(22.8) | 590(18.0) | <0.001 |
| GAP-diagnosis, median (Q1−3), days | 4.6(2−7) | 4.0(2−7) | 5(3−7) | 0.001 |
| GAP-ICU admission, median (Q1−3), days | 2 (0−4) | 2(0−4) | 1(0−3) | 0.001 |
| Laboratory findings at ICU admission | ||||
| D-Lactate dehydrogenase, median (Q1−3), U/L | 493(377−631) | 501(385−635) | 490(371−630) | 0.14 |
| White blood cell, median (Q1−3), ×109 | 8.8(6.4−12.4) | 8.6(6.2−12.2) | 9.0(6.5−12.6) | 0.01 |
| Serum Creatinine, median (Q1−3), mg/dL | 0.83(0.68−1.08) | 0.85(0.69−1.13) | 0.82(0.68−1.05) | 0.002 |
| C-Reactive Protein, median (Q1−3), mg/mL | 13.9(7.3−21.5) | 13.6(7.7−21.2) | 14.1(4.3−17.6) | 0.67 |
| Procalcitonin, median (Q1−3), ng/mL | 0.26(0.11−0.70) | 0.22(0.10−0.66) | 0.27(0.12−0.74) | 0.001 |
| Serum lactate, median (Q1−3), mmol/L | 1.5(1.1−2.0) | 1.4(1.1−2.0) | 1.5(1.1−2.1) | 0.003 |
| D dimer, median (Q1−3), ng/mL | 1200(630−3133) | 1058(583−2471) | 1296(666−3527) | <0.001 |
| Coexisting condition and Comorbidities | ||||
| Arterial hypertension, n (%) | 2358(45.3) | 985(51.8) | 1373(41.9) | <0.001 |
| Diabetes, n (%) | 1186(22.8) | 531(27.8) | 655(20.0) | <0.001 |
| Coronary arterial disease, n (%) | 327(6.3) | 138(7.3) | 189(5.8) | 0.04 |
| COPD, n (%) | 365(7.0) | 182(9.5) | 183(5.6) | <0.001 |
| Chronic renal disease, n (%)e | 278(5.3) | 101(5.3) | 177(5.4) | 0.91 |
| Hematologic disease, n (%) | 160(3.1) | 53(2.8) | 107(3.3) | 0.36 |
| Asthma, n (%) | 329(6.3) | 144(7.5) | 185(5.6) | 0.008 |
| Autoimmune disease, n (%) | 156(3.0) | 58(3.0) | 98(3.0) | 0.99 |
| Chronic heart disease, n (%) | 175(3.4) | 72(3.8) | 103(3.1) | 0.23 |
| Neuromuscular disease, n (%) | 38(0.7) | 15(0.8) | 23(0.7) | 0.83 |
| Basic treatment at ICU admission | ||||
| Empiric Antibiotic treatment, n (%) | 4224(81.5) | 1536(80.5) | 2688(82.0) | 0.17 |
| Corticosteroids, n (%) | 3797(73.2) | 1449(75.9) | 2348(71.7) | 0.001 |
| Tocilizumab, n (%) | 1022(19.7) | 378(19.8) | 644(19.7) | 0.92 |
| Oxygenation and ventilator support at ICU admission | ||||
| High Flow nasal cannula, n (%) | 1427(27.4) | 556(29.1) | 871(26.6) | 0.051 |
| Non-invasive ventilation, n (%) | 335(6.4) | 141(7.4) | 194(5.9) | 0.04 |
| Invasive mechanical ventilation, n (%) | 2155(41.6) | 813(42.6) | 1342(41.0) | 0.27 |
| PaO2/FiO2, mean (IQR) | 127(99−155) | 123(93−150) | 130(101−159) | <0.001 |
| Invasive Mechanical ventilation days, median (Q1−3), | 11(5−22) | 11(5.2−23) | 10(5−22) | 0.001 |
| Complications | ||||
| Bacterial co-infection, n (%) | 426(8.2) | 167(8.7) | 259(7.9) | 0.31 |
| Ventilator associated pneumonia, n (%) | 1146(22.1) | 438(22.9) | 708(21.6) | 0.28 |
| Shock at ICU admission, n (%) | 1633(31.5) | 606(31.7) | 1027(31.3) | 0.78 |
| Acute kidney dysfunction, n (%) | 1302(25.1) | 526(27.8) | 776(23.6) | 0.001 |
| Myocardial dysfunction, n (%)j | 433(8.3) | 148(7.8) | 285(8.7) | 0.30 |
| CRRT, n (%) | 462(8.9) | 201(10.6) | 261(7.9) | 0.002 |
| ICU LOS, median (Q1−3), days | 14(7−27) | 15(8−28) | 14(7−27) | 0.002 |
| ICU crude mortality, n (%) | 1479(28.5) | 552(28.9) | 927(28.3) | 0.65 |
| Hospital Mortality, n (%) | 218/3707(5.9) | 63/1357(4.6) | 155/2350(6.6) | 0.016 |
PaO2/FiO2: Arterial Oxygen blood pressure/Inspired oxygen fraction; APACHE II: Acute Physiology and Chronic Health Evaluation; SOFA: Sequential Organ Failure Assessment; Gap-diagnosis: days from onset of symptoms to diagnosis; Gap-ICU: days from hospital to ICU admission; COPD: Chronic Obstructive pulmonary Disease; CRRT: Continuous Renal Replacement Techniques; ICU: intensive care unit, LOS: length of stay.
Subjects within the obesity group (n = 1909) were younger (61 vs. 65 years, p < 0.001) and with a slightly lower level of severity according to APACHE II and SOFA scores. As expected, obese patients had a higher frequency of comorbidities such as hypertension, diabetes, COPD, and coronary heart disease than non-obese patients. Obese patients had greater oxygenation impairment and a greater need for non-invasive ventilation (NIV) on admission to the ICU, with greater development of acute renal dysfunction (AKI) and continuous renal replacement techniques (CRRT). Although the need for IMV was not different on admission to the ICU, it was higher 24 h after admission (60% vs. 56%, p = 0.03) and throughout the ICU stay (77% vs. 73%, p < 0.001) in obese patients compared to non-obese patients (Figure S2, Supplementary material).
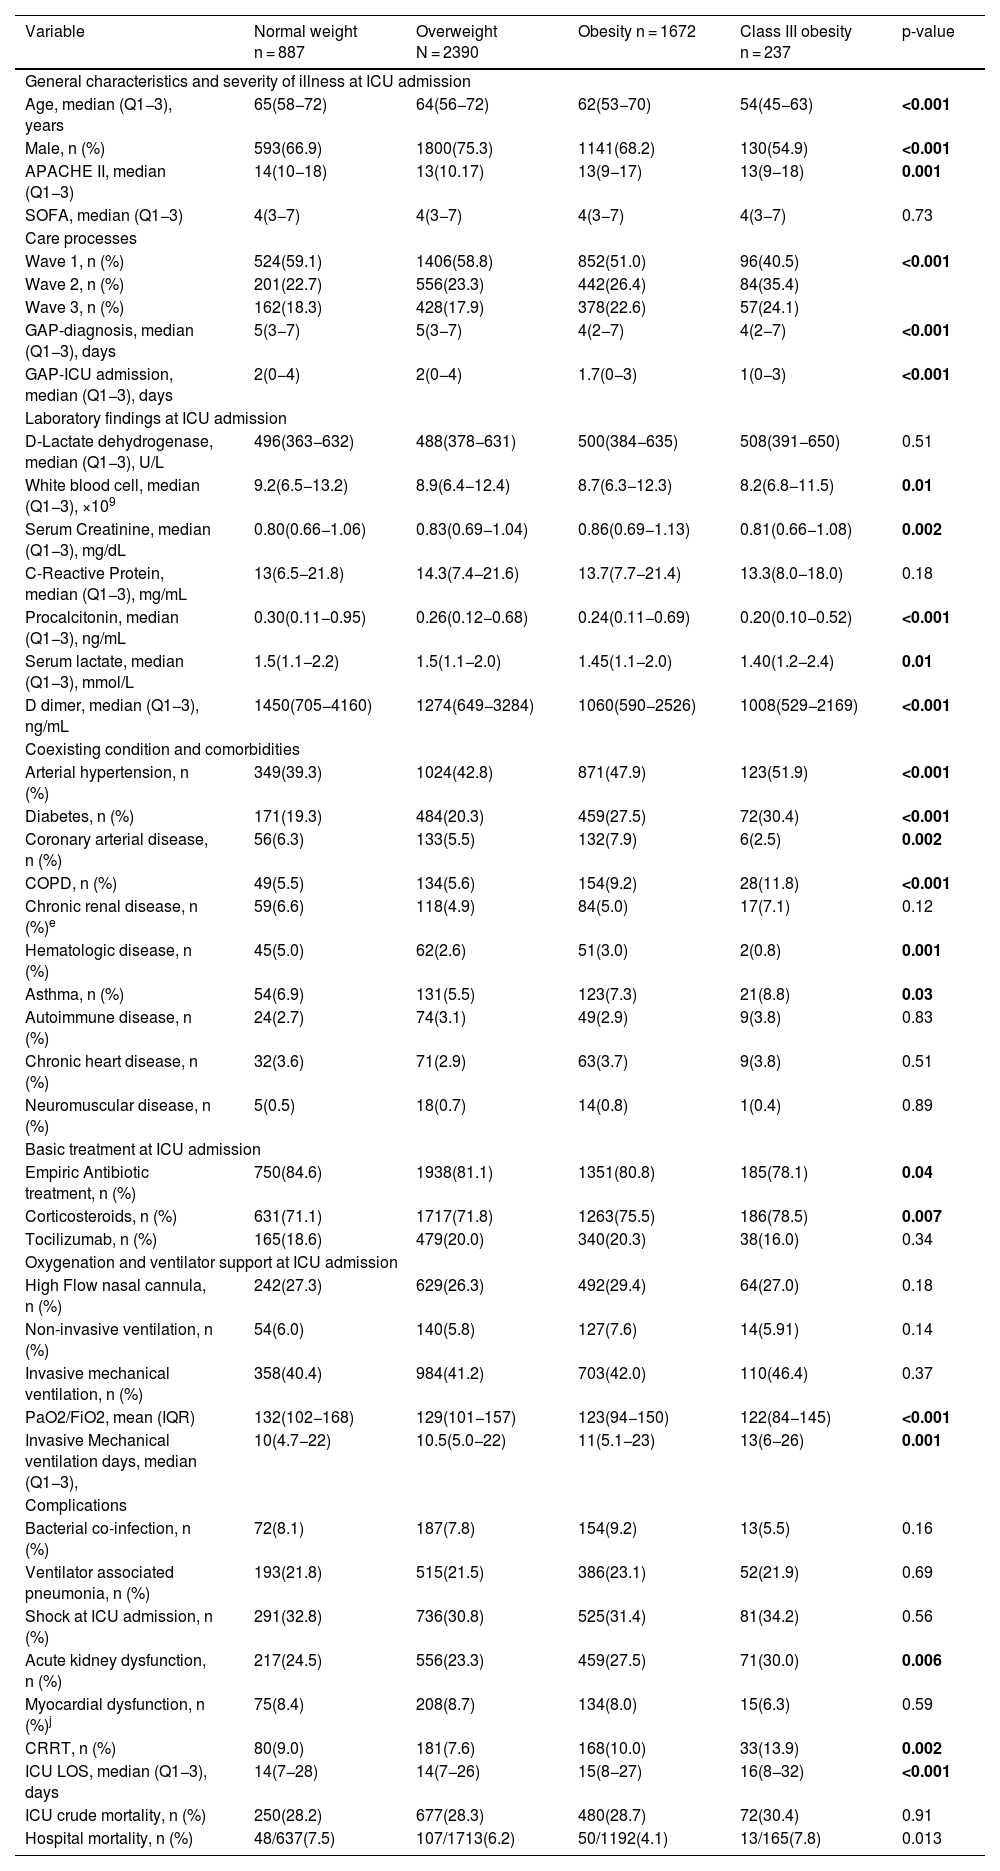
The clinical, laboratory and treatment characteristics, as well as the complications of the study patients according to the BMI categorisation, can be seen in Table 2. No significant correlation was observed between BMI and laboratory values and laboratory derangements (Figure S3, Supplementary material). Time to diagnosis or ICU admission was shorter in obsessed and class III patients. Interestingly, obese or class III patients did not have a higher incidence of NIV or IMV, nor VAP (Table 2) despite receiving more corticosteroid treatment on admission to ICU (Table S2 Supplementary material). In contrast, the development of AKI and the need for CRRT, days of invasive mechanical ventilation and ICU LOS were positively associated with increasing BMI (Table 2).
Characteristics of 5186 critically ill patients included according to BMI categories.
| Variable | Normal weight n = 887 | Overweight N = 2390 | Obesity n = 1672 | Class III obesity n = 237 | p-value |
|---|---|---|---|---|---|
| General characteristics and severity of illness at ICU admission | |||||
| Age, median (Q1−3), years | 65(58−72) | 64(56−72) | 62(53−70) | 54(45−63) | <0.001 |
| Male, n (%) | 593(66.9) | 1800(75.3) | 1141(68.2) | 130(54.9) | <0.001 |
| APACHE II, median (Q1−3) | 14(10−18) | 13(10.17) | 13(9−17) | 13(9−18) | 0.001 |
| SOFA, median (Q1−3) | 4(3−7) | 4(3−7) | 4(3−7) | 4(3−7) | 0.73 |
| Care processes | |||||
| Wave 1, n (%) | 524(59.1) | 1406(58.8) | 852(51.0) | 96(40.5) | <0.001 |
| Wave 2, n (%) | 201(22.7) | 556(23.3) | 442(26.4) | 84(35.4) | |
| Wave 3, n (%) | 162(18.3) | 428(17.9) | 378(22.6) | 57(24.1) | |
| GAP-diagnosis, median (Q1−3), days | 5(3−7) | 5(3−7) | 4(2−7) | 4(2−7) | <0.001 |
| GAP-ICU admission, median (Q1−3), days | 2(0−4) | 2(0−4) | 1.7(0−3) | 1(0−3) | <0.001 |
| Laboratory findings at ICU admission | |||||
| D-Lactate dehydrogenase, median (Q1−3), U/L | 496(363−632) | 488(378−631) | 500(384−635) | 508(391−650) | 0.51 |
| White blood cell, median (Q1−3), ×109 | 9.2(6.5−13.2) | 8.9(6.4−12.4) | 8.7(6.3−12.3) | 8.2(6.8−11.5) | 0.01 |
| Serum Creatinine, median (Q1−3), mg/dL | 0.80(0.66−1.06) | 0.83(0.69−1.04) | 0.86(0.69−1.13) | 0.81(0.66−1.08) | 0.002 |
| C-Reactive Protein, median (Q1−3), mg/mL | 13(6.5−21.8) | 14.3(7.4−21.6) | 13.7(7.7−21.4) | 13.3(8.0−18.0) | 0.18 |
| Procalcitonin, median (Q1−3), ng/mL | 0.30(0.11−0.95) | 0.26(0.12−0.68) | 0.24(0.11−0.69) | 0.20(0.10−0.52) | <0.001 |
| Serum lactate, median (Q1−3), mmol/L | 1.5(1.1−2.2) | 1.5(1.1−2.0) | 1.45(1.1−2.0) | 1.40(1.2−2.4) | 0.01 |
| D dimer, median (Q1−3), ng/mL | 1450(705−4160) | 1274(649−3284) | 1060(590−2526) | 1008(529−2169) | <0.001 |
| Coexisting condition and comorbidities | |||||
| Arterial hypertension, n (%) | 349(39.3) | 1024(42.8) | 871(47.9) | 123(51.9) | <0.001 |
| Diabetes, n (%) | 171(19.3) | 484(20.3) | 459(27.5) | 72(30.4) | <0.001 |
| Coronary arterial disease, n (%) | 56(6.3) | 133(5.5) | 132(7.9) | 6(2.5) | 0.002 |
| COPD, n (%) | 49(5.5) | 134(5.6) | 154(9.2) | 28(11.8) | <0.001 |
| Chronic renal disease, n (%)e | 59(6.6) | 118(4.9) | 84(5.0) | 17(7.1) | 0.12 |
| Hematologic disease, n (%) | 45(5.0) | 62(2.6) | 51(3.0) | 2(0.8) | 0.001 |
| Asthma, n (%) | 54(6.9) | 131(5.5) | 123(7.3) | 21(8.8) | 0.03 |
| Autoimmune disease, n (%) | 24(2.7) | 74(3.1) | 49(2.9) | 9(3.8) | 0.83 |
| Chronic heart disease, n (%) | 32(3.6) | 71(2.9) | 63(3.7) | 9(3.8) | 0.51 |
| Neuromuscular disease, n (%) | 5(0.5) | 18(0.7) | 14(0.8) | 1(0.4) | 0.89 |
| Basic treatment at ICU admission | |||||
| Empiric Antibiotic treatment, n (%) | 750(84.6) | 1938(81.1) | 1351(80.8) | 185(78.1) | 0.04 |
| Corticosteroids, n (%) | 631(71.1) | 1717(71.8) | 1263(75.5) | 186(78.5) | 0.007 |
| Tocilizumab, n (%) | 165(18.6) | 479(20.0) | 340(20.3) | 38(16.0) | 0.34 |
| Oxygenation and ventilator support at ICU admission | |||||
| High Flow nasal cannula, n (%) | 242(27.3) | 629(26.3) | 492(29.4) | 64(27.0) | 0.18 |
| Non-invasive ventilation, n (%) | 54(6.0) | 140(5.8) | 127(7.6) | 14(5.91) | 0.14 |
| Invasive mechanical ventilation, n (%) | 358(40.4) | 984(41.2) | 703(42.0) | 110(46.4) | 0.37 |
| PaO2/FiO2, mean (IQR) | 132(102−168) | 129(101−157) | 123(94−150) | 122(84−145) | <0.001 |
| Invasive Mechanical ventilation days, median (Q1−3), | 10(4.7−22) | 10.5(5.0−22) | 11(5.1−23) | 13(6−26) | 0.001 |
| Complications | |||||
| Bacterial co-infection, n (%) | 72(8.1) | 187(7.8) | 154(9.2) | 13(5.5) | 0.16 |
| Ventilator associated pneumonia, n (%) | 193(21.8) | 515(21.5) | 386(23.1) | 52(21.9) | 0.69 |
| Shock at ICU admission, n (%) | 291(32.8) | 736(30.8) | 525(31.4) | 81(34.2) | 0.56 |
| Acute kidney dysfunction, n (%) | 217(24.5) | 556(23.3) | 459(27.5) | 71(30.0) | 0.006 |
| Myocardial dysfunction, n (%)j | 75(8.4) | 208(8.7) | 134(8.0) | 15(6.3) | 0.59 |
| CRRT, n (%) | 80(9.0) | 181(7.6) | 168(10.0) | 33(13.9) | 0.002 |
| ICU LOS, median (Q1−3), days | 14(7−28) | 14(7−26) | 15(8−27) | 16(8−32) | <0.001 |
| ICU crude mortality, n (%) | 250(28.2) | 677(28.3) | 480(28.7) | 72(30.4) | 0.91 |
| Hospital mortality, n (%) | 48/637(7.5) | 107/1713(6.2) | 50/1192(4.1) | 13/165(7.8) | 0.013 |
PaO2/FiO2: Arterial Oxygen blood pressure/Inspired oxygen fraction; APACHE II: Acute Physiology and Chronic Health Evaluation; SOFA: Sequential Organ Failure Assessment; Gap-diagnosis: days from onset of symptoms to diagnosis; Gap-ICU: days from hospital to ICU admission; COPD: Chronic Obstructive pulmonary Disease; CRRT: Continuous Renal Replacement Techniques; ICU: intensive care unit, LOS: length of stay.
Overall, ICU mortality was 28.5% (n = 1479). Despite more days of mechanical ventilation and ICU length of stay, crude ICU mortality in obese patients was not different (28.9%) compared to non-obese patients (28.3%). Strikingly in-hospital mortality was higher in non-obese patients (6.6% compared to those meeting obesity criteria (4.6% p = 0.016, Table 1). In addition, Class III obesity patients had hospital mortality (7.8%) like normal weight patients (7.5%, p = 0.88) but higher than obese patients (4.1%, p = 0.03, Table 2). Furthermore, no higher mortality was observed when considering only ventilated patients, 33.8% (498/1474) vs. 34.2% (823/2409, p = 0.80) for obese and non-obese patients, respectively. Un-adjusted ICU mortality was similar over time with a trend to a lower rate in the third wave (26.4%), concerning the second (27.6%) and first (29.6%, p = 0.11) waves.
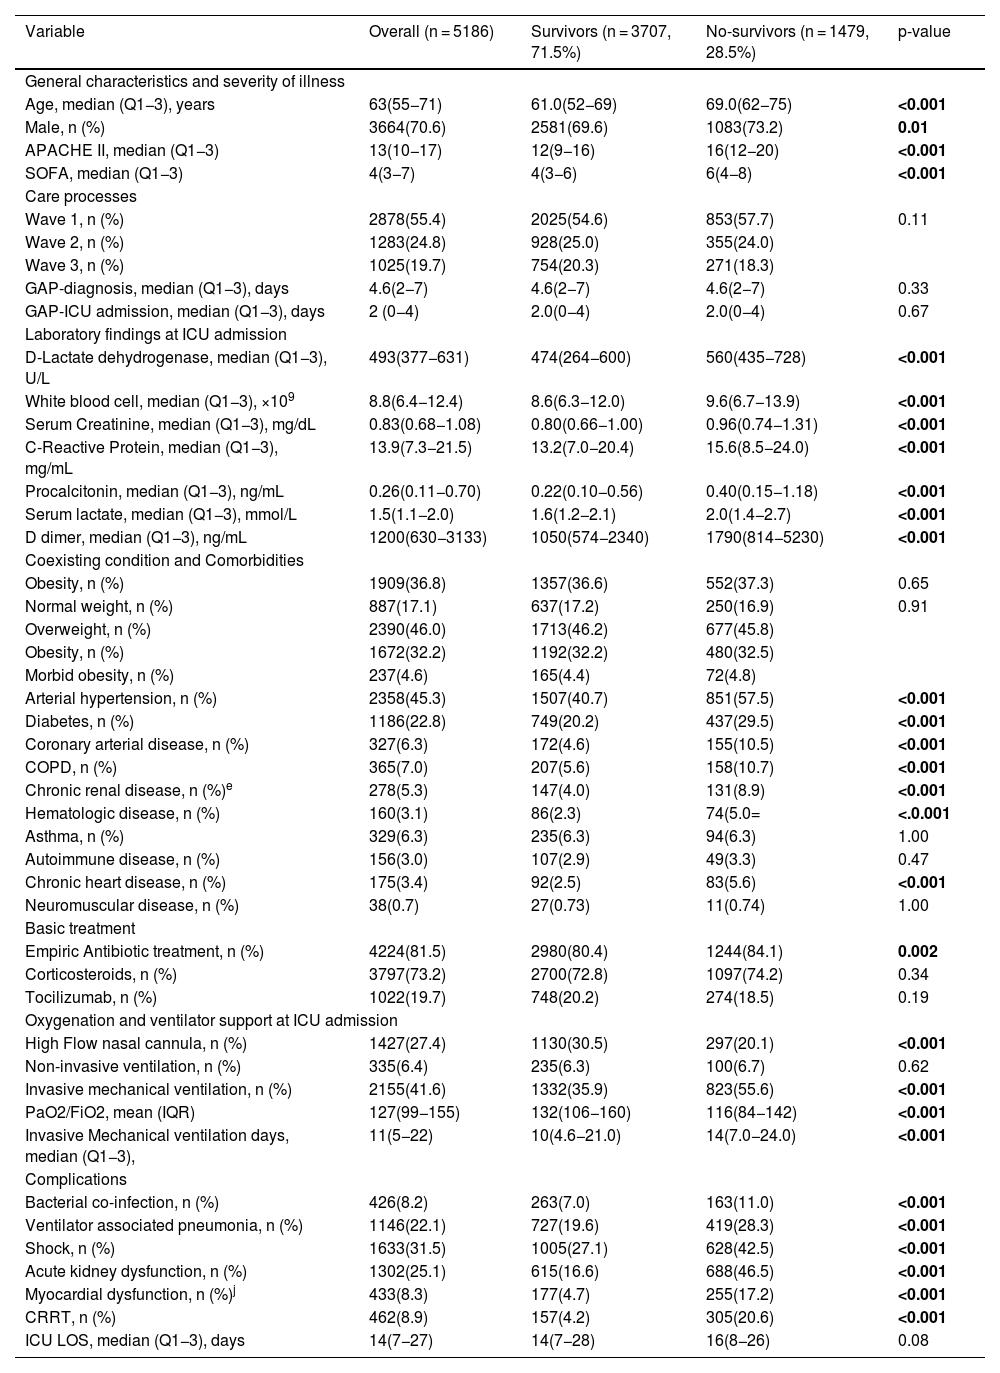
Non-survivors were older, had higher disease severity, had more comorbidities, and developed more complications than survivors (Table 3). To determine if a significant inter-hospital variation is present, multilevel conditional logistic modelling was done with patients nested in the hospital to characterise the hospital-level variation of ICU mortality. According to the intraclass correlation coefficient (ICC) obtained (0.07) when considering all hospital (n = 74), no significant inter-hospital variation was observed (Table S1, Supplementary material).
Characteristics of 5186 critically ill patients included in the study according to ICU outcome.
| Variable | Overall (n = 5186) | Survivors (n = 3707, 71.5%) | No-survivors (n = 1479, 28.5%) | p-value |
|---|---|---|---|---|
| General characteristics and severity of illness | ||||
| Age, median (Q1−3), years | 63(55−71) | 61.0(52−69) | 69.0(62−75) | <0.001 |
| Male, n (%) | 3664(70.6) | 2581(69.6) | 1083(73.2) | 0.01 |
| APACHE II, median (Q1−3) | 13(10−17) | 12(9−16) | 16(12−20) | <0.001 |
| SOFA, median (Q1−3) | 4(3−7) | 4(3−6) | 6(4−8) | <0.001 |
| Care processes | ||||
| Wave 1, n (%) | 2878(55.4) | 2025(54.6) | 853(57.7) | 0.11 |
| Wave 2, n (%) | 1283(24.8) | 928(25.0) | 355(24.0) | |
| Wave 3, n (%) | 1025(19.7) | 754(20.3) | 271(18.3) | |
| GAP-diagnosis, median (Q1−3), days | 4.6(2−7) | 4.6(2−7) | 4.6(2−7) | 0.33 |
| GAP-ICU admission, median (Q1−3), days | 2 (0−4) | 2.0(0−4) | 2.0(0−4) | 0.67 |
| Laboratory findings at ICU admission | ||||
| D-Lactate dehydrogenase, median (Q1−3), U/L | 493(377−631) | 474(264−600) | 560(435−728) | <0.001 |
| White blood cell, median (Q1−3), ×109 | 8.8(6.4−12.4) | 8.6(6.3−12.0) | 9.6(6.7−13.9) | <0.001 |
| Serum Creatinine, median (Q1−3), mg/dL | 0.83(0.68−1.08) | 0.80(0.66−1.00) | 0.96(0.74−1.31) | <0.001 |
| C-Reactive Protein, median (Q1−3), mg/mL | 13.9(7.3−21.5) | 13.2(7.0−20.4) | 15.6(8.5−24.0) | <0.001 |
| Procalcitonin, median (Q1−3), ng/mL | 0.26(0.11−0.70) | 0.22(0.10−0.56) | 0.40(0.15−1.18) | <0.001 |
| Serum lactate, median (Q1−3), mmol/L | 1.5(1.1−2.0) | 1.6(1.2−2.1) | 2.0(1.4−2.7) | <0.001 |
| D dimer, median (Q1−3), ng/mL | 1200(630−3133) | 1050(574−2340) | 1790(814−5230) | <0.001 |
| Coexisting condition and Comorbidities | ||||
| Obesity, n (%) | 1909(36.8) | 1357(36.6) | 552(37.3) | 0.65 |
| Normal weight, n (%) | 887(17.1) | 637(17.2) | 250(16.9) | 0.91 |
| Overweight, n (%) | 2390(46.0) | 1713(46.2) | 677(45.8) | |
| Obesity, n (%) | 1672(32.2) | 1192(32.2) | 480(32.5) | |
| Morbid obesity, n (%) | 237(4.6) | 165(4.4) | 72(4.8) | |
| Arterial hypertension, n (%) | 2358(45.3) | 1507(40.7) | 851(57.5) | <0.001 |
| Diabetes, n (%) | 1186(22.8) | 749(20.2) | 437(29.5) | <0.001 |
| Coronary arterial disease, n (%) | 327(6.3) | 172(4.6) | 155(10.5) | <0.001 |
| COPD, n (%) | 365(7.0) | 207(5.6) | 158(10.7) | <0.001 |
| Chronic renal disease, n (%)e | 278(5.3) | 147(4.0) | 131(8.9) | <0.001 |
| Hematologic disease, n (%) | 160(3.1) | 86(2.3) | 74(5.0= | <.0.001 |
| Asthma, n (%) | 329(6.3) | 235(6.3) | 94(6.3) | 1.00 |
| Autoimmune disease, n (%) | 156(3.0) | 107(2.9) | 49(3.3) | 0.47 |
| Chronic heart disease, n (%) | 175(3.4) | 92(2.5) | 83(5.6) | <0.001 |
| Neuromuscular disease, n (%) | 38(0.7) | 27(0.73) | 11(0.74) | 1.00 |
| Basic treatment | ||||
| Empiric Antibiotic treatment, n (%) | 4224(81.5) | 2980(80.4) | 1244(84.1) | 0.002 |
| Corticosteroids, n (%) | 3797(73.2) | 2700(72.8) | 1097(74.2) | 0.34 |
| Tocilizumab, n (%) | 1022(19.7) | 748(20.2) | 274(18.5) | 0.19 |
| Oxygenation and ventilator support at ICU admission | ||||
| High Flow nasal cannula, n (%) | 1427(27.4) | 1130(30.5) | 297(20.1) | <0.001 |
| Non-invasive ventilation, n (%) | 335(6.4) | 235(6.3) | 100(6.7) | 0.62 |
| Invasive mechanical ventilation, n (%) | 2155(41.6) | 1332(35.9) | 823(55.6) | <0.001 |
| PaO2/FiO2, mean (IQR) | 127(99−155) | 132(106−160) | 116(84−142) | <0.001 |
| Invasive Mechanical ventilation days, median (Q1−3), | 11(5−22) | 10(4.6−21.0) | 14(7.0−24.0) | <0.001 |
| Complications | ||||
| Bacterial co-infection, n (%) | 426(8.2) | 263(7.0) | 163(11.0) | <0.001 |
| Ventilator associated pneumonia, n (%) | 1146(22.1) | 727(19.6) | 419(28.3) | <0.001 |
| Shock, n (%) | 1633(31.5) | 1005(27.1) | 628(42.5) | <0.001 |
| Acute kidney dysfunction, n (%) | 1302(25.1) | 615(16.6) | 688(46.5) | <0.001 |
| Myocardial dysfunction, n (%)j | 433(8.3) | 177(4.7) | 255(17.2) | <0.001 |
| CRRT, n (%) | 462(8.9) | 157(4.2) | 305(20.6) | <0.001 |
| ICU LOS, median (Q1−3), days | 14(7−27) | 14(7−28) | 16(8−26) | 0.08 |
PaO2/FiO2: Arterial Oxygen blood pressure/Inspired oxygen fraction; APACHE II: Acute Physiology and Chronic Health Evaluation; SOFA: Sequential Organ Failure Assessment; Gap-diagnosis: days from onset of symptoms to diagnosis; Gap-ICU: days from hospital to ICU admission; COPD: Chronic Obstructive pulmonary Disease; CRRT: Continuous Renal Replacement Techniques; ICU: intensive care unit, LOS: length of stay.
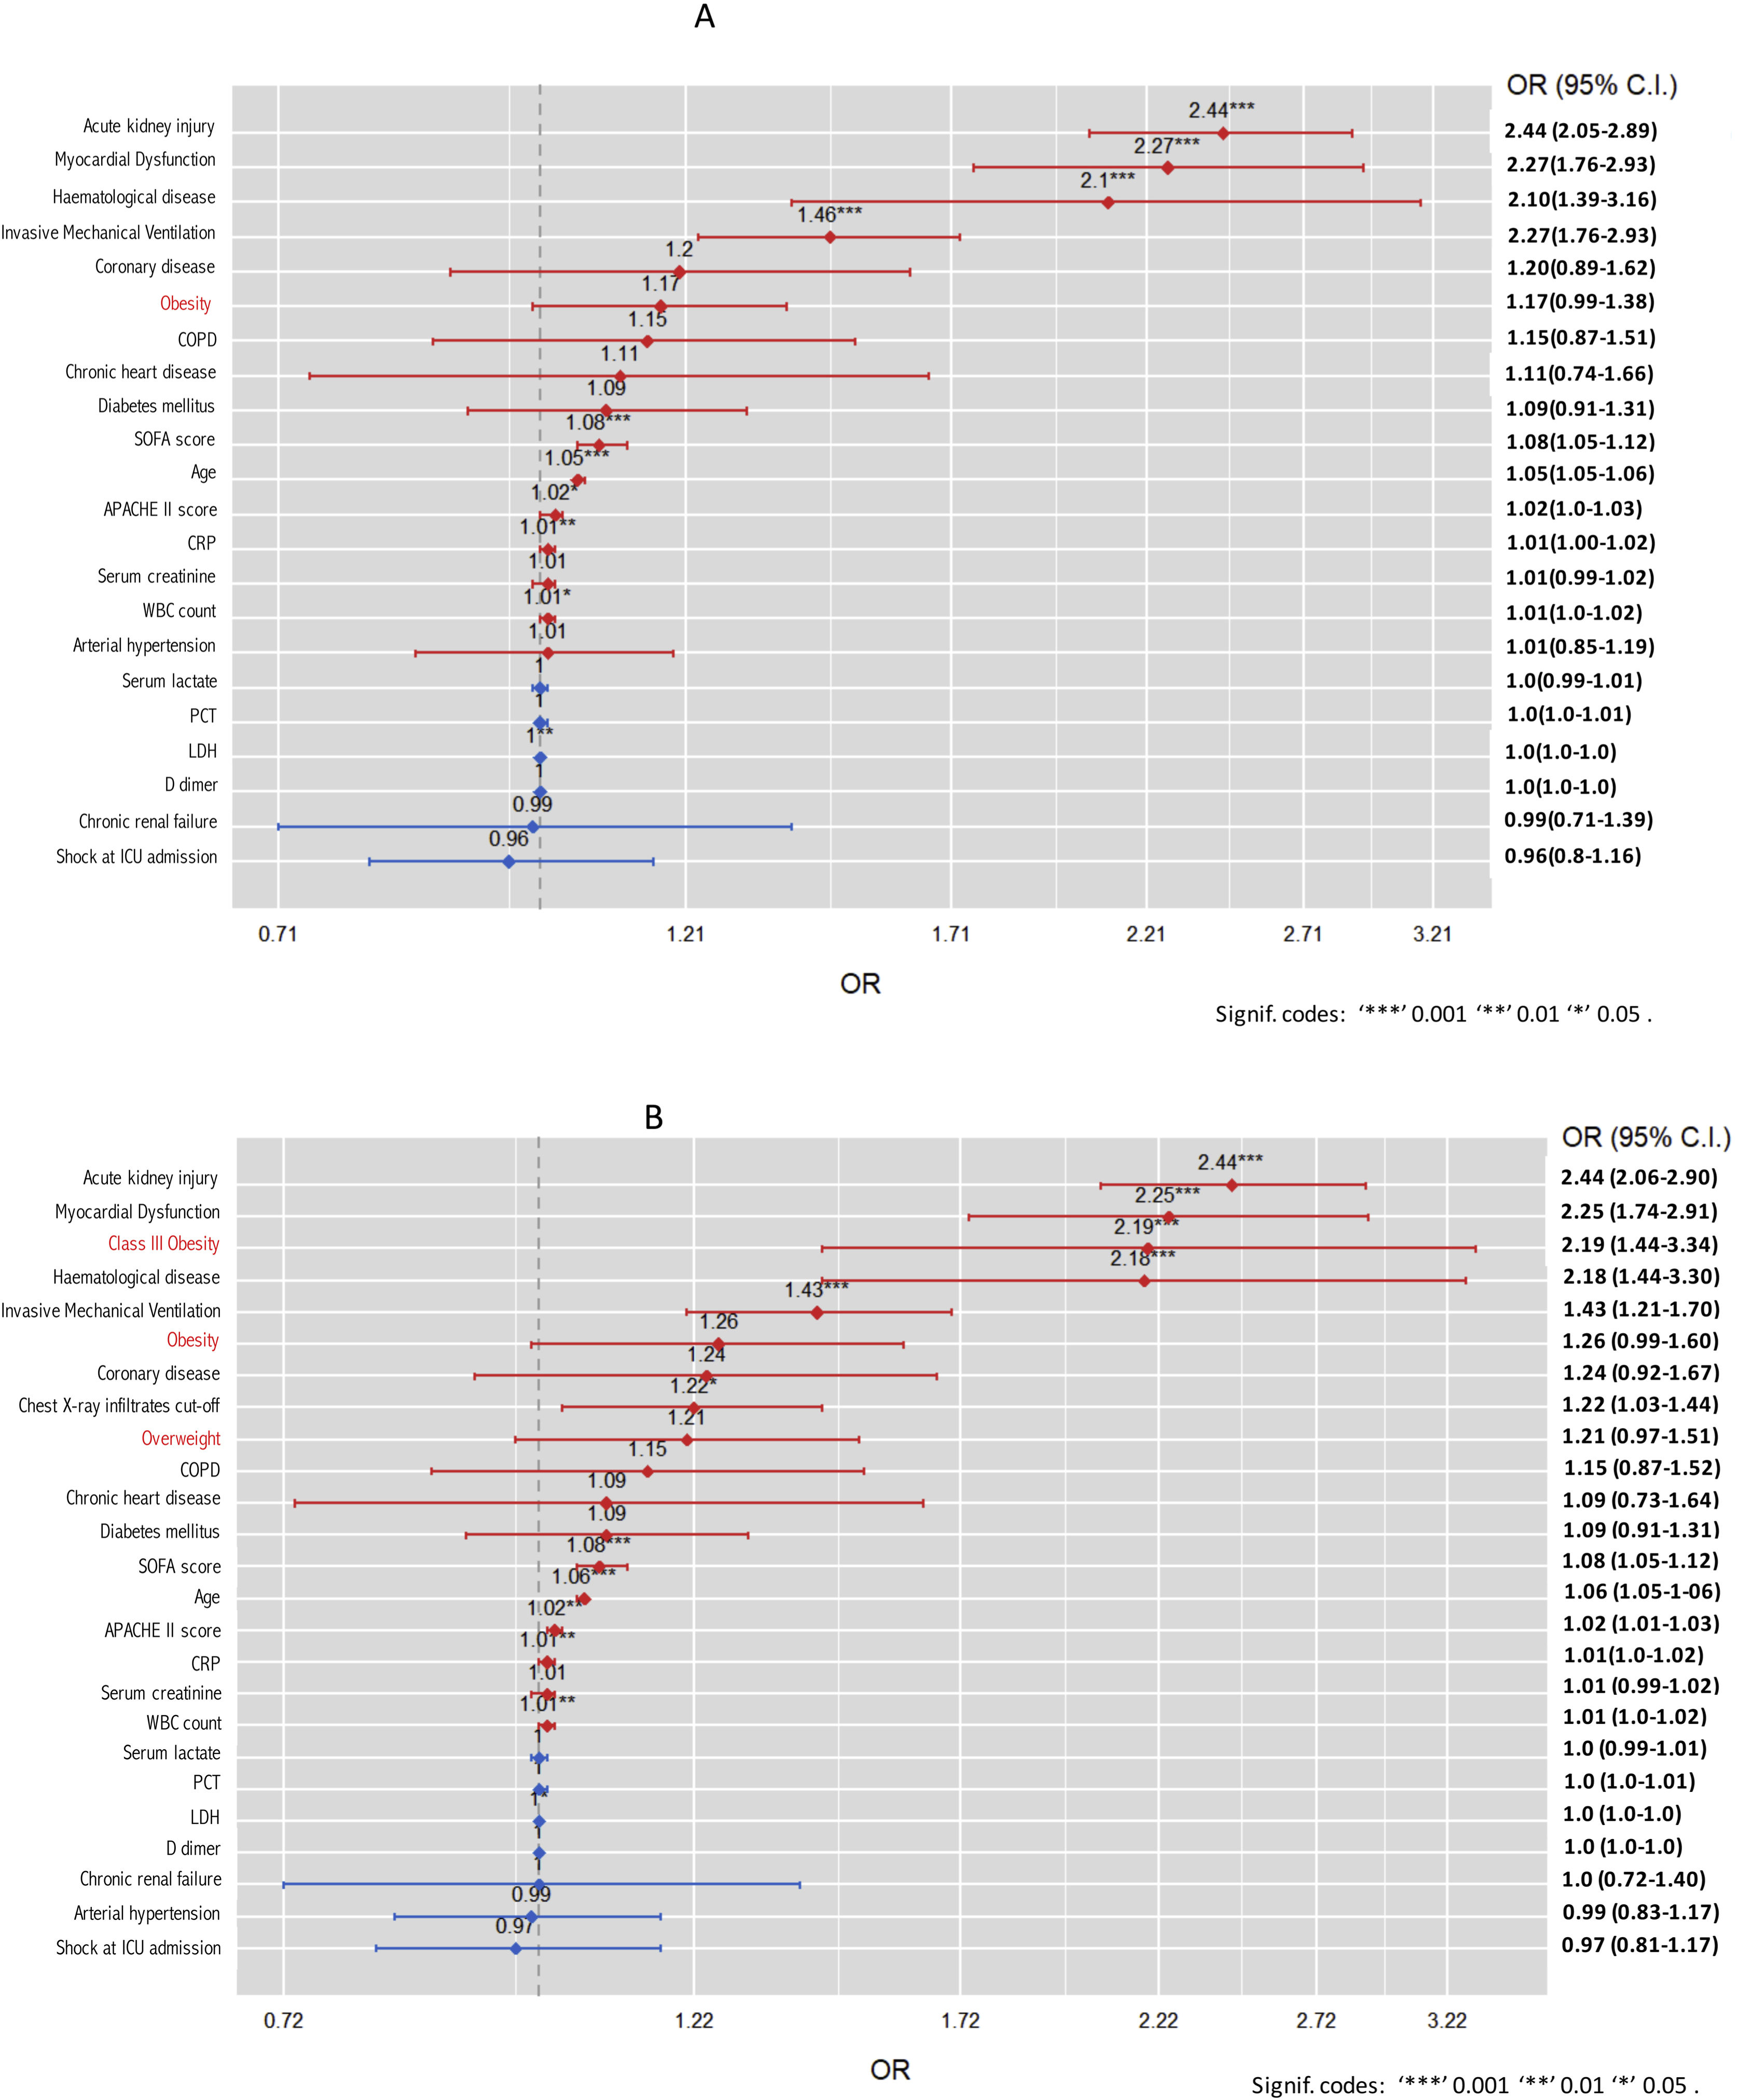
The models were constructed using ICU mortality as the dependent variable, and the independent variables included were: (1) age, (2) APACHE II, (3) SOFA, (4) serum lactate, (5) C-RP, (6) PCT, (7) serum creatinine, (8) WBC count, (8) LDH, (9) D dimer, (10) hypertension, (11) Haematologic disease, (12) chronic renal failure, (13) COPD, (14) chronic heart failure, (15) chronic coronary artery disease, (16) diabetes, (17) invasive mechanical ventilation on ICU admission, (18) AKI, (19) myocardial dysfunction, (20) presence of shock on ICU admission and the variable related to BMI as considered for the study.
When the BMI was included as a continuous variable in the model (BMI model), it was observed that BMI was independently associated with mortality (OR = 1.02, 95%CI 1.01–1.04). However, when obesity was included in the multiple regression model (model 1) as a dichotomous variable, it was observed that obesity was not independently associated with mortality (OR = 1.17 [95%CI 0.99–1.18]) (Fig. 2A). The performance of the BMI and 1 model were similar (Table S2 and Figure S4, Supplementary material).
 or when it has been included according to BMI categories (B).")
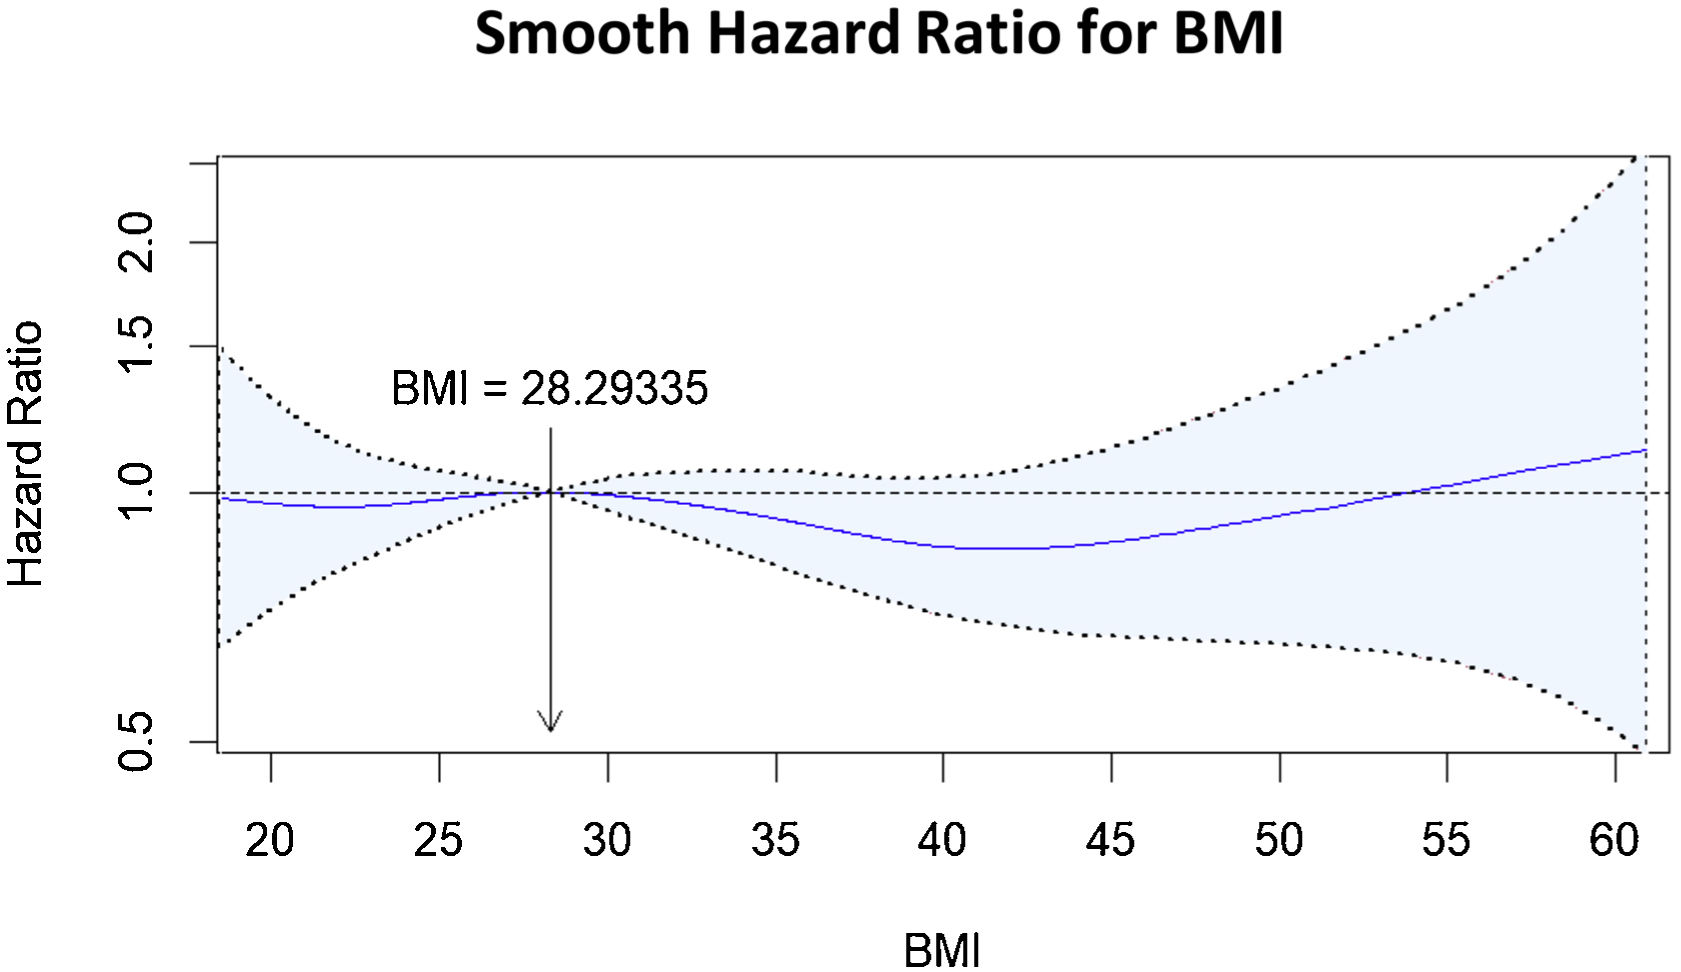
Finally, when BMI categories were included in the model (model 2), only Class III obesity (OR = 2.19; 95% CI: 1.44–3.34) was found to be independently associated with mortality (Fig. 2B). The performance of both models (1 vs. 2) was similar (Table S3, Supplementary material). This behaviour was also observed when performing the Cox proportional hazards regression model with a smooth, restricted cubic spline (Fig. 3).
Sensitivity analysis
The sensitivity analysis results can be seen in Figure S5 of the Supplementary material. In stratified analyses, the association of obesity with ICU mortality varied by age and sex, with a significant association of Class III obesity only among patients younger than 63 years and male. Interestingly, Class III obesity was associated with a higher mortality risk in non-diabetic patients and was not associated with hypertension.
Post-hoc analysisOf the 1909 obese patients, 237 (12.4%) met the criteria for Class III obesity. Patient characteristics can be seen in Table S4 of the Supplementary material. The groups were very similar except for age (54 vs. 62 years, p < 0.001) and the frequency of male sex (54.9% vs. 68.2%, p < 0.001), which was lower in class III patients. ICU stay was more extended (16 vs. 15 days, p < 0.001) in class III patients, without differences in crude mortality at ICU discharge (30.4% vs. 28.7%, p = 0.64) but achieving significance in-hospital mortality (7.8% vs. 4.1%, p = 0.04).
The characteristics of the subgroup of obese patients according to their evolution in the ICU are shown in Table S5 of the Supplementary material. Significant variables (age, male, APACHE II, SOFA, serum lactate, C-RP, PCT, serum creatinine, WBC count, LDH, D dimer, arterial hypertension, Haematologic disease, chronic renal failure, COPD, chronic heart failure, chronic coronary artery disease, diabetes, invasive mechanical ventilation on ICU admission, PaO2/FiO2 at ICU admission, AKI, myocardial dysfunction, presence of shock on ICU, bacterial coinfection ventilator-associated pneumonia and obesity/class III were included in the mortality regression model. Class III obesity was maintained as a variable independently associated with mortality in ICU (Figure S6).
DiscussionWe found that overall obesity was not associated with worse clinical outcomes manifested by mortality, need for invasive mechanical ventilation at ICU admission, or higher incidence of VAP compared to non-obese patients. Interestingly, critically ill patients with COVID-19 patients characterised with Class III obesity were independently associated with a higher ICU mortality. Of note, patients with obesity spent more days under invasive mechanical ventilation and consequently had a more extended ICU stay than non-obesity patients.
The value of this manuscript is that previous studies were performed on non-critically ill patients with a limited sample size. Our results coincide with those reported by Petrelli CM et al.4 but disagree with those observed by other authors.5–11 Petrilli CM et al.4 observed in 990 critically ill patients in New York State that only a BMI > 40 was independently associated with mortality (HR 1.71, 95% CI 1.10–2.7). In contrast, Peñuelas O et al.,11 in a multicenter study that included 868 patients with COVID-19 who required invasive mechanical ventilation, did not observe that obesity was associated with increased mortality. However, the study only considered obesity as a dichotomous variable, and this analysis coincides with our results in evaluating obesity as a dichotomous variable and highlights the need to study obesity by differentiating those patients with Class III obesity criteria. Other studies present results that are difficult to interpret. Docherty AB et al.5 reported in more than 20,000 hospitalised patients with SARS-CoV-2 infection in the United Kingdom that obesity was a strong predictor of mortality (HR 1.33, 95% confidence interval [CI] 1.19–1.49) after adjusting for other comorbidities. However, only 17% of them were ICU patients and the impact of obesity in this subgroup of critically ill patients is not reported. Bello-Chavolla OY et al.6 reported that obese patients, compared to non-obese patients, had a higher mortality rate (13.5% vs. 9.4%). However, this study only included 3% of critically ill patients, so the results should be interpreted with great caution.
Contrary to expectations, we did not observe a greater need for mechanical ventilation in obese patients compared to non-obese patients on admission to the ICU. Neither did we observe a more significant application of non-invasive ventilation despite a more remarkable alteration in oxygenation on admission to the ICU. However, obese patients were ventilated at a higher rate than non-obese patients during their ICU stay. We hypothesise that this more significant need for MVI may be related to abdominal fat deposition, increasing the respiratory workload to lift the chest wall. In addition, obesity may increase intra-abdominal pressure and restrict the downward movement of the diaphragm.23 All these alterations may lead to a more significant and earlier ventilatory failure during COVID-19 infection, which justifies our findings.
Contrary to this observation, Bello-Chavolla et al.,6 in a cohort of over 50,000 patients hospitalised for SARS-CoV-2, reported a higher need for ventilatory support in obese patients than non-obese patients (5.2% vs. 3.3%). However, the study only included 3% of ICU patients (n = 1893) and did not analyse these patients specifically, so the results do not apply to the ICU population. Furthermore, data from France7 evidenced a higher need for mechanical ventilation (OR = 7.36 [1.63–33.14] in critically ill patients with COVID-19 with BMI > 35 vs. those with BMI < 25. Finally, a recent meta-analysis24 reported that obesity is a significant risk factor for invasive mechanical ventilation (IMV) in patients with COVID-19. This association with obesity was only observed when body mass index (BMI) was considered a categorical variable. In contrast, when exposure-effect risk was calculated using the robust error meta-regression method, BMI was associated with IMV in a nonlinear fashion, and these data are in the direction of our results.8 Differences in population characteristics, risk analysis methodology, and the need for mechanical ventilation may explain the differences between studies.
Obesity has been associated with the secretion and expression of proinflammatory cytokines.14,15 Although we did not observe a higher level of inflammation or a significant correlation between controlled inflammatory biomarkers (CRP, PCT, D-dimer) and BMI, it is noteworthy that the presence of AKI and the need for CRRT was higher as BMI was higher than 30 kg/m2, which could be related to a higher level of inflammation that cannot be assessed with the usual biomarkers.
Finally, our study has shown discrepancies in the results depending on how BMI is analysed. It seems to be associated with mortality if BMI is analysed as a continuous variable (OR = 1.02). At the same time, this impact does not appear if it is analysed as a cut-off point to define obesity (BMI > 30) but reappears for Class III obesity when studying four cut-off points. According to the first analysis, mortality increases by 2% for each point increase in BMI. However, this relationship should be interpreted with caution since it is possible that the impact of the increase in BMI is not similar if it is still within the overweight range or if this increase conditions the fulfilment of the criteria for passing from obesity to Class III obesity. We consider that this relationship between BMI and mortality risk is best reflected in Fig. 3 (smooth HR), where it is observed that only high BMI values increase the risk of mortality.
Our study has important strengths. It is a multicentre study with a large number of critically ill patients and a robust statistical analysis, which confers homogeneity, internal validity and power to its results. However, it also has significant limitations that should be acknowledged. The first limitation is that it is a study on critically ill patients attended almost exclusively in Spain. Therefore, these findings can only be extrapolated to other types of patients or other healthcare systems with prior validation. Second, although our study confirmed the positive association between COVID-19 severity and class III obesity, we do not have data on the type of fat in our patients. Since visceral adiposity has been reported to be more predictive of the risk of death than subcutaneous fat, our results should be interpreted cautiously in the context of an observational study during the pandemic due to classifying obesity only by BMI, which may overlook the role of the distribution of fat and sarcopenia, which may increase the risk of death.
Third, due to the characteristics of the registry, no data on evolution at hospital discharge have been recorded. Although this data is essential to measure hidden mortality after hospital discharge, the in-hospital mortality of 7% suggests a high post-hospital survival rate. On the other hand, our focus has been on short-term mortality, most closely related to acute illness.
Fourth, the characteristics of pulmonary mechanics in ventilated patients may vary concerning the presence or absence of obesity. Due to the characteristics of the database developed during the pandemic, no data on aspects of pulmonary mechanics that could be related to patient outcomes were recorded, so the results of the present study should be assessed with this limitation in mind.
Finally, we have not found differences between markers of obesity-associated systemic inflammation. Considering that we did not have data on more specific biomarkers of inflammation, such as IL-1 or TNF, our findings should be interpreted with caution, as the inflammatory state secondary to obesity may be underestimated. However, these biomarkers are only sometimes used in routine practice.
ConclusionOur results corroborate international recommendations, which strongly recommend that patients with a BMI of 40 kg/m2 or higher are at high risk of poor COVID-19 results and should, therefore, strongly consider the need for an effective vaccination plan and prolonged social distancing.
Author contributionsAR, IML, GM, ED, MB, CF, MS, JMC, AE, JSV, RZ, LS, MBS, and JG had substantial contributions to conception and design of the work.
ST, AR, JCPL, SSC, JCB, MVO, ACB and AAM had substantial contribution for data acquisition.
AR, IML, MB, ED, RZ, MS, JMC and JSV had substantial contribution for data analysis and interpretation of data for the work.
AR, IML, ED, GM, and MB drafting of the manuscript.
MIR, JJG, RZ, LFR, MBS and JG critically reviewed the draft manuscript.
The corresponding author (AR) had full access to all the data in the study and takes responsibility for the integrity of the data and the accuracy of the data analysis. All authors approved the final version of the manuscript. The views expressed in this article are those of the authors and not necessarily those of the SEMICYUC.
Declarations section
- Ethical Approval and Consent to participate
The study was approved by Institution’s Internal Review Board (Comitè Ètic d’Investigació amb Medicaments [CEIm] from Institut d’Investigació Sanitària Pere Virgili [IISPV] - IRB# CEIM/066/2020) and each participating site with a waiver of informed consent.
- Availability of supporting data
The data supporting the conclusions of this study are available from the Sociedad de Medicina Intensiva, Critica y Unidades Coronarias (SEMICYUC), but restrictions apply to the availability of these data, which were used under SEMICYUC authorization for the present study and are therefore not publicly available. However, the data can be obtained from the corresponding author (AR) upon reasonable request and with the permission of SEMICYUC.
FundingThis study was supported by the Spanish Intensive Care Society (SEMICYUC) and Ricardo Barri Casanovas Foundation (AR, MB). The study sponsors have no role in the study design, data collection, data analysis, data interpretation, or writing of the report.
To the COVID-19 SEMICYUC Investigators listed in Appendix 2 (supplementary material).
The following is Supplementary data to this article:
articles