


Insulin resistance assessment requires sophisticated methodology of difficult application. Therefore, different estimators for this condition have been suggested. The aim of this study was to evaluate the triglycerides and glucose (TyG) index as a marker of insulin resistance and to compare it to the triglycerides/HDL cholesterol ratio (TG/HDL-C), in subjects with and without metabolic syndrome (MS).
Materials and methodsAn observational, cross-sectional study was conducted on 525 adults of a population from Bahia Blanca, Argentina, who were divided into two groups: with MS (n=89) and without MS (n=436). The discriminating capacities for MS of the TyG index, calculated as Ln (TG [mg/dL]×glucose [mg/dL]/2), and the TG/HDL-C ratio were evaluated. Pre-test probability for MS was 30%.
ResultsThe mean value of the TyG index was higher in the group with MS as compared to the group without MS and its correlation with the TG/HDL-C ratio was good. The cut-off values for MS in the overall population were 8.8 for the TyG index (sensitivity=79%, specificity=86%), and 2.4 for the TG/HDL-C ratio (sensitivity=88%, specificity=72%). The positive likelihood ratios and post-test probabilities for these parameters were 5.8 vs 3.1 and 72% vs 58% respectively. The cut-off point for the TyG index was 8.8 in men and 8.7 in women; the respective values for TG/C-HDL were 3.1 in men and 2.2 in women.
ConclusionsThe TyG index was a good discriminant of MS. Its simple calculation warrants its further study as an alternative marker of insulin resistance.
La evaluación de la insulinorresistencia requiere de metodología sofisticada de difícil aplicación. Por lo cual se han sugerido distintos estimadores de esta condición. El objetivo de este estudio fue evaluar el índice triglicéridos y glucosa (TyG) como marcador de insulinorresistencia y compararlo con la relación triglicéridos y colesterol-HDL (TG/C-HDL), en individuos con y sin síndrome metabólico (SM).
Material y métodosSe realizó un estudio observacional, transversal, en 525 individuos adultos de una población de Bahía Blanca, Argentina, quienes fueron divididos en dos grupos: con SM (n=89) y sin SM (n=436). Se evaluaron las capacidades discriminativas para SM del índice TyG, calculado como Ln (TG [mg/dL] x glucosa [mg/dL]/2), y de la relación TG/C-HDL. Probabilidad pretest para SM=30%.
ResultadosEl valor medio del índice TyG fue mayor en el grupo con SM comparado con el grupo sin SM y fue buena su correlación con TG/C-HDL. Los puntos de corte para SM en la población total fueron: 8,8 para el índice TyG (sensibilidad=79%, especificidad=86%), y 2,4 para la relación TG/C-HDL (sensibilidad=88%, especificidad=72%). Las razones de probabilidad y probabilidades postest positivas para dichos parámetros fueron 5,8 vs. 3,1 y 72% vs. 58%, respectivamente. El punto de corte para el índice TyG en hombres fue 8,8 y en mujeres 8,7; los valores respectivos para TG/C-HDL fueron 3,1 en hombres y 2,2 en mujeres.
ConclusionesEl índice TyG fue un buen discriminante de SM. La simplicidad de su cálculo justifica profundizar su estudio como marcador alternativo de insulinorresistencia.
Insulin resistance (IR) involves decreased cell sensitivity to insulin and is a central characteristic of metabolic syndrome (MS).1 IR predisposes to several metabolic disorders including hyperglycemia, high blood pressure, and dyslipidemia, all of them strongly associated with diabetes, atherosclerosis, and cardiovascular disease.
The evaluation of IR requires sophisticated methods which are not available for use in daily clinical practice.2 Hyperinsulinemic–euglycemic clamp is the direct method to measure IR and is considered the “gold standard” procedure, but it is difficult to perform in daily practice. Several surrogate markers have therefore been proposed, including the homeostatic model assessment of IR (HOMA-IR), one of the most widely used. HOMA-IR is calculated based on the measurement of fasting glucose and insulin levels.3 There are two issues to be considered with regard to insulin. On the one hand, insulin has a high biological variability (within- and between-subject variability of 21.1% and 58.3% respectively),4 and on the other hand, its measurement has yet to be standardized.5,6 These two aspects have a direct impact on the estimation of IR using the HOMA-IR index and other formulas which have been developed using insulin level in their calculations (QUICKI, FGIR, Raynaud, reciprocal insulin).7
Because of these difficulties, attempts have been made to identify other parameters that could be helpful for assessing IR. In fact, indices to determine insulin action based on lipids may help identify subjects with IR.8 Hypertriglyceridemia and hypoalphalipoproteinemia is the characteristic dyslipidemia in subjects with IR.9,10 Although no definitive explanation is still available for the correlation between hypertriglyceridemia and IR, it has been reported that elevated triglyceride (TG) levels interfere with glucose metabolism in muscles,11 a finding consistent with the hypothesis that TG elevation in serum and tissue is related to decreased insulin sensitivity.12 In this regard, the relationship between plasma levels of TG and HDL cholesterol (TG/HDL-C) has been proposed as a useful alternative for estimating insulin action,13 and in 2010 Guerrero et al. showed that the product of TG and glucose in plasma, the so-called triglycerides and glucose index (TyG), could be a useful estimate of IR.14 This index was compared to the hyperinsulinemic–euglycemic clamp, and was shown to have good sensitivity and specificity for IR detection. Its association with carotid atherosclerosis has been shown.15 Reaven et al. also showed the index to be similar to the TG/HDL-C ratio and comparable to estimates using fasting insulin levels.8
Salazar et al., based on a study conducted on an Argentine population, suggested that both the diagnosis of MS and the TG/HDL-C ratio are adequate for identifying subjects with IR.16
Based on the foregoing and considering MS as a prediabetic state or a state of decreased cell sensitivity to insulin,17–20 the TyG index was assessed as an IR marker and was compared to the TG/HDL-C ratio in subjects with and without MS in an adult population from Bahía Blanca, Argentina.
Patients and methodsAn observational, cross-sectional study was conducted on a working population attending during the 2009–2011 period the preventive medicine department of Dr. Leónidas Lucero Hospital in Bahía Blanca, province of Buenos Aires, Argentina to undergo tests necessary for obtaining the working health certificate required by the Bahía Blanca local authority.
The estimated sample size to assess diagnostic tests with paired observations, assuming a 95% confidence level, 90’% power, and a 30% prevalence of MS,21 was 454 subjects. In order to ensure this minimum sample size, 525 adult subjects (329 men and 196 women) aged 18–68 years were enrolled into the study.
Pregnant women and subjects with inflammatory and infectious conditions, taking anti-inflammatory treatment and who had practiced strenuous exercise on the days prior to blood sampling were excluded from the study. Subjects with values of high sensitivity C-reactive protein greater than 10.0mg/L, suggesting the presence of a significant inflammatory condition, were also excluded.22
All subjects were evaluated by medical staff using a questionnaire and a clinical examination, according to the procedure of the preventive medicine department.
The data recorded included: age, sex, smoking, medication received (hypoglycemic, antihypertensive, lipid-lowering, anti-inflammatory and other drugs), weight, height, waist circumference, body mass index, blood pressure, and observations made at the clinical examination.
Anthropometric measures were taken using standard procedures.23 Waist circumference (cm) was measured halfway between the lower lateral margin of the last rib and the anterior superior region of the iliac crest while standing, using a flexible, not distensible measuring tape. Body mass index was calculated as weight (kg)/height (m)2. Blood pressure was measured using a sphygmomanometer and recorded in mmHg.
Blood samples for biochemical tests were drawn in the morning, after a 12h fast, by puncturing an antecubital vein, and were collected into tubes containing anticoagulant (heparin sodium).
All measurements were performed in an ADVIA1200 autoanalyzer (Siemens Medical Healthcare, Germany) using reagents of the same manufacturer. Plasma glucose levels were measured using a glucose-oxidase/Trinder's enzymatic colorimetric method with an end-point reaction. TG levels were measured using a glycerol-phosphate-oxidase/Trinder's enzymatic colorimetric method, with no serum blank, with an end-point reaction. HDL-C was measured using a direct catalase elimination method with a two-point kinetic reaction. High sensitivity C-reactive protein was tested using an immunoturbidimetric procedure.
The TyG index was calculated as the natural logarithm (Ln) of the product of plasma glucose and TG using the formula: Ln (TG [mg/dL]×glucose [mg/dL]/2).14 The TG/HDL-C ratio was calculated.
Study participants were divided into two groups: with MS (n=89, 64 men and 25 women) and without MS (n=436, 265 men and 171 women) using the criteria for MS of the National Heart, Lung, and Blood Institute and the American Heart Association,24 according to which this condition is diagnosed as the presence of three or more of the following risk factors: abdominal obesity (waist circumference >102cm in men and >88cm in women), hypertriglyceridemia (TG ≥150mg/dL or drug treatment for hypertriglyceridemia), low HDL-C level (<40mg/dL in men and <50mg/dL in women or drug treatment for decreased HDL-C), high blood pressure (BP ≥130/85mmHg or drug treatment for hypertension), impaired fasting glucose (fasting glucose ≥100mg/dL or drug treatment for hyperglycemia).
Statistical and epidemiological analysis of data was performed using the Statistical Package for Social Sciences for Windows (version 15.0, Chicago, IL, USA) and the Program for Epidemiological Analysis of Tabulated Data (version 3.1. Xunta de Galicia, Pan American Health Organization). The normality of the variables was verified using a Kolmogorov–Smirnov test. A Chi-square test was used to compare proportions. To compare mean values of parametric variables, a Student's t test, an ANOVA test, and Cohen's “d” to assess effect size25 were used. Medians of nonparametric variables were compared using a Mann–Whitney test and Cliff's delta26 to assess effect size. Correlation between the TyG index and the TG/HDL-C ratio was calculated using Spearman's rho. ROC curves were constructed, the area under the curve (AUC) of both parameters was compared using the DeLong method,27 and the cut-off points with the greatest discriminatory capacity for MS were obtained. The sensitivity, specificity, odds ratio, and post-test probability of those cut-off points were estimated, with a pre-test probability of 0.30 in the overall population being assumed for MS, 0.34 in men and 0.25 in women.21
Differences were considered significant for a value of p less than 5%.28,29
The study was approved by the ethics committee of Dr. Leónidas Lucero Hospital, and informed consent was obtained from all participating subjects.
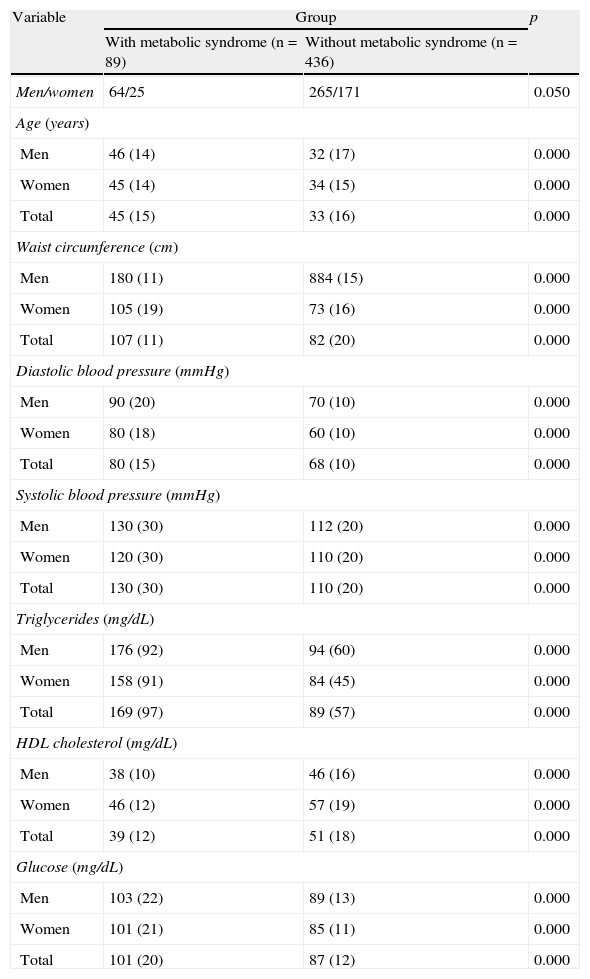
ResultsTable 1 shows the results of the assessed variables found in both groups (with and without MS), which were significantly different.
Results of the variables tested in the assessed groups (with and without metabolic syndrome).
| Variable | Group | p | |
| With metabolic syndrome (n=89) | Without metabolic syndrome (n=436) | ||
| Men/women | 64/25 | 265/171 | 0.050 |
| Age (years) | |||
| Men | 46 (14) | 32 (17) | 0.000 |
| Women | 45 (14) | 34 (15) | 0.000 |
| Total | 45 (15) | 33 (16) | 0.000 |
| Waist circumference (cm) | |||
| Men | 180 (11) | 884 (15) | 0.000 |
| Women | 105 (19) | 73 (16) | 0.000 |
| Total | 107 (11) | 82 (20) | 0.000 |
| Diastolic blood pressure (mmHg) | |||
| Men | 90 (20) | 70 (10) | 0.000 |
| Women | 80 (18) | 60 (10) | 0.000 |
| Total | 80 (15) | 68 (10) | 0.000 |
| Systolic blood pressure (mmHg) | |||
| Men | 130 (30) | 112 (20) | 0.000 |
| Women | 120 (30) | 110 (20) | 0.000 |
| Total | 130 (30) | 110 (20) | 0.000 |
| Triglycerides (mg/dL) | |||
| Men | 176 (92) | 94 (60) | 0.000 |
| Women | 158 (91) | 84 (45) | 0.000 |
| Total | 169 (97) | 89 (57) | 0.000 |
| HDL cholesterol (mg/dL) | |||
| Men | 38 (10) | 46 (16) | 0.000 |
| Women | 46 (12) | 57 (19) | 0.000 |
| Total | 39 (12) | 51 (18) | 0.000 |
| Glucose (mg/dL) | |||
| Men | 103 (22) | 89 (13) | 0.000 |
| Women | 101 (21) | 85 (11) | 0.000 |
| Total | 101 (20) | 87 (12) | 0.000 |
Data are given as median (interquartile range).
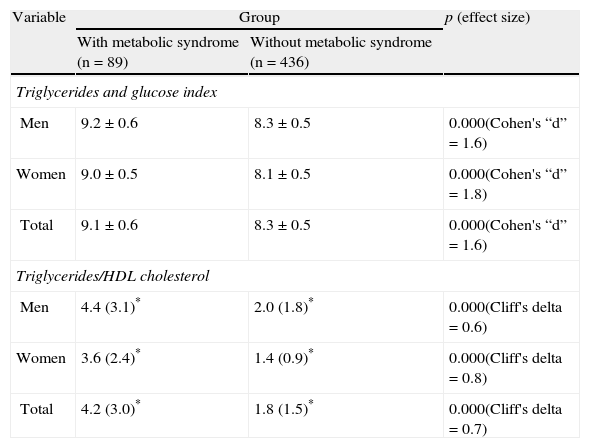
As shown in Table 2, the group with MS had higher values of the mean TyG index and median TG/HDL-C ratio as compared to the group without MS.
Results of the triglycerides and glucose index and the triglycerides/HDL-C ratio in the assessed groups (with and without metabolic syndrome).
| Variable | Group | p (effect size) | |
| With metabolic syndrome (n=89) | Without metabolic syndrome (n=436) | ||
| Triglycerides and glucose index | |||
| Men | 9.2±0.6 | 8.3±0.5 | 0.000(Cohen's “d”=1.6) |
| Women | 9.0±0.5 | 8.1±0.5 | 0.000(Cohen's “d”=1.8) |
| Total | 9.1±0.6 | 8.3±0.5 | 0.000(Cohen's “d”=1.6) |
| Triglycerides/HDL cholesterol | |||
| Men | 4.4 (3.1)* | 2.0 (1.8)* | 0.000(Cliff's delta=0.6) |
| Women | 3.6 (2.4)* | 1.4 (0.9)* | 0.000(Cliff's delta=0.8) |
| Total | 4.2 (3.0)* | 1.8 (1.5)* | 0.000(Cliff's delta=0.7) |
Data are given as mean±standard deviation and (*) as median (interquartile range).
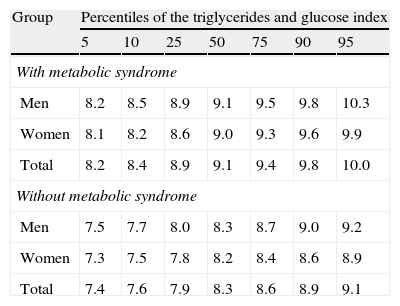
Table 3 gives the percentiles of the TyG index in both groups, showing that the value of the 50th percentile of the TyG index in the group with MS agreed with the value of the 90th percentile in the group without MS.
Values of percentiles of the triglycerides and glucose index in the assessed groups (with and without metabolic syndrome).
| Group | Percentiles of the triglycerides and glucose index | ||||||
| 5 | 10 | 25 | 50 | 75 | 90 | 95 | |
| With metabolic syndrome | |||||||
| Men | 8.2 | 8.5 | 8.9 | 9.1 | 9.5 | 9.8 | 10.3 |
| Women | 8.1 | 8.2 | 8.6 | 9.0 | 9.3 | 9.6 | 9.9 |
| Total | 8.2 | 8.4 | 8.9 | 9.1 | 9.4 | 9.8 | 10.0 |
| Without metabolic syndrome | |||||||
| Men | 7.5 | 7.7 | 8.0 | 8.3 | 8.7 | 9.0 | 9.2 |
| Women | 7.3 | 7.5 | 7.8 | 8.2 | 8.4 | 8.6 | 8.9 |
| Total | 7.4 | 7.6 | 7.9 | 8.3 | 8.6 | 8.9 | 9.1 |
As shown in Fig. 1, the mean value of the TyG index increased as the number of MS components (p=0.000) in the total study population increased. There was a good correlation between the TyG index and the TG/HDL-C ratio (Spearman's rho=0.896), and the AUC for both parameters was greater than 0.75. Fig. 2 shows that there were no significant differences (p=0.343) between the AUC obtained for the TyG index (0.88; 95% CI=0.84–0.92) and the AUC for the TG/HDL-C ratio (0.85; 95% CI=0.81–0.90) as regards discriminating for MS, with the value of the TyG index of 8.8 and the value of 2.4 for the TG/HDL-C ratio showing the greatest sensitivity and specificity for discriminating MS in the study population.


After stratification by sex, a good correlation was found between the TyG index and the TG/HDL-C ratio in both men and women (Spearman's rho=0.903 and 0.883). AUC was greater than 0.75 in both cases. The cut-off points discriminating MS were 8.8 and 8.7 for men and women respectively in the TyG index; the corresponding values for the TG/HDL-C were 3.1 and 2.2 for men and women respectively.
Table 4 shows the indicators used to determine the discriminatory capacity of the cut-off points obtained for the TyG index and the TG/HDL-C ratio in the study groups.
Evaluation of the cut-off points found for the triglycerides and glucose index and for the triglycerides/cholesterol HDL ratio for discriminating metabolic syndrome.
| Triglycerides and glucose index | Triglycerides/HDL-C ratio | |||||
| Men | Women | Total | Men | Women | Total | |
| Cut-off point | 8.8 | 8.7 | 8.8 | 3.1 | 2.2 | 2.4 |
| Sensitivity95% CI | 84%75–94% | 72%52–92% | 79%70–88% | 77%65–88% | 84%68–100% | 88%80–95% |
| Specificity95% CI | 82%78–87% | 91%87–96% | 86%83–88% | 74%69–80% | 84%78–90% | 72%67–76% |
| Positive OR95% CI | 4.83.6–6.3 | 8.24.8–14.1 | 5.84.5–7.5 | 3.02.3–3.8 | 5.33.6–7.8 | 3.12.6–3.7 |
| Negative OR95% CI | 0.20.1–0.3 | 0.30.2–0.6 | 0.30.2–0.4 | 0.20.2–0.5 | 0.20.1–0.5 | 0.20.1–0.3 |
| Pre-testprobability for MS | 0.34(34%) | 0.25(25%) | 0.30(30%) | 0.34(34%) | 0.25(25%) | 0.30(30%) |
| Positivepost-test probability | 0.71(71%) | 0.73(73%) | 0.72(72%) | 0.61(61%) | 0.64(64%) | 0.58(58%) |
| Negativepost-test probability | 0.09(9%) | 0.09(9%) | 0.09(9%) | 0.09(9%) | 0.06(6%) | 0.07(7%) |
95% CI: 95% confidence interval, OR: odds ratio, MS: metabolic syndrome.
In this study, in agreement with previously reported data,8,14–16 the TyG index had a normal distribution in the study population, which is advantageous for statistical analysis and the interpretation of data. By contrast, the TG/HDL-C ratio followed a nonparametric distribution.
Mean TyG index and median TG/HDL-C ratio were markedly higher in subjects with MS as compared to those without MS. In the latter group, 95% of subjects had TyG index values lower than the 50th percentile of the index in the group of subjects with MS. Mean TyG index also increased as the number of MS components increased, and a good correlation was found between the TyG index and the TG/HDL-C ratio.
These data are consistent with prior evidence supporting the value of the TyG index and the TG/HDL-C ratio as IR markers. Guerrero-Romero et al.14 suggested, based on their study in a population with and without changes in glucose metabolism, that the TyG index could be helpful for assessing IR because it showed a high sensitivity (96.5%) and specificity (85.0%) when it was assessed as compared to the hyperinsulinemic–euglycemic clamp. Abbasi and Reaven8 also concluded, in a study conducted on a nondiabetic population, that the TyG index and the TC/HDL-C ratio had a moderate correlation, as did indices using fasting insulin, with a direct method for assessing insulin-mediated glucose uptake, suggesting that alternative IR markers based on lipid measurement are helpful for detecting subjects with IR when faced with the problems related to insulin measurement and action.
Because of the similarity of the cut-off points of the TyG index for discriminating MS in men (8.8) and women (8.7) found in this study, sex stratification may be considered as unnecessary, which is relevant for its use in daily clinical practice. In this regard, the TyG index of 8.8 obtained without sex stratification was the cut-off point with the greatest sensitivity and specificity for discriminating MS, and thus IR. Further studies are however needed to validate this index in other populations to generalize a cut-off value, taking into account the difficulties in obtaining access to reliable IR assessment.
For the TG/HDL-C ratio, the value discriminating MS in the overall population was 2.4, but in contrast to the TyG index, different values were seen after sex stratification. The cut-off points reported in this study were 2.2 for women and 3.1 for men, similar to the values reported by Salazar et al. to discriminate IR in an Argentine population (2.5 for women and 3.5 for men).16
ROC curve analysis showed that both the TyG index and the TG/HDL-C ratio were good at discriminating MS in the study population, showing a similar capacity to discriminate this condition. The cut-off point of the TyG index was more specific than the TG/HDL-C ratio for MS.
Evaluation of the diagnostic accuracy of the TyG index found that it was 5.8 times more likely that a result higher than 8.8 belongs to a subject with MS than to a subject without MS. This value converts the pre-test probability of 0.30 into a positive post-test probability of 0.72, which means that, in the study population, a subject with a TyG index greater than 8.8 would have a 72% probability of having MS and/or, as a consequence, IR.
When the cut-off point of 2.4 of the TG/HDL-C ratio was evaluated in the total population, a higher cut-off point was found to be 3.1 times more likely to belong to a subject with MS than to a subject without MS, a lower probability than that found for the TyG index.
The positive post-test probability of having MS with a result higher than 2.4 was found to be 58%, which was lower than that obtained by the TyG index (72%).
In this study, upon sex stratification, positive post-test probabilities did not substantially differ from those of the overall population, and although the value of the TG/HDL-C ratio to discriminate MS slightly improved when the respective cut-off points for men and women were taken into consideration, it did not improve the performance of the TyG index.
On the other hand, the negative post-test probabilities of both parameters may be considered to be similar.
In addition to its value for discriminating MS, the TyG index has a methodological advantage over the TG/HDL-C ratio because it requires the measurement of glucose instead of HDL-C. The disadvantage of measuring HDL-C is that there are various methodological principles that still require clarification.
TGs, like insulin, have a great within-subject (19.9%) and between-subject biological variability (32.7%),4 but unlike insulin measurement, the testing of TG by enzymatic methods is standardized and analytically and financially accessible to all clinical laboratories. The TyG index therefore has an analytical advantage over indices using insulin measurement to assess IR.
As regards the limitations of this study, potential biases may include an imperfect reference test because of the lack of direct IR measurement and the fact that subjects were assessed only once, so that within-subject biological variability of biochemical and clinical measurements could not therefore be minimized.
Based on the foregoing, it can be stated that the TyG index may be considered to be very helpful for IR assessment in the population. The simplicity of calculation of the TyG index from two routine, low cost biochemical measurements warrants further investigation of its role as an alternative evaluator of IR in order to improve the detection of subjects with a high cardiometabolic risk and so facilitate the prevention of the development of chronic diseases associated with IR.
Conflicts of interestThe authors state that they have no conflicts of interest.
Please cite this article as: Unger G, Benozzi SF, Perruzza F, Pennacchiotti GL. Índice triglicéridos y glucosa: un indicador útil de insulinorresistencia. Endocrinol Nutr. 2014;61:533–540.
