


To validate a questionnaire to analyze the perception of users of primary care (PC) with telephone consultation (TC), and to study the satisfaction with TC by users of PC services.
DesignA two-phase study was conducted. Firstly, a questionnaire on satisfaction with telemedicine services was validated. Secondly, a cross-sectional study on satisfaction with TC was conducted.
SettingPC.
Participants405 users of PC services in Zaragoza (Spain).
Main outcome measureOur main outcome was the satisfaction with telemedicine services PC services. Factor analysis was carried out using the exploratory factor analysis with Varimax rotation. The reliability of the dimensions obtained was analyzed using Cronbach's alpha. The inferential analysis was conducted using parametric tests.
ResultsThe questionnaire was a valid and reliable tool (α>0.9) to assess the satisfaction of PC service users with telemedicine services. Before COVID-19, the satisfaction of the users with PC was adequate (mean=6111/10). However, during the COVID-19 the attention in PC centers became mostly telephone-based and satisfaction lowered as disappointing (mean=3555/10). Regarding the future of telemedicine, users considered it as unsatisfactory (mean=2977/10). Being a woman, being unemployed and belonging to an area of low vulnerability led to a worse perception of telemedicine.
ConclusionThis questionnaire was a valid and reliable tool to assess the satisfaction of PC service users with telemedicine services. Perceptions of patient satisfaction decreased during COVID-19. Thus, TC seems to be a good option when the patients consider it to be a complementary rather than a substitute tool to follow-up their conditions.
Validar un cuestionario para analizar la percepción de los usuarios de atención primaria (AP) con la consulta telefónica (CT) y estudiar la satisfacción de la CT por parte de estos.
DiseñoEstudio en dos fases. Se validó un cuestionario sobre satisfacción con los servicios de telemedicina. Después, se realizó un estudio transversal sobre la satisfacción con la CT.
EmplazamientoAP.
ParticipantesUn total de 405 usuarios de servicios de AP en Zaragoza (España).
Medición principalSatisfacción con los servicios de telemedicina de AP. El análisis factorial se realizó a través del exploratorio con rotación Varimax. La fiabilidad de las dimensiones se analizó con el alfa de Cronbach. El inferencial se efectuó mediante pruebas paramétricas.
ResultadosEl cuestionario resultó válido y fiable (α>0,9) para evaluar la satisfacción de los usuarios con la telemedicina. Antes de la COVID-19, esta era adecuada (media=6,111/10) con la AP. Durante la pandemia la atención en AP pasó a ser mayoritariamente telefónica y la satisfacción disminuyó (media=3,555/10). Con respecto al futuro de la telemedicina, los usuarios lo consideraron insatisfactorio (media=2,977/10). Ser mujer, estar en paro y pertenecer a una zona de baja vulnerabilidad conllevó una peor percepción de la telemedicina.
ConclusionesNuestro cuestionario fue un instrumento válido y fiable para evaluar la satisfacción de los usuarios de servicios de AP con la telemedicina, la cual disminuyó durante la COVID-19. La CT es una buena opción cuando los pacientes la consideran una herramienta complementaria y no sustitutiva para el seguimiento de sus dolencias.
In response to the COVID-19 pandemic and in compliance with social and physical distancing measures telemedicine emerged as a crucial technology for delivering medical care to patients. The World Medical Association defined telemedicine as “the practice of medicine over a distance, in which interventions, diagnoses, therapeutic decisions, and subsequent treatment recommendations are based on patient data, documents and other information transmitted through telecommunication systems”.1
Telephone consultation (TC) has been the most prevalent alternative to face-to-face consultations in clinical settings.2 TC offers convenience and accessibility but tends to focus on the presented symptoms, often resulting in a less comprehensive assessment of patients. The absence of visual and non-verbal cues (body language and facial expressions) and the inability to conduct physical examinations are additional drawbacks of telemedicine. Other challenges include issues concerning the physician-patient relationship and bureaucratic difficulties.3 Nevertheless, TC has thrived during the COVID-19 pandemic due to its capacity to provide necessary healthcare services to patients at a distance, particularly those at high risk.4
In Spain due to the COVID-19 pandemic, the model of some primary care (PC) health services changed from face-to-face to TC, forcing a large sector of the service user population, as well as service providers, to adapt to this circumstance suddenly and without prior preparation.5 According to some studies conducted during this period in Spain a high proportion of patients could be managed with TC achieving a considerable degree of satisfaction for both the patient and the doctor.6,7
The integration of telemedicine in healthcare services is expected to increase in the coming years, even after the end of the pandemic.8 Thus, although can facilitate the access to health services,9 the sudden and widespread integration of this modality might complicate the access to certain, generally more vulnerable population, such as elderly, people with limited language and technology skills, or people with cognitive deficits or disabilities.10
To the best of our knowledge, no specific and validated questionnaires have been developed to assess Patient Satisfaction with Telephone-Based Consultations but other adaptations of patient satisfaction questionnaires have been used.9–11
This paper aims to validate a questionnaire to analyze the perception of users of PC health services offered through TC during the COVID-19 pandemic, and to study the perception of TC by users of PC health services in Zaragoza (Spain) before, during and after COVID-19 pandemic.
Materials and methodsStudy designA two-phase study was carried out. Firstly, we validated questionnaire on satisfaction with telemedicine services. Secondly, we conducted a descriptive, cross-sectional study of satisfaction with TC among users of PC health services.
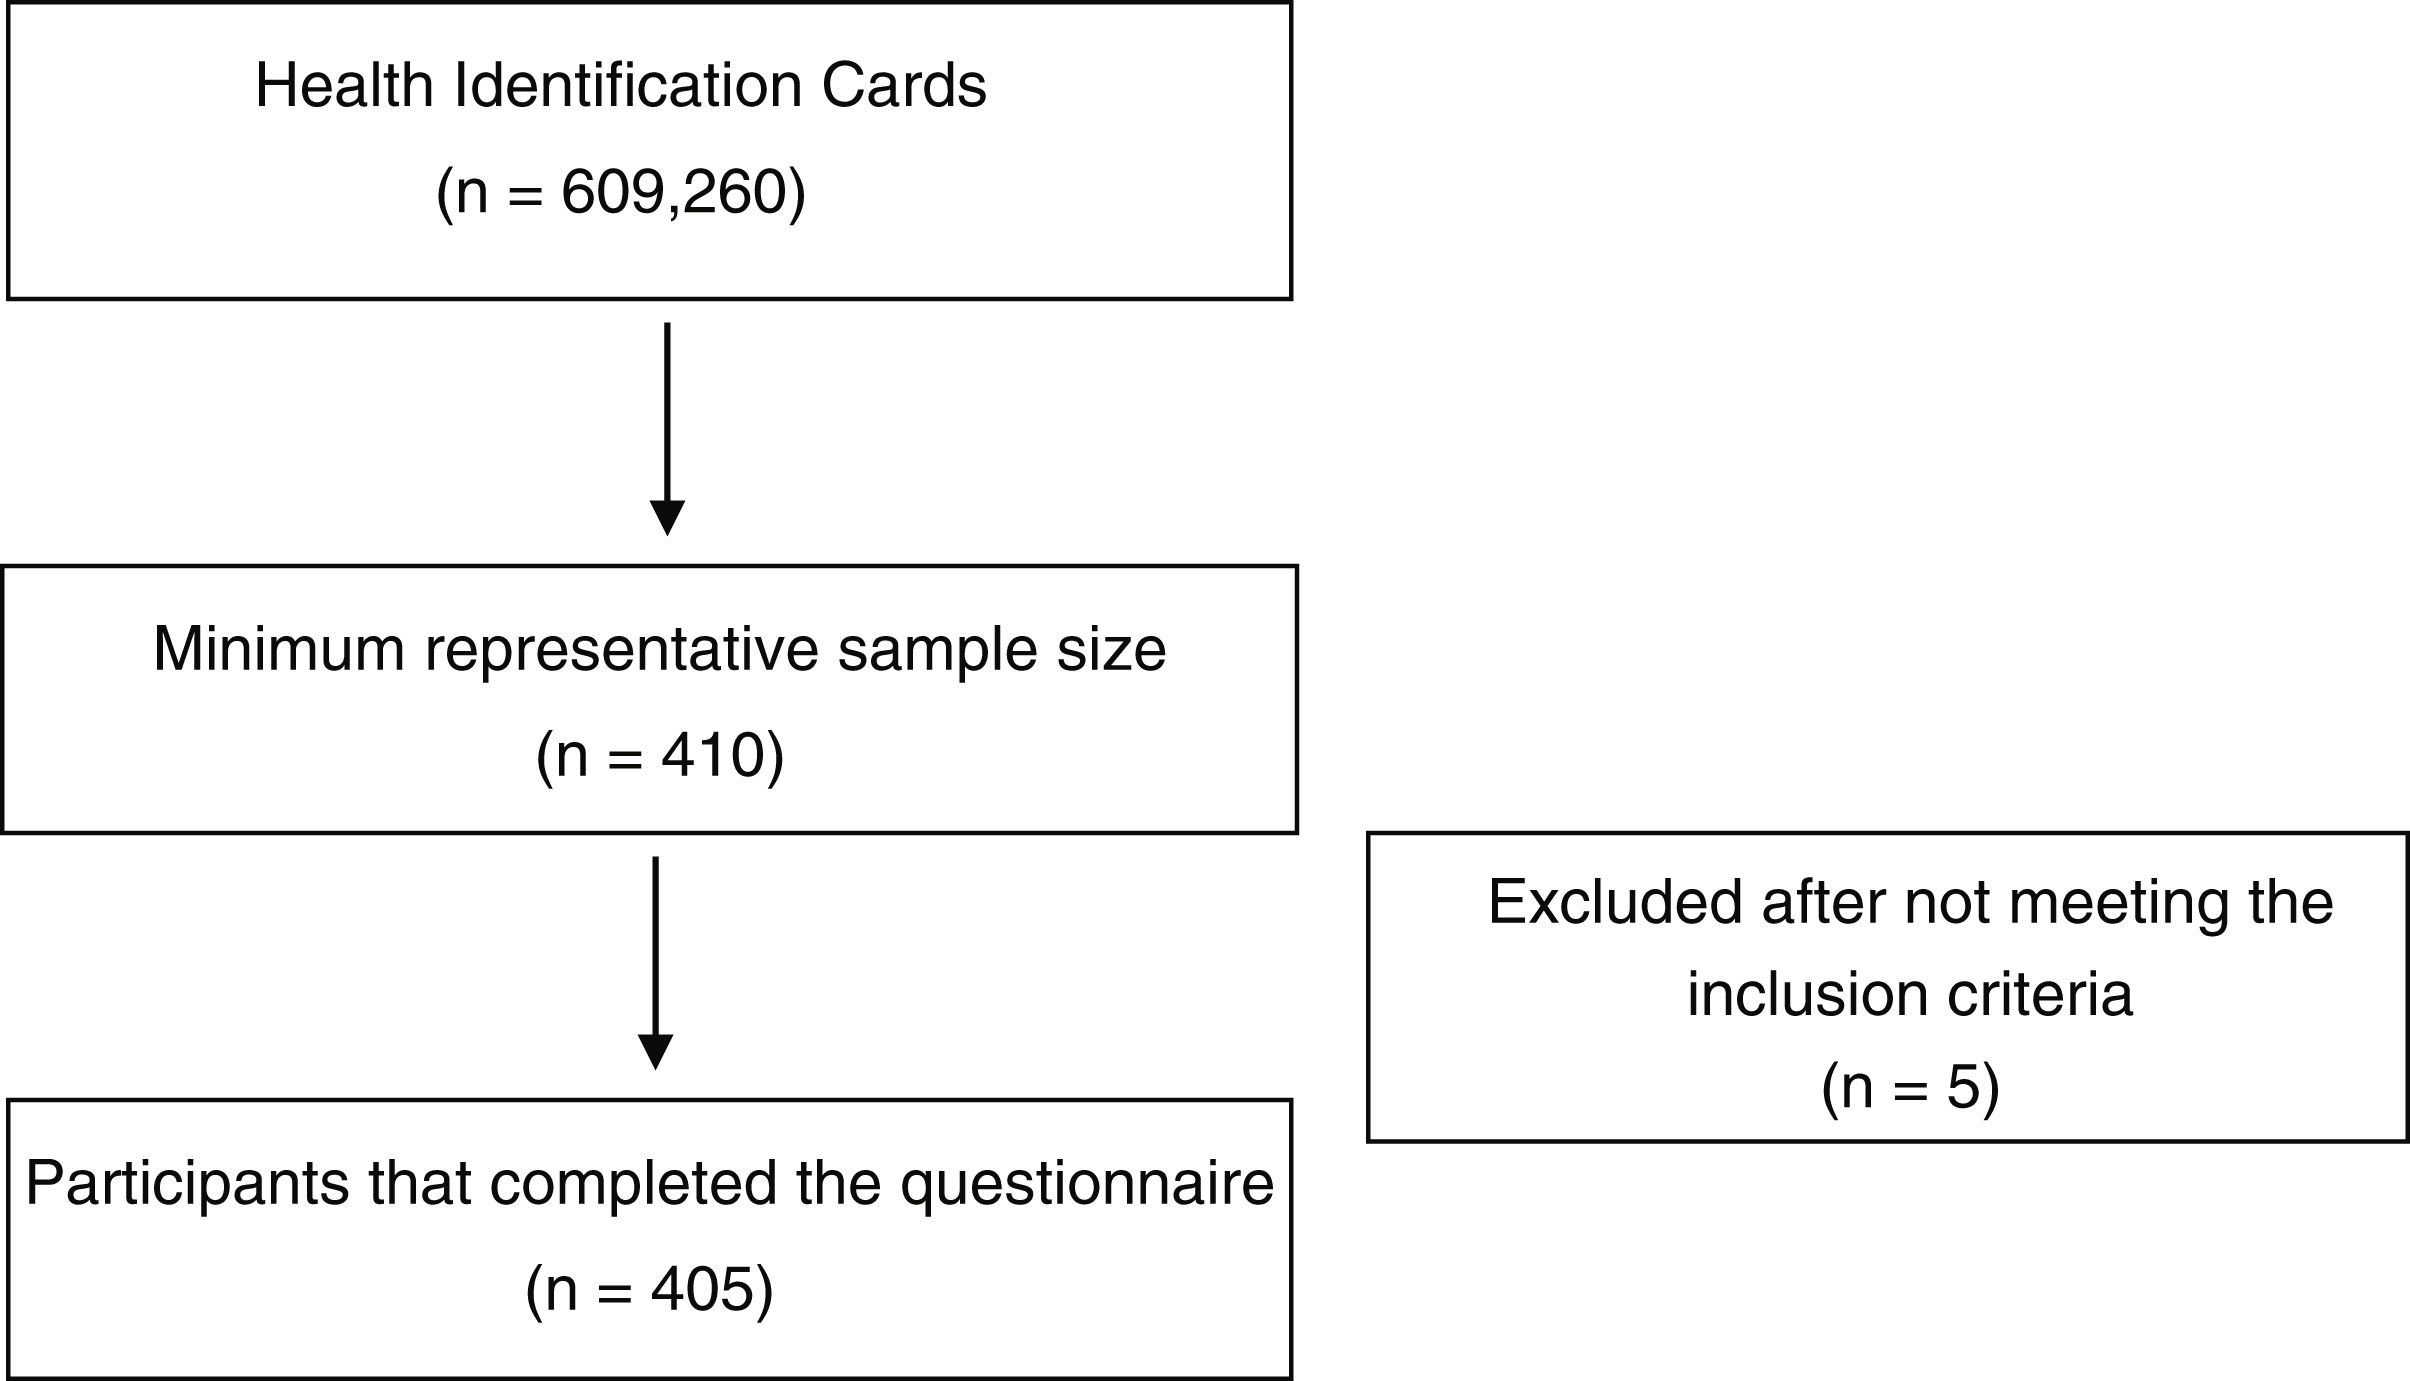
Participants and locationA simple random sample and representative of the users of PC in Zaragoza was selected. The city has 609,260 Health Identification Cards distributed in 34 Basic Health Zones (BHZ), corresponding to people over 13 years of age, as of 1 January 2019.12 The sample size was calculated using the formula for populations over 100,000: e=√z2pq/n n=z2pqN/(e2(N−1)+z2pq), with a confidence level of 95.5% and proportion p=q=0.5, and a sampling error of 4.8%, estimating a minimum sample size of 410 users.
After applying the inclusion criteria (Supplementary Material, Fig. S1) a total of 405 users of PC agreed to participate in the study and completed the questionnaire (response rate=3462%) in 2021 (Study Flowchart).
The participants completed an ad hoc questionnaire (Supplementary Material, Fig. S2). This questionnaire contained socio-demographic information including age, sex, employment status and health sector, and 25 items related to their experience, perspective or perception of the care received through TC in their PC center and particularly related to access to health services and information; to the quality of care received: privacy, confidentiality, satisfaction with telephone interaction, and diagnostic accuracy; to ethical-legal aspects such as responsibility, consent and protection of vulnerable patients; and to the impact of the use of telemedicine on users. Participants rated their satisfaction with each these items on a 10-point scale (1=not at all satisfactory; 10=very satisfactory). Higher scores were related to a better experience or perception with their PC center. Participants could choose the response option don’t know/no answer; all responses in this category were subsequently treated as missing values.
Data for the “social vulnerability” variable were obtained from the report “Analysis of social vulnerability to COVID-19 in Zaragoza. Construction and cartographic representation using socio-economic indicators”.13 This report created a new vulnerability index considering population density, age, female population, foreign population, overcrowding, education level and income level.
Methods of data analysisFor the descriptive data, an analysis of the absolute and relative values (n and %) of the qualitative variables and measures of central tendency and dispersion (mean and standard deviation) of the quantitative variables was carried out. The variable “health centers” was categorized into the three health sectors (I, II, III). Factor analysis was carried out using the exploratory factor analysis (EFA) with Varimax rotation, after checking its suitability with the Kaiser–Meyer–Olkin test and Bartlett's test of sphericity. The reliability of the dimensions obtained was analyzed using Cronbach's alpha index. Prior to the inferential analysis, a descriptive calculation was also conducted the mean values of each of the dimensions of the questionnaire used, excluding from the dimensional analysis those cases in which there were missing values in any of the items. The inferential analysis was carried out using parametric tests, establishing bivariate correlations using Pearson's correlation index for the analysis between quantitative variables, Student's t-test for the analysis of difference of dichotomous means, and analysis of variance (ANOVA) with Bonferroni correction for the analysis of polynomial differences. In cases of comparison of values between disparate group sizes, the non-parametric Mann–Whitney U test was used. Significant results were highlighted in bold.
A Collaboration Agreement between the Justicia de Aragón and the University of Zaragoza was signed to conduct this study (Number 17683). Participants were informed about the study and the information collected. No participant identifiers were included in the study database.
Results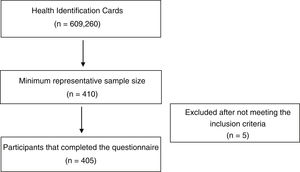
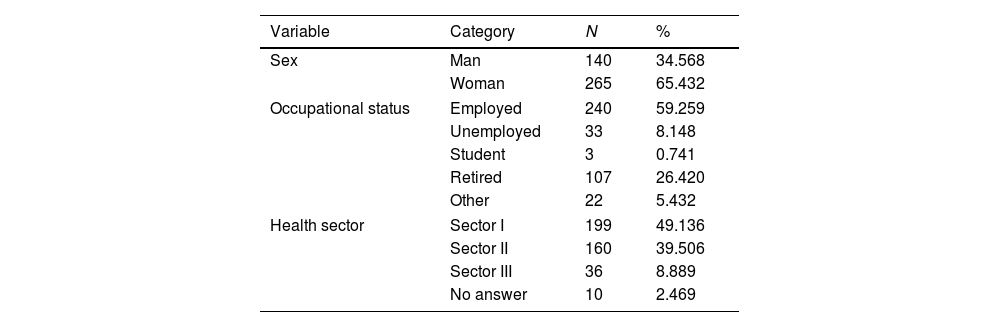
The mean age of the respondents was 53.28 years (SD=12.04), (range 20–84 y). The respondents were 140 men (34.6%) and 266 women (65.4%). Regarding their employment status, most respondents were employed (59.3%), and retired (26.4%), while 8.1% were unemployed, 1% were students and the other respondents reported other employment status (5.4%). By health sectors, 49.1% of the responses corresponded to PC centers belonging to Sector I, 39.4% to Sector II and 8.9% to Sector III of the Aragon's Health Service, with 2.5% of the responses corresponding to missing value (Table 1).
Socio-demographic characteristics of the sample.
| Variable | Category | N | % |
|---|---|---|---|
| Sex | Man | 140 | 34.568 |
| Woman | 265 | 65.432 | |
| Occupational status | Employed | 240 | 59.259 |
| Unemployed | 33 | 8.148 | |
| Student | 3 | 0.741 | |
| Retired | 107 | 26.420 | |
| Other | 22 | 5.432 | |
| Health sector | Sector I | 199 | 49.136 |
| Sector II | 160 | 39.506 | |
| Sector III | 36 | 8.889 | |
| No answer | 10 | 2.469 | |
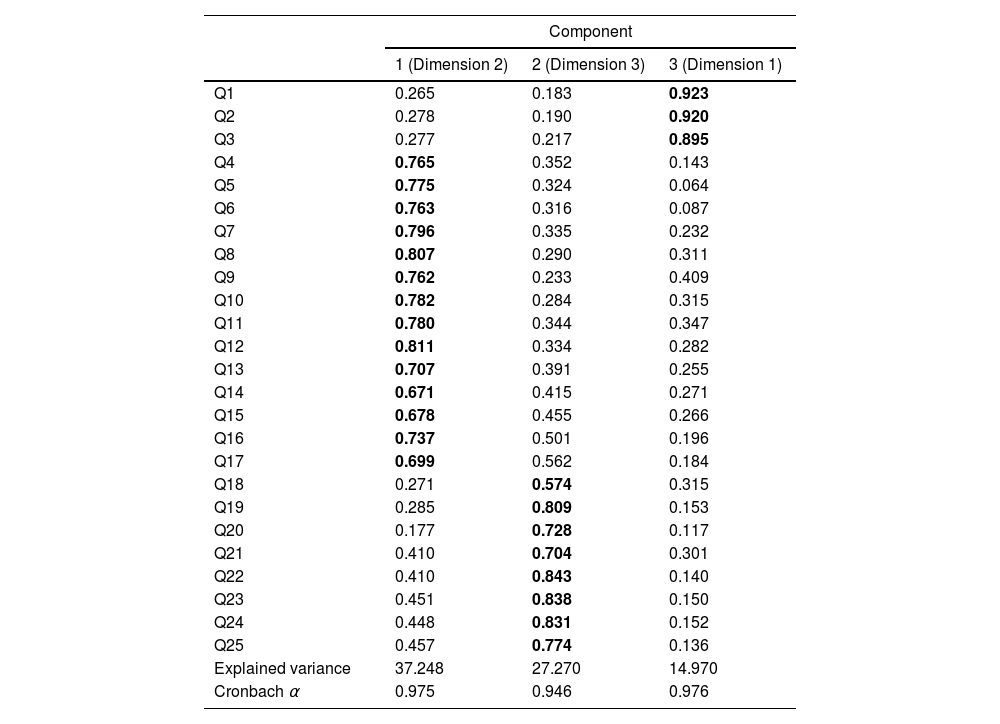
The values of the KMO test (0.958) and Bartlett's test of sphericity (X2=13,536.287; p<0.001), indicated the appropriateness of performing the principal factor analysis (PFA) with Varimax rotation. The sum of factor loadings of the rotated component matrix explained 79.488% of the cumulative variance, grouping the items into 3 dimensions (Table 2). The cumulative variance was explained by 37.248% for the first component, 27.270% for the second and 14.970% for the third. Given the clarity for the differentiation of 3 dimensions according to the temporality of the questions, it was decided to name the dimensions as follows: pre-pandemic assessment (third component, dimension 1), assessment during the pandemic (first component, dimension 2) and future assessment/post pandemic-assessment (second component, dimension 3). From this point onwards, the analysis was carried out by dimensions rather than by individual items, using the weighted averages obtained for each of the dimensions.
Rotated component matrix, explained variance and reliability of the dimensions.
| Component | |||
|---|---|---|---|
| 1 (Dimension 2) | 2 (Dimension 3) | 3 (Dimension 1) | |
| Q1 | 0.265 | 0.183 | 0.923 |
| Q2 | 0.278 | 0.190 | 0.920 |
| Q3 | 0.277 | 0.217 | 0.895 |
| Q4 | 0.765 | 0.352 | 0.143 |
| Q5 | 0.775 | 0.324 | 0.064 |
| Q6 | 0.763 | 0.316 | 0.087 |
| Q7 | 0.796 | 0.335 | 0.232 |
| Q8 | 0.807 | 0.290 | 0.311 |
| Q9 | 0.762 | 0.233 | 0.409 |
| Q10 | 0.782 | 0.284 | 0.315 |
| Q11 | 0.780 | 0.344 | 0.347 |
| Q12 | 0.811 | 0.334 | 0.282 |
| Q13 | 0.707 | 0.391 | 0.255 |
| Q14 | 0.671 | 0.415 | 0.271 |
| Q15 | 0.678 | 0.455 | 0.266 |
| Q16 | 0.737 | 0.501 | 0.196 |
| Q17 | 0.699 | 0.562 | 0.184 |
| Q18 | 0.271 | 0.574 | 0.315 |
| Q19 | 0.285 | 0.809 | 0.153 |
| Q20 | 0.177 | 0.728 | 0.117 |
| Q21 | 0.410 | 0.704 | 0.301 |
| Q22 | 0.410 | 0.843 | 0.140 |
| Q23 | 0.451 | 0.838 | 0.150 |
| Q24 | 0.448 | 0.831 | 0.152 |
| Q25 | 0.457 | 0.774 | 0.136 |
| Explained variance | 37.248 | 27.270 | 14.970 |
| Cronbach α | 0.975 | 0.946 | 0.976 |
Cronbach's alpha=0.976 for dimension 1 (items 1–3), Cronbach's alpha=0.975 for dimension 2 (items 4–17) and Cronbach's alpha=0.946 for dimension 3 (items 18–25) were obtained. The reliability analysis for each of the dimensions of the scale yielded a value of α>0.9 indicating excellent reliability values for each of the dimensions. For dimension 1 of the tool, the mean value was 6.11 (SD=2.87), for dimension 2 the mean value was 3.55 (SD=2.30) and for dimension 3 the mean value was 2.99 (SD=1.97) (Supplementary Table 1).
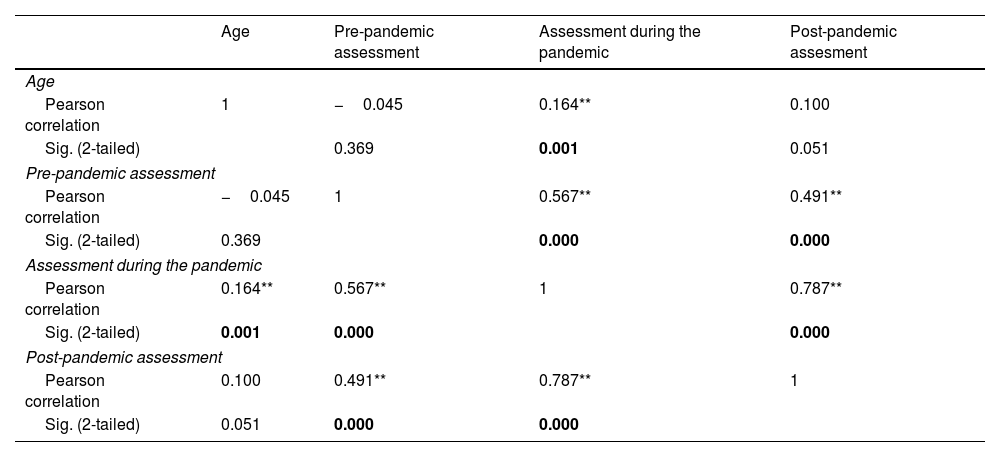
When analyzing the quantitative variables using Pearson's correlation, it was shown that the age of the respondents correlated directly with the mean scores of dimension 2, i.e. the older the respondent, the better the perception of TC during the pandemic with respect to telemedicine. The same table showed a strong direct correlation (p<0.001) between the three survey dimensions (Table 3).
Bivariate correlations between quantitative variables (Pearson).
| Age | Pre-pandemic assessment | Assessment during the pandemic | Post-pandemic assesment | |
|---|---|---|---|---|
| Age | ||||
| Pearson correlation | 1 | −0.045 | 0.164** | 0.100 |
| Sig. (2-tailed) | 0.369 | 0.001 | 0.051 | |
| Pre-pandemic assessment | ||||
| Pearson correlation | −0.045 | 1 | 0.567** | 0.491** |
| Sig. (2-tailed) | 0.369 | 0.000 | 0.000 | |
| Assessment during the pandemic | ||||
| Pearson correlation | 0.164** | 0.567** | 1 | 0.787** |
| Sig. (2-tailed) | 0.001 | 0.000 | 0.000 | |
| Post-pandemic assessment | ||||
| Pearson correlation | 0.100 | 0.491** | 0.787** | 1 |
| Sig. (2-tailed) | 0.051 | 0.000 | 0.000 | |
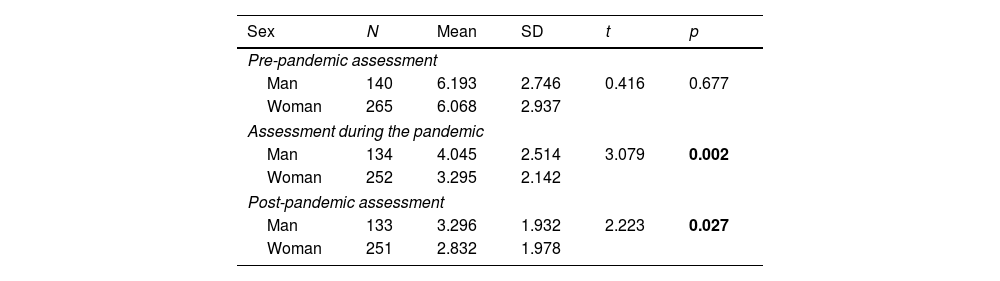
When performing an inferential analysis according to the sex of the respondents, it was found that women had a significantly worse perception for dimensions 2 and 3 (Table 4).
Mean difference analysis according to sex of respondents (t-Student).
| Sex | N | Mean | SD | t | p |
|---|---|---|---|---|---|
| Pre-pandemic assessment | |||||
| Man | 140 | 6.193 | 2.746 | 0.416 | 0.677 |
| Woman | 265 | 6.068 | 2.937 | ||
| Assessment during the pandemic | |||||
| Man | 134 | 4.045 | 2.514 | 3.079 | 0.002 |
| Woman | 252 | 3.295 | 2.142 | ||
| Post-pandemic assessment | |||||
| Man | 133 | 3.296 | 1.932 | 2.223 | 0.027 |
| Woman | 251 | 2.832 | 1.978 | ||
By health sector, respondents in sector I had a worse perception than those in sectors II and III for dimension 2 (p<0.001). For dimension 3, differences occurred between sectors I and III (p=0.048), but not between any of these sectors and sector II (Supplementary Table 2).
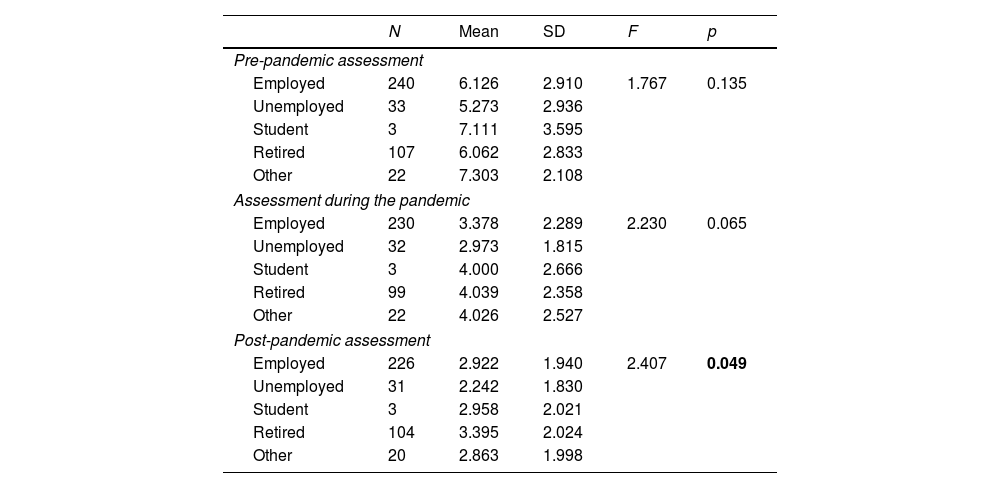
When analyzing the dimensions according to employment status (Table 5), significant differences were observed in dimension 3 between the unemployed and retired groups (p=0.049). Given that the size of the groups was very different, we performed a non-parametric test between the two groups (U-Mann–Whitney), confirming not only the difference between these groups for dimension 3 (Z=3.033; p=0.002) but also finding a significant difference between the same groups for dimension 2 (Z=2.197; p=0.028).
Differences according to employment status (ANOVA-Bonferroni).
| N | Mean | SD | F | p | |
|---|---|---|---|---|---|
| Pre-pandemic assessment | |||||
| Employed | 240 | 6.126 | 2.910 | 1.767 | 0.135 |
| Unemployed | 33 | 5.273 | 2.936 | ||
| Student | 3 | 7.111 | 3.595 | ||
| Retired | 107 | 6.062 | 2.833 | ||
| Other | 22 | 7.303 | 2.108 | ||
| Assessment during the pandemic | |||||
| Employed | 230 | 3.378 | 2.289 | 2.230 | 0.065 |
| Unemployed | 32 | 2.973 | 1.815 | ||
| Student | 3 | 4.000 | 2.666 | ||
| Retired | 99 | 4.039 | 2.358 | ||
| Other | 22 | 4.026 | 2.527 | ||
| Post-pandemic assessment | |||||
| Employed | 226 | 2.922 | 1.940 | 2.407 | 0.049 |
| Unemployed | 31 | 2.242 | 1.830 | ||
| Student | 3 | 2.958 | 2.021 | ||
| Retired | 104 | 3.395 | 2.024 | ||
| Other | 20 | 2.863 | 1.998 | ||
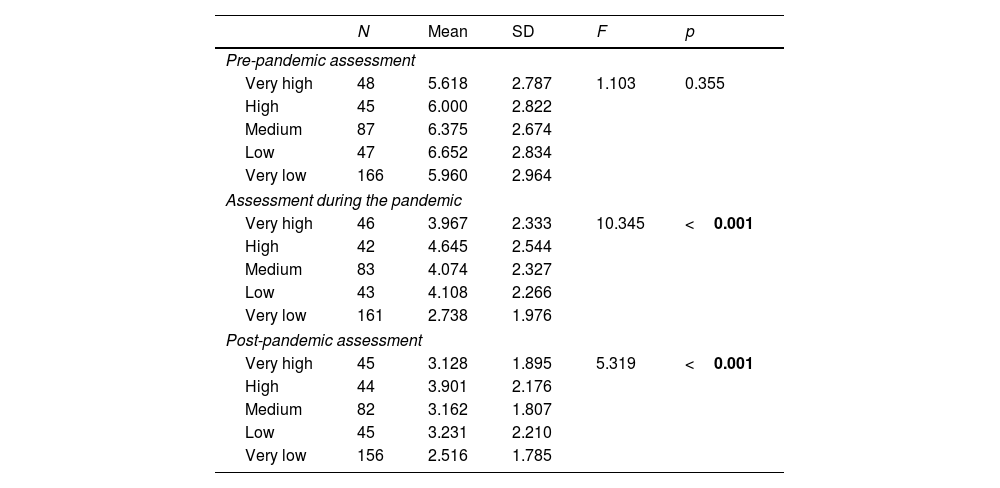
When analyzing the values according to the social vulnerability attributed to each BHZ (Table 6), results indicated that the zones with very low vulnerability presented significantly lower values than the other categories for dimension 2 (compared to the BHZs with very high, high, medium and low vulnerability), and only with those BHZs with high vulnerability in dimension 3 (p<0.001).
Differences according to vulnerability (ANOVA-Bonferroni).
| N | Mean | SD | F | p | |
|---|---|---|---|---|---|
| Pre-pandemic assessment | |||||
| Very high | 48 | 5.618 | 2.787 | 1.103 | 0.355 |
| High | 45 | 6.000 | 2.822 | ||
| Medium | 87 | 6.375 | 2.674 | ||
| Low | 47 | 6.652 | 2.834 | ||
| Very low | 166 | 5.960 | 2.964 | ||
| Assessment during the pandemic | |||||
| Very high | 46 | 3.967 | 2.333 | 10.345 | <0.001 |
| High | 42 | 4.645 | 2.544 | ||
| Medium | 83 | 4.074 | 2.327 | ||
| Low | 43 | 4.108 | 2.266 | ||
| Very low | 161 | 2.738 | 1.976 | ||
| Post-pandemic assessment | |||||
| Very high | 45 | 3.128 | 1.895 | 5.319 | <0.001 |
| High | 44 | 3.901 | 2.176 | ||
| Medium | 82 | 3.162 | 1.807 | ||
| Low | 45 | 3.231 | 2.210 | ||
| Very low | 156 | 2.516 | 1.785 | ||
Statistically significant results are showed in bold.
When dichotomizing the vulnerability variable between the BHZs with very low vulnerability and others, significant differences were observed in dimensions 2 and 3, with significantly lower values (p<0.001) in the BHZs with lower vulnerability (Supplementary Table 3).
DiscussionThe aim of this research was to validate a questionnaire on the satisfaction of PC service users with telemedicine services and particularly with TC and to study the level of satisfaction of users of PC services of the Aragon Health Service with telemedicine services and particularly with TC before, during and after the pandemic.
The present questionnaire was a valid and reliable tool to assess the satisfaction of PC service users with telemedicine services.14
Although telemedicine has certain advantages15 more research is needed on the usability of this model of care in PC services. Aspects such as users’ age, cognitive capacity, perception and behavior need to be considered in the design, management and implementation of these services.16 Other aspects to take into account are ethical and legal issues such as informed consent, the right to privacy and confidentiality, and quality of care.5,17,18
Our results showed that before COVID-19 pandemic, the mean satisfaction of the users with TC in the respective PC centers was adequate. However, during the COVID-19 lockdown the attention in the PC centers became mostly telephone-based rather than face-to-face. The mean satisfaction of the users with TC during this period and after the pandemic was considered as disappointing and worse than what they expected. Our findings suggest users whose primary care physicians used TC may feel abandoned by the system. Therefore, TC seems to be a good option when the patients consider it to be a complementary rather than a substitute tool to follow-up their conditions. However, other studies conducted in Spain during the pandemic have showed higher rates of satisfaction with TC in different medical specialties compared to our results. Over 80% of patients attended in rheumatology would repeat the TC and 79.3% considered them useful.6 Similarly, in general surgery the satisfaction rate with TC was around 87% although 37.2% would prefer a face-to-face visits.7 In hematology, 56.2% of the cohort preferred in-person visits but 90.5% of the patients claimed to be satisfied with follow-up during the pandemic.19
The present study found that being a woman, unemployed and belonging to a low vulnerability BHZ and the Sector I, led to a worse perception of telemedicine and particularly TC during the pandemic situation, and to a worse future outlook with respect to it.
In our study, female gender was associated with a lower satisfaction with telemedicine compared to men. In agreement with our results, one study found that women were less satisfied than men regarding telemedicine.20 However, most of the studies were in disagreement with our results.15,21,22 A study conducted in Israel during the COVID-19 pandemic found that women were more satisfied than men15 but patients were offered telemedicine and those who agreed were asked to fill in a questionnaire assessing their satisfaction with the medical consultation, which could be the reason of the differences found with our results since in this case patients voluntary agreed to have telemedicine. Also, women tend to participate more than men in satisfaction surveys, which may have influenced the outcomes obtained in those studies. Patients who were more familiar with new information and communication technologies were more likely to participate in the surveys, thus enhancing the overall satisfaction scores.22
Concerning employment status, we found that those who were unemployed had lower satisfaction scores with telemedicine and TC compared to those who were retired. These results could be explained by the fact that retired people are usually older people and age was positively associated with a better perception of TC during the pandemic and the better the future outlook with respect to telemedicine.
When analyzing the values according to the social vulnerability attributed to each BHZ, our results showed that the areas with very low vulnerability presented significantly lower satisfaction scores compared to those more vulnerable. These results are in line with a previous study that linked higher patient satisfaction with lower education levels,21 which could be the result of a higher critical reasoning and expectations in higher educated people compared to lower educated people.
Regarding the different sectors, although the mean satisfaction of the users with their PC centers was higher before the COVID-19, especially in sector I, during the COVID-19 pandemic users of sectors II and III were statistically less dissatisfied than those one belonging in sector I. This is line with some data extracted with of a study based on the prevalence and impact of patient safety incidents in PC in the Zaragoza I, II, III sectors from the patient's perspective through user complaints. The adverse events extracted from pediatric care claims in sector I were proportionally higher than in the other sectors II and III.20
This study had several strengths. The present sample includes a diverse population with different profiles of vulnerability of Zaragoza. The choice of Zaragoza is not arbitrary since it frequently has been used for market tests by companies, because its population characteristics generally reflect the average citizen profile in Spain. Moreover, we were able to develop a valid questionnaire to assess the perceptions of users of PC with telemedicine.
The study also had some limitations. This investigation has focused on TC as part of telemedicine instead of considering other telemedicine modes, such as the use of live video (synchronous), store-and-forward (asynchronous), or remote patient monitoring with other means rather than the telephone itself, which may have led to much lower satisfaction values for this modality. In addition, this research has focused only on Zaragoza, which makes it unlikely that results can be extrapolated. Finally, most of our respondents were women (65.5%) and the refusal rate was high (65.38%) which might have an impact in the results.
In conclusion, being a woman, unemployed and belonging to a low vulnerability BHZ and to the Sector I was associated with a worse perception of telemedicine and TC during and after, but not before the pandemic. Therefore, satisfaction with telemedicine varied according to patient demographics, revealing the importance of considering these variables when designing telemedicine plans. Nevertheless, TC seems to be a good option when patients consider it to be a complementary rather than a substitute tool to follow-up their conditions.
- •
In Spain due to the COVID-19 pandemic, the model of some primary care (PC) centers changed from face-to-face to telephone consultation (TC).
- •
The integration of telemedicine in healthcare services is expected to increase in the coming years, even after the end of the pandemic.
- •
Users whose primary care physicians used TC during COVID-19 pandemic may feel abandoned by the system.
- •
Before COVID-19 pandemic, the mean satisfaction of the users with TC in their PC centers was adequate but during and after the pandemic was considered as disappointing.
- •
TC seems to be a good option when the patients consider it to be a complementary rather than a substitute tool to follow-up their conditions.
- •
Being a woman, unemployed and belonging to a low vulnerability area led to a worse perception of telemedicine.
The study was approved with a collaboration agreement between the Justicia de Aragón and the University to conduct this study (Number 17683). Informed consent was obtained from all subjects involved in the study.
FundingThis work has been carried out within the project entitled: SCIENTIFIC RESEARCH PROJECT ENTITLED: “PERCEPTION OF TELEMEDICINE BY PHYSICIANS AND USERS OF PRIMARY HEALTH CARE: POSSIBLE ETHICAL-LEGAL DERIVATIONS”, developed under the COLLABORATION AGREEMENT between THE UNIVERSITY OF ZARAGOZA and the Institution of the JUSTICE OF ARAGON.
Conflicts of interestAll the authors declare that they have no conflicts of interest.
The following are the supplementary data to this article:
