


To evaluate the behavior of adrenal adenomas and metastases with dual-energy CT, analyzing the attenuation coefficient in monochromatic images at three different levels of energy (45, 70, and 140 keV) and the tissue concentrations of fat, water, and iodine in material density maps, with the aim of establishing optimal cutoffs for differentiating between these lesions and comparing our results against published evidence.
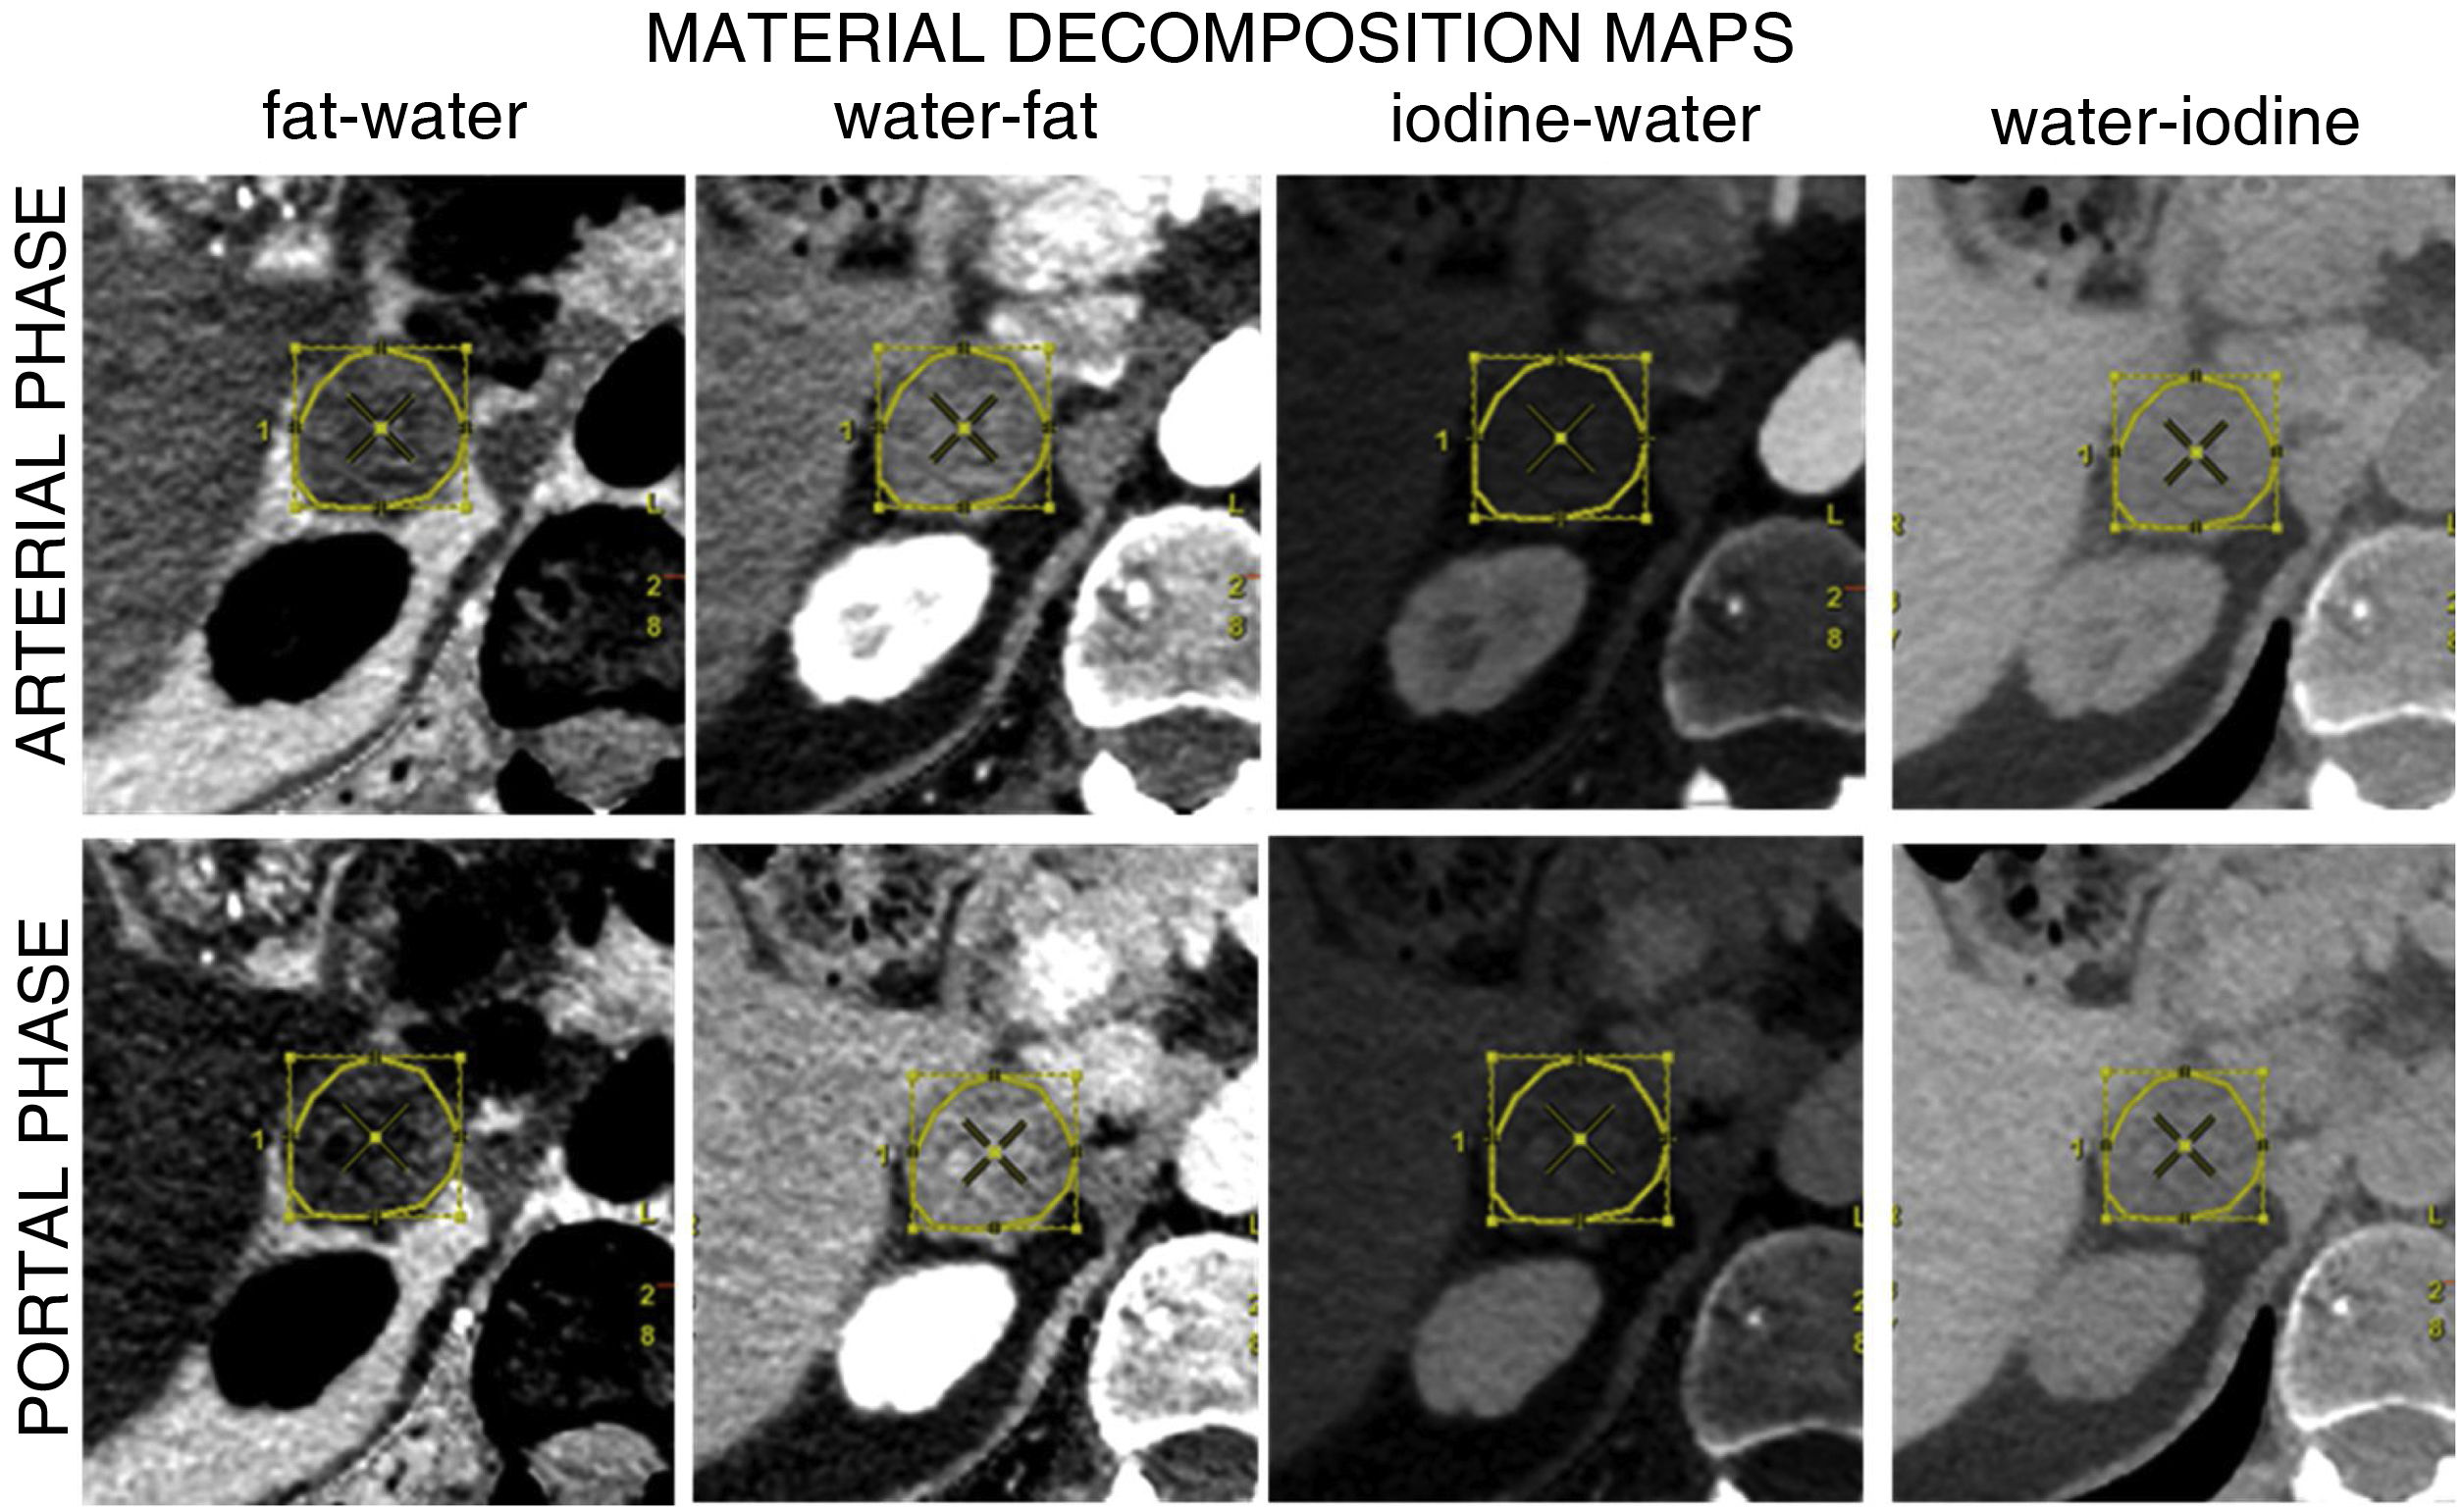
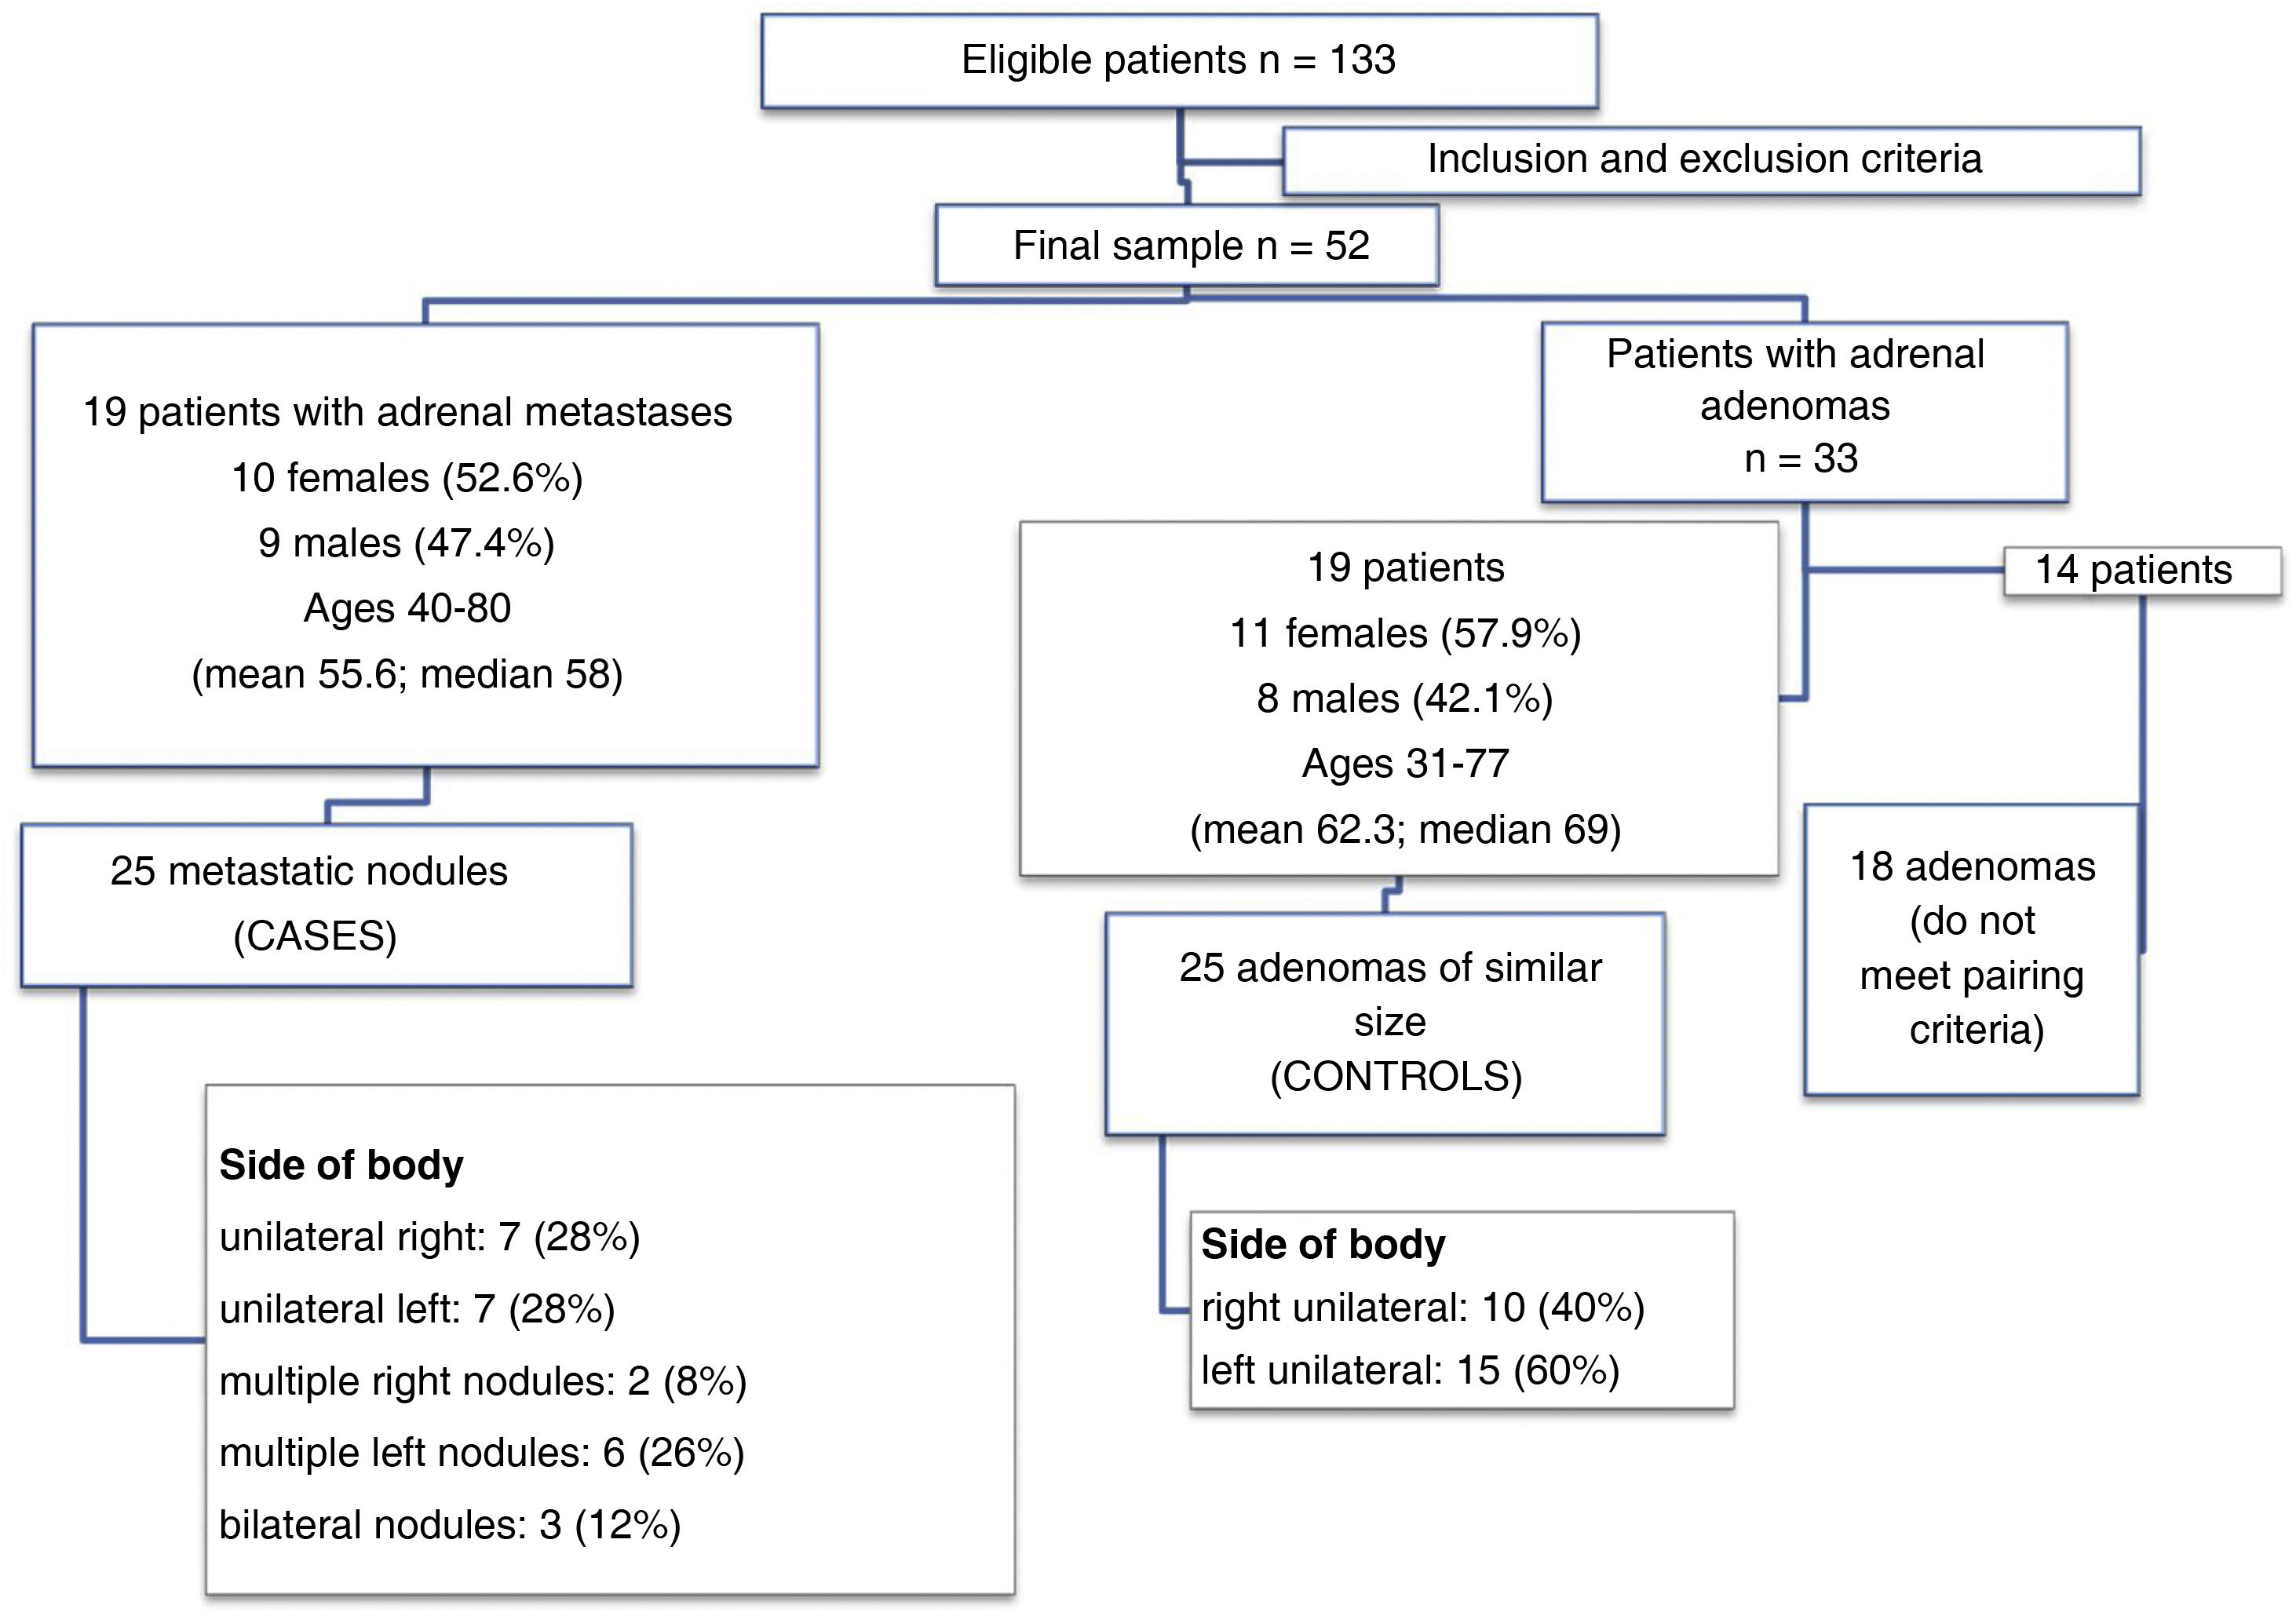
Materials and methodsThis retrospective case-control study included oncologic patients diagnosed with adrenal metastases in the 6–12 months prior to the study who were followed up in our hospital between January and June 2020. For each case (patient with metastases) included in the study, we selected a control (patient with an adrenal adenoma) with a nodule of similar size. All patients were studied with a rapid-kilovoltage-switching dual-energy CT scanner, using a biphasic acquisition protocol. We analyzed the concentration of iodine in paired water−iodine images, the concentration of fat in the paired water–fat images, and the concentration of water in the paired iodine–water and fat–water images, in both the arterial and portal phases. We also analyzed the attenuation coefficient in monochromatic images (at 55, 70, and 140 keV) in the arterial and portal phases.
ResultsIn the monochromatic images, in both the arterial and portal phases, the attenuation coefficient at all energy levels was significantly higher in the group of patients with metastases than in the group of patients with adenomas. This enabled us to calculate the optimal cutoffs for classifying lesions as adenomas or metastases, except for the arterial phase at 55 KeV, where the area under the receiver operating characteristic curve (AUC) for the estimated threshold (0.68) was not considered accurate enough to classify the lesions. For the arterial phase at 70 keV, the AUC was 0.76 (95% CI: 0.663‒0.899); the optimal cutoff (42.4 HU) yielded 92% sensitivity and 60% specificity. For the arterial phase at 140 keV, the AUC was 0.94 (95% CI: 0.894‒0.999); the optimal cutoff (18.9 HU) yielded 88% sensitivity and 94% specificity). For the portal phase at 55 keV, the AUC was 0.76 (95% CI: 0.663‒0.899); the optimal cutoff (95.4 HU) yielded 68% sensitivity and 84% specificity. For the portal phase at 70 keV, the AUC was 0.82 (95% CI: 0.757‒0.955); the optimal cutoff (58.4 HU) yielded 80% sensitivity and 84% specificity. For the portal phase at 140 keV, the AUC was 0.9 (95% CI: 0.834‒0.987); the optimal cutoff (16.35 HU) yielded 96% sensitivity and 84% specificity. In the material density maps, in the arterial phase, significant differences were found only for the iodine–water pair, where the concentration of water was higher in the group with metastases (1018.8 ± 7.6 mg/cm3 vs. 998.6 ± 8.0 mg/cm3 for the group with adenomas, p < 0.001). The AUC was 0.97 (95% CI: 0.893‒0.999); the optimal cutoff (1012.5 mg/cm3) yielded 88% sensitivity and 96% specificity. The iodine–water pair was also significantly higher in metastases (1019.7 ± 12.1 mg/cm3 vs. 998.5 ± 9.1 mg/cm3 in adenomas, p < 0.001). The AUC was 0.926 (95% CI: 0.807‒0.977); the optimal cutoff (1009.5 mg/cm3) yielded 92% sensitivity and 92% specificity. Although significant results were also observed for the fat–water pair in the portal phase, the AUC was insufficient to enable a sufficiently accurate cutoff for classifying the lesions. No significant differences were found in the fat–water maps or iodine–water maps in the arterial or portal phase or in the water–fat map in the arterial phase.
ConclusionsMonochromatic images show differences between the behavior of adrenal adenomas and metastases in oncologic patients studied with intravenous-contrast-enhanced CT, where the group of metastases had higher attenuation than the group of adenomas in both the arterial and portal phases; this pattern is in line with the evidence published for adenomas. Nevertheless, to our knowledge, no other publications report cutoffs for this kind of differentiation in contrast-enhanced monochromatic images obtained in rapid-kilovoltage-switching dual-energy CT scanners, and this is the first new contribution of our study. Regarding the material density maps, our results suggest that the water–iodine pair is a good tool for differentiating between adrenal adenomas and metastases, in both the arterial and portal phases. We propose cutoffs for differentiating these lesions, although to our knowledge no cutoffs have been proposed for portal-phase contrast-enhanced images obtained with rapid-kilovoltage-switching dual-energy CT scanners.
Evaluar el comportamiento de los adenomas y las metástasis suprarrenales mediante TC con energía espectral, analizando en el coeficiente de atenuación en imágenes monocromáticas a tres niveles energéticos diferentes (45, 70 y 140 KeV), y la concentración tisular de grasa, agua y iodo obtenidos en los mapas de descomposición de materiales, con el fin de establecer puntos de corte óptimos que permitan diferenciarlos, y comparar nuestros resultados con la evidencia publicada.
Materiales y métodosSe diseñó un estudio retrospectivo de casos y controles que incluyó pacientes oncológicos con diagnóstico de metástasis suprarrenal en los 6–12 meses anteriores al estudio y con seguimiento en el Hospital entre enero y junio de 2020. Por cada caso (paciente con metástasis) incluido en el estudio se seleccionó un control (paciente con adenoma suprarrenal) con un nódulo de tamaño similar. Todos los pacientes fueron estudiados con un equipo de TC con intercambio rápido de Kilovoltaje, con protocolo de adquisición bifásico. Se analizó la concentración de iodo en el par iodo-agua; la de grasa en el par grasa-agua y la de agua en los pares agua-iodo y agua-grasa, tanto en fases arterial como portal. También se analizó el coeficiente de atenuación en imágenes monocromáticas (a 55, 70 y 140 KeV) en fase arterial y portal.
ResultadosEn las imágenes monocromáticas, el coeficiente de atenuación fue significativamente mayor en el grupo de las metástasis que en el grupo de los adenomas en todos los niveles energéticos, tanto en fase arterial como en fase portal. Esto permitió calcular el punto de corte óptimo para clasificar las lesiones como metástasis o adenomas, menos para la fase arterial a 55 KeV, donde el área bajo la curva (ABC) para el umbral estimado fue 0,68 y no fue considerado un buen criterio para clasificar las lesiones. Para la fase arterial a 70 KeV, el ABC y su intervalo de confianza (IC 95%), el punto de corte óptimo y sus valores de sensibilidad (S) y especificidad (E) fueron de: 0,76 (0,663-0,899); 42,4 UH, 92% y 60%, respectivamente. Para 140 KeV, fueron de: 0,94 (0,894-0,999; 18,9 UH; 88%, 94%), respectivamente. Para la fase portal a 55 KeV, el ABC y su intervalo de confianza (IC 95%), el punto de corte óptimo y sus valores de S y E fueron de: 0,76 (0,663-0,899); 95,4 UH, 68%, 84%) respectivamente. A 70 KeV, los valores fueron: 0,82 (0,757-0,955); 58,4 UH; 80%, 84%, respectivamente. A 140 KeV: 0,9 (0,834-0,987);16.35 UH; 96%; 84%, respectivamente. En los mapas de descomposición de materiales, en la fase arterial únicamente se encontraron diferencias estadísticamente significativas en el par agua-iodo, donde la concentración de agua fue mayor para el grupo de las metástasis que para los adenomas (1018,8 ± 7,6 mg/cm3 vs 998,6 ± 8,0 mg/cm3, p < 0,001). El ABC y su intervalo de confianza (IC 95%), el punto de corte óptimo y sus valores de S y E fueron de: 0,97 (0,893-0,999); 1012,5 mg/cm3; 88%, 96%). El par agua-iodo en fase portal también evidenció diferencias significativas, con concentraciones de agua de nuevo mayores para metástasis que para adenomas (1019,7 ± 12,1 mg/cm3 vs 998,5 ± 9,1 mg/cm3, p < 0,001). El ABC y su intervalo de confianza (IC 95%), el punto de corte óptimo y sus valores de S y E fueron de 0,926 (0,807-0,977); 1009,5 mg/cm3; 92%). En el par agua-grasa portal, a pesar de observarse resultados significativos, no se obtuvo un ABC en la curva ROC que permitiera utilizarlo como buen criterio para clasificar las lesiones. Sin embargo, no se encontraron diferencias estadísticamente significativas en los mapas grasa-agua ni iodo-agua ni en fase arterial ni portal, ni el de agua-grasa en fase arterial.
ConclusionesLas imágenes monocromáticas evidencian diferencias en el comportamiento entre adenomas y metástasis suprarrenales en pacientes oncológicos estudiados con TC con contraste intravenoso, con atenuación mayor para el grupo de metástasis que para el de adenomas, tanto en fase arterial como en fase portal, con un patrón acorde con la evidencia publicada para adenomas. Sin embargo, no tenemos conocimiento de otras publicaciones que describan umbrales de corte en este tipo de diferenciación en imágenes monocromáticas con contraste con equipos con intercambio rápido de Kilovoltaje, y esa es la primera aportación novedosa de nuestro estudio. Sobre los mapas de descomposición de materiales, nuestros resultados sugieren que el par agua-iodo es una buena herramienta para discriminar metástasis y adenomas suprarrenales tanto en fase arterial como en fase portal, y se proponen umbrales de corte, sin que tengamos otra referencia previa en la literatura de un umbral en fase portal con contraste con equipos de intercambio rápido de kilovoltaje.

