

Non-specific pattern (NSP) is a subgroup of preserved ratio impaired spirometry (PRISm) that requires a normal total lung capacity measurement. NSP has been historically classified as being an obstructive lung disease pattern. There has been heightened interest and investigation into PRISm recently as it has been associated with an increased likelihood of developing chronic obstructive pulmonary disease (COPD). Given the inherent challenges of understanding the clinical significance of the NSP, the aim of this study was to further explore the clinical characteristics of patients with this pulmonary function test pattern.
Material and methodsWe identified 111 and 79 subjects using pre-bronchodilator (pre-BD) and post-bronchodilator (post-BD) values, respectively, that met criteria for NSP. The outpatient medical records were retrospectively reviewed for associated diagnoses that were then clustered into ‘obstructive’ or ‘non-obstructive’ groups based on the treating physician's primary pulmonary clinical diagnosis.
ResultsWithin this NSP cohort, cough, wheezing and sputum production were documented more frequently in those with an obstructive lung disease diagnosis. Whether identified using pre-BD or post-BD spirometric values, those with NSP and a positive BD response were more likely to carry an obstructive lung disease diagnosis.
ConclusionApproximately one third of patients with NSP in this study were not given an obstructive lung disease diagnosis by their clinician, which supports the classification of NSP as not an exclusively obstructive lung disease pattern. However, the presence of supporting clinical symptoms, such as cough with sputum production and wheeze, and/or a positive BD response on PFT, support a diagnosis of obstruction in patients with NSP.
El patrón inespecífico constituye un subgrupo de alteraciones de la espirometría con conservación de la relación (PRISm, siglas en inglés) que precisa de una medición de la capacidad pulmonar total normal; históricamente se ha clasificado como un patrón de neumopatía obstructiva. En épocas recientes se ha intensificado el interés en las PRISm y su investigación, ya que se ha asociado a un aumento de la probabilidad de aparición de una enfermedad pulmonar obstructiva crónica (EPOC). Dadas las dificultades inherentes que conlleva interpretar la importancia clínica del patrón inespecífico, el objetivo de este estudio consistió en explorar con más detalle las características clínicas de los pacientes con dicho patrón en las pruebas de la función pulmonar.
Material y métodosSe identificaron 111 y 79 sujetos empleando valores prebroncodilatador y posbroncodilatador, respectivamente, que cumplieron los criterios de patrón inespecífico. Se revisaron retrospectivamente las historias clínicas ambulatorias para detectar diagnósticos asociados que después se agregaron en grupos «obstructivos» o «no obstructivos» en función del diagnóstico clínico pulmonar primario del médico.
ResultadosEn esta cohorte de pacientes con patrones inespecíficos, se documentó una mayor incidencia de tos, sibilancias y producción de esputo entre los que tenían un diagnóstico de neumopatía obstructiva. Los pacientes con patrón inespecífico y una respuesta positiva al broncodilatador, que hubiesen sido identificados con valores pre o posbroncodilatador, tenían más probabilidades de haber recibido un diagnóstico de neumopatía obstructiva.
ConclusiónAproximadamente un tercio de los pacientes con patrón inespecífico de este estudio no habían recibido un diagnóstico de neumopatía obstructiva, dato que avala no clasificar los patrones inespecíficos exclusivamente en las neumopatías obstructivas. Sin embargo, la presencia de síntomas clínicos indicativos, como tos productiva y sibilancias, o una respuesta positiva al broncodilatador en las pruebas de la función pulmonar, sustenta un diagnóstico de obstrucción en los pacientes con patrón inespecífico.
A pulmonary function test (PFT) is an invaluable tool in the evaluation of respiratory disease, and various PFT patterns have been identified using an algorithmic approach to help diagnose pulmonary disorders.1,2 One such pattern is a normal forced exhalation volume in one second/forced vital capacity (FEV1/FVC) ratio with a reduced FEV1, which has been referred to as preserved ratio impaired spirometry (PRISm).3 Non-specific pattern (NSP) can be thought of as a subgroup of PRISm that also includes a normal total lung capacity (TLC) measurement and was initially investigated in the 1990s by Hyatt et al.4 These terms have been used interchangeably in much of the research in this field despite likely representing distinct patient populations.
There is growing research interest into PRISm given its high prevalence,5,6 increased risk of all-cause mortality,5,7–10 and association with the development of chronic obstructive pulmonary disease (COPD).7,11,12 Clinical symptoms in patients with PRISm, such as wheezing, have been linked to the future development of COPD.11 The same has not yet been described in NSP, though this pattern has been shown to remain stable or evolve into either obstructive or restrictive patterns over time.13 Additionally, there lacks consensus on whether to use pre-BD or post-BD values in the definition of NSP, and whether a correlation exists between a positive BD response and a clinical diagnosis of obstructive lung disease in subjects with NSP.13 Our aim was to explore the clinical characteristics and spirometric data associated with a clinician's diagnosis of obstructive lung disease in a population with NSP.
Material and methodsStudy designData was retrospectively extracted from the Vmax™ Encore PFT System software at a single healthcare facility (Steward St. Elizabeth's Medical Center, Boston, MA, USA). Data for adult patients with complete or partial pulmonary function testing were included. PFT performance and PFT device maintenance followed American Thoracic Society and European Respiratory Society standardized techniques for quality assurance. Reference values and reference ranges for spirometry were calculated using the NHANES III equations14 and they were extrapolated for subjects greater than 80 years old. A correction factor of 0.88 was applied for Asian-Americans.15 European Respiratory Society equations16 were used for lung volumes and they were extrapolated for subjects greater than 70 years old.
We retrospectively reviewed the medical record of subjects older than 18 years of age who demonstrated NSP on at least one PFT between 1/1/2014 and 7/1/2020. If a subject had multiple PFT's meeting inclusion criteria, only the earliest PFT was included. Study subjects were then separated into ‘obstructive’ or ‘non-obstructive’ groups based on the treating physician's primary pulmonary clinical diagnosis at the last known clinic visit that addressed pulmonary symptoms. This study was approved by the Institutional Review Board (IRB) at Steward St. Elizabeth's Medical Center in April 2021. The IRB determined that the authors met the regulatory requirements necessary in order to obtain a waiver of informed consent/authorization.
DefinitionsNSP was defined as FEV1 and/or FVC being less than the lower limit of normal (LLN) but with both the FEV1/FVC ratio and TLC being greater than or equal to the LLN. Pre-BD spirometric values were used in the definition of NSP unless otherwise delineated. Two different criteria for determining a significant bronchodilator response were assessed and defined as follows: (Criteria A) an increase of greater than or equal to 12% from baseline FEV1 (and/or FVC) with a greater than or equal to 0.2L in FEV1 (and/or FVC)1,2 and (Criteria B) an increase of greater than 8% from reference in FEV1 (and/or FVC).17 TLC was determined by either body plethysmography or nitrogen washout. The obstructive cohorts of study subjects were those given a diagnosis in the medical record of asthma, COPD, bronchiectasis, or a primary bronchiolar disorder such as bronchiolitis. The non-obstructive subjects were those assigned any other pulmonary diagnosis that was not included in the definition of obstructive lung disease. A “complete” PFT was one that included measurements of FEV1, FVC, FEV1/FVC ratio and TLC.
Data collectionDe-identified study data were collected and managed using REDCap (Research Electronic Data Capture) tools hosted at Tufts University – Clinical and Translational Science Institute.18,19
Statistical analysisThe t-test was used to compare differences between groups where the data were normally distributed, while the non-parametric Wilcoxon rank sum test was used to compare differences where normality was not met. The Chi-square test or Fisher exact (FE) tests were used to test for associations between group and categorical variables.
ResultsA total of 16,156 complete and partial PFTs were extracted for the study period between 1/1/2004 and 7/1/2020. Of those who had a complete study (n=9447), 545 PFTs demonstrated NSP (prevalence of 5.8%). After excluding multiple PFTs from the same study subject (n=9) and restricting the study period start date to 1/1/2014 (n=11,059) to reflect the availability of the electronic medical record, 111 subjects with NSP were identified that met the final inclusion criteria. TLC was determined by body plethysmography in the majority (92%) of these 111 subjects.
Clinical symptoms in NSPOf the 111 subjects demonstrating NSP, 71 (64%) were classified as obstructive based on the treating physician's primary pulmonary clinical diagnosis at the last known clinic visit that addressed pulmonary symptoms, while 40 (36%) were classified as non-obstructive. Compared to the non-obstructive group, cough, wheezing and sputum production were documented more frequently in those with an obstructive lung disease diagnosis (Table 1). There were significantly more inhalers listed in the medication lists in the obstructive group. Notably, age, body mass index, tobacco use and residual volume (RV)/TLC ratio were not significantly different between groups.
Demographics and clinical characteristics of study populations.
| Variable | Non-obstructive diagnosis (n=40) | Obstructive diagnosis (n=71) | P-value |
|---|---|---|---|
| Age (years) | 58.75 (13.72)a | 59.38 (11.53)a | 0.80 |
| Body mass index (BMI) | 29.61 (7.36)a | 32.11 (32.11)a | 0.16 |
| Height (cm) | 168.03 (9.57)a | 166.27 (10.73)a | 0.39 |
| Sex | |||
| Female | 25 (62.50) | 48 (67.61) | 0.59 |
| Male | 15 (37.50) | 23 (32.39) | |
| Symptoms | |||
| Cough | 13 (32.50) | 41 (57.75) | 0.01 |
| Wheezing | 5 (12.50) | 25 (35.21) | 0.01 |
| Sputum production | 0 (0.00) | 13 (18.31) | 0.004 FE |
| Hemoptysis | 2 (5.00) | 1 (1.41) | 0.29 FE |
| Dyspnea at rest | 4 (10.00) | 4 (5.63) | 0.46 FE |
| Dyspnea on exertion | 21 (52.50) | 43 (60.56) | 0.41 |
| Orthopnea | 2 (5.00) | 2 (2.82) | 0.99 FE |
| Lower extremity edema | 3 (7.50) | 6 (8.45) | 0.62 FE |
| Chest tightness | 13 (32.50) | 40 (56.34) | 0.99 FE |
| Comorbidities | |||
| Congestive heart failure | 3 (7.50) | 11 (15.49) | 0.22 |
| Coronary artery disease | 7 (17.50) | 11 (15.49) | 0.78 |
| Interstitial lung disease | 3 (7.50) | 2 (2.82) | 0.35 FE |
| Autoimmune disease | 4 (10.00) | 5 (7.04) | 0.72 FE |
| Hypertension | 23 (57.50) | 50 (70.42) | 0.17 |
| Lung cancer | 7 (17.50) | 4 (5.63) | 0.05 FE |
| Diabetes mellitus | 12 (30.00) | 21 (29.58) | 0.96 |
| Chronic kidney disease | 1 (2.50) | 8 (11.27) | 0.15 FE |
| Gastroesophageal reflux disease | 11 (27.50) | 27 (38.03) | 0.26 |
| Tobacco | |||
| Never | 15 (37.50) | 18 (25.35) | 0.16 |
| Former | 16 (40.00) | 27 (38.03) | |
| Current | 8 (20.00) | 26 (36.62) | |
| Medications | |||
| Proton pump inhibitor/H2 receptor antagonist | 21 (52.50) | 40 (56.34) | 0.7 |
| Leukotriene receptor antagonist | 0 (0.00) | 13 (18.31) | 0.004 FE |
| Chronic steroids | 5 (12.50) | 4 (5.63) | 0.28 FE |
| Biologics | 0 (0.00) | 2 (2.82) | 0.53 FE |
| Alive as of 12/31/2020 | 35 (87.50) | 65 (91.55) | 0.52 FE |
| Follow up days | 161 [0, 1033]b | 290 [46, 931]b | 0.34 |
Values are N (%). Asthma and COPD were both present in ∼60% of patients in the obstructive group.
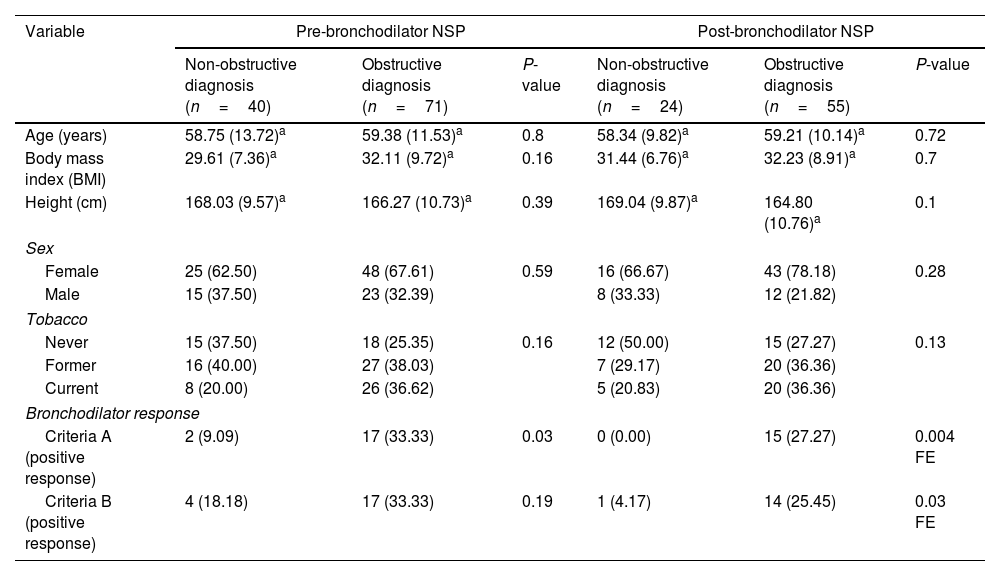
In those who met NSP criteria using either pre- or post-BD spirometry, having a significant BD response, using the standard definition ‘Criteria A’ (≥12% change from baseline and ≥200mL increase in FEV1 and/or FVC),1 was associated with a clinical diagnosis of obstructive lung disease (Table 2). When using a previously published alternative definition of BD response ‘Criteria B’ (increase of >8% change from the predicted reference in FEV1 and/or FVC),17 the association between a clinical obstructive diagnosis and BD response was only significant when using the post-BD NSP definition.
Demographics and PFT data for both NSP definitions using pre-BD and post-BD spirometric values, respectively.
| Variable | Pre-bronchodilator NSP | Post-bronchodilator NSP | ||||
|---|---|---|---|---|---|---|
| Non-obstructive diagnosis (n=40) | Obstructive diagnosis (n=71) | P-value | Non-obstructive diagnosis (n=24) | Obstructive diagnosis (n=55) | P-value | |
| Age (years) | 58.75 (13.72)a | 59.38 (11.53)a | 0.8 | 58.34 (9.82)a | 59.21 (10.14)a | 0.72 |
| Body mass index (BMI) | 29.61 (7.36)a | 32.11 (9.72)a | 0.16 | 31.44 (6.76)a | 32.23 (8.91)a | 0.7 |
| Height (cm) | 168.03 (9.57)a | 166.27 (10.73)a | 0.39 | 169.04 (9.87)a | 164.80 (10.76)a | 0.1 |
| Sex | ||||||
| Female | 25 (62.50) | 48 (67.61) | 0.59 | 16 (66.67) | 43 (78.18) | 0.28 |
| Male | 15 (37.50) | 23 (32.39) | 8 (33.33) | 12 (21.82) | ||
| Tobacco | ||||||
| Never | 15 (37.50) | 18 (25.35) | 0.16 | 12 (50.00) | 15 (27.27) | 0.13 |
| Former | 16 (40.00) | 27 (38.03) | 7 (29.17) | 20 (36.36) | ||
| Current | 8 (20.00) | 26 (36.62) | 5 (20.83) | 20 (36.36) | ||
| Bronchodilator response | ||||||
| Criteria A (positive response) | 2 (9.09) | 17 (33.33) | 0.03 | 0 (0.00) | 15 (27.27) | 0.004 FE |
| Criteria B (positive response) | 4 (18.18) | 17 (33.33) | 0.19 | 1 (4.17) | 14 (25.45) | 0.03 FE |
Values are N (%).
The NSP cohort was divided into subgroups based on subjects meeting criteria for NSP using pre- and post-BD spirometric values. Two pairs of subgroups were defined as follows: (Group A) subjects meeting NSP criteria with pre-BD values, but not with their post-BD values and (Group B) subjects meeting NSP criteria with post-BD values, but not with their pre-BD values (Table 3). Subjects in Group A either met criteria for obstruction or developed normal spirometry after BD administration, while subjects in Group B were reclassified from either obstruction or normal spirometry to NSP after BD administration.
Demographics and clinical characteristics of subgroup populations.
| Variable | NSP using pre-BD values, but not in their post-BD values | NSP using post-BD values, but not in their pre-BD values | ||
|---|---|---|---|---|
| Became obstructed (n=11) | Became normal (n=15) | Were normal (n=11) | Were obstructed (n=22) | |
| Age (years) | 64.63 (7.11)a | 56.08 (15.2)a | 57.13 (8.8)a | 57.85 (9.95)a |
| Body mass index (BMI) | 28.62 (8.54)a | 31.60 (10.75)a | 31.76 (7.86)a | 31.08 (6.29)a |
| Height (cm) | 166.09 (9.21)a | 171.67 (10.17)a | 166.09 (13.74)a | 168.68 (10.34)a |
| Sex | ||||
| Female | 7 (63.64) | 7 (46.67) | 6 (54.55) | 15 (68.18) |
| Male | 4 (36.36) | 8 (53.33) | 5 (45.45) | 7 (31.82) |
| Symptoms | ||||
| Cough | 5 (45.45) | 9 (60.00) | 7 (63.64) | 12 (54.55) |
| Wheezing | 3 (27.27) | 3 (20.00) | 2 (18.18) | 5 (22.73) |
| Sputum production | 2 (18.18) | 2 (13.33) | 0 (0.00) | 1 (4.55) |
| Hemoptysis | 1 (9.09) | 1 (6.67) | 0 (0.00) | 0 (0.00) |
| Dyspnea at rest | 0 (0.00) | 1 (6.67) | 0 (0.00) | 0 (0.00) |
| Dyspnea on exertion | 4 (36.36) | 11 (73.33) | 4 (36.36) | 10 (45.45) |
| Orthopnea | 1 (9.09) | 0 (0.00) | 0 (0.00) | 1 (4.55) |
| Lower extremity edema | 0 (0.00) | 0 (0.00) | 1 (9.09) | 2 (9.09) |
| Chest tightness | 2 (18.18) | 0 (0.00) | 0 (0.00) | 0 (0.00) |
| Comorbidities | ||||
| Congestive heart failure | 1 (9.09) | 2 (13.33) | 1 (9.09) | 1 (4.55) |
| Coronary artery disease | 2 (18.18) | 3 (20.00) | 3 (27.27) | 0 (0.00) |
| Interstitial lung disease | 1 (9.09) | 0 (0.00) | 0 (0.00) | 2 (9.09) |
| Autoimmune disease | 1 (9.09) | 2 (13.33) | 1 (9.09) | 0 (0.00) |
| Hypertension | 8 (72.73) | 9 (60.00) | 9 (81.82) | 7 (31.82) |
| Lung cancer | 0 (0.00) | 1 (6.67) | 0 (0.00) | 2 (9.09) |
| Diabetes mellitus | 4 (36.36) | 5 (33.33) | 3 (27.27) | 6 (27.27) |
| Chronic kidney disease | 0 (0.00) | 1 (6.67) | 0 (0.00) | 2 (9.09) |
| Gastroesophageal reflux disease | 7 (63.64) | 4 (26.67) | 7 (63.64) | 5 (22.73) |
| Tobacco | ||||
| Never | 1 (9.09) | 4 (26.67) | 5 (45.45) | 6 (30.00) |
| Former | 6 (54.55) | 9 (60.00) | 3 (27.27) | 7 (35.00) |
| Current | 4 (36.36) | 2 (13.33) | 3 (27.27) | 7 (35.00) |
| Medications | ||||
| Proton pump inhibitor/H2 receptor antagonist | 5 (45.45) | 8 (53.33) | 10 (90.91) | 7 (31.82) |
| Leukotriene receptor antagonist | 2 (18.18) | 1 (6.67) | 0 (0.00) | 3 (13.64) |
| Chronic steroids | 0 (0.00) | 2 (13.33) | 1 (9.09) | 0 (0.00) |
| Biologics | 0 (0.00) | 0 (0.00) | 0 (0.00) | 0 (0.00) |
| Alive as of 12/31/2020 | 11 (100.00) | 14 (93.33) | 11 (100.00) | 16 (80.00) |
| Follow up days | 139 [0, 931]b | 298 [70, 709]b | 369 [133, 706]b | 412 [38, 1142]b |
Values are N (%).
Our study found a significant association between certain clinical characteristics and spirometric values and a clinician's diagnosis of obstructive lung disease in a cohort of study subjects with NSP. These results are informative given that the interpretation of NSP in clinical settings presents challenges for physicians both prognostically and therapeutically. In this study, nearly two thirds of patients with NSP carried a clinical diagnosis of obstructive lung disease and they were more likely to endorse classical symptoms consistent with this group of disorders – cough, sputum production and wheezing.
Approximately one third of patients with NSP in this study were not assigned an obstructive lung disease diagnosis by their treating physician and this highlights the uncertain nature of NSP and the broader diagnostic potential within this group. Given these findings, clinicians should strongly consider the clinical context and presence of supporting symptoms before assigning a fixed diagnosis to those with NSP.
While it is standard to use post-BD spirometric values in the definition of COPD,20 the same has not been established for NSP. The role for the addition of a BD challenge with NSP was suggested by Pellegrino et al.,1 but there is a lack of evidence in support of this. Iyer et al.13 demonstrated that in those with NSP, a positive BD response, a history of smoking, and higher TLC – alveolar volume (VA) values were all predictors of the development of obstruction on a subsequent PFT when excluding specific airway resistance. Our study provides evidence that in those with NSP, whether identified using pre- or post-BD spirometry values, the presence of a positive BD response is associated with a clinical diagnosis of obstructive lung disease. This observation supports the importance of incorporating BD testing into standard PFT interpretation algorithms for those demonstrating NSP.
The clinical trajectory of patients with PRISm has been the subject of investigation in recent years,7-9,21 specifically assessing whether new spirometric abnormalities are likely to develop on subsequent testing and whether patients can be recategorized when using different classification criterion. For example, Blagev et al.22 showed that 20% of PFT's that originally demonstrated NSP were reclassified as obstructive when utilizing the largest measured vital capacity (VCmax) instead of the classically used FVC. To our knowledge, our study is the first attempt at clinically characterizing subgroups of patients based on the presence or absence of NSP in pre- and post-BD spirometric values. The clinical relevance of this grouping is unknown at this time, but identifying and describing such subgroups is a first step.
We advocate for utilizing precise definitions for PFT patterns of NSP and PRISm. They are similar but separate entities that should not be used interchangeably. The term PRISm should only be used when TLC data is unavailable. The use of detailed definitions becomes even more imperative with the emergence of the newer Global Lung Initiative (GLI) spirometric prediction equations23 and the lack of consensus on whether to use pre- or post-BD spirometric values in the definition of NSP.
Despite a large PFT database, a large number of study subjects were excluded due to lack of access to electronic medical records prior to 1/1/2014. The study was also limited by its retrospective nature at a single acute care center as well as a relatively small sample size. Additionally, obstructive sleep apnea was not included as a relevant comorbidity in our cohort, which may have provided additional associations of interest. There were no obvious survival difference signals between the obstructive and non-obstructive groups, but diffusing capacity was not included in this study. A low diffusing capacity has been shown to be a significant risk factor for all-cause mortality in subjects with PRISm24 so including diffusing capacity in future NSP studies is necessary. In retrospect, using the updated GLI reference equations would have been reasonable and even more astute given the potential for misinterpretation of PFT results and the inaccuracies with the older equations. Prospective studies involving NSP utilizing GLI equations are warranted.
In conclusion, this study demonstrated that subjects with NSP that carried an obstructive lung disease diagnosis (approximately two thirds of the study population) were more likely to be affected by symptoms consistent with this group of disorders, such as cough, wheezing and sputum production. It also supported the role of BD testing in subjects with NSP given that a positive response was associated with a clinical diagnosis of obstruction.
Notation of prior abstract publication/presentationThis work has been presented in part at the Annual Research Day of Steward – St. Elizabeth's Medical Center, Boston, MA, USA (May 5, 2022), and the American Thoracic Society Annual Conference in San Francisco, CA, USA (May 13–18, 2022).
FundingThe data collection and analysis portion of this project was supported in part by Tufts University – Clinical and Translational Science Institute (Grant Number UL1TR002544).
Authors’ contributionsJames Tasch: conceptualization, data curation/acquisition, formal analysis, writing – original draft, writing – review & editing.
Samer Abujaber: data acquisition, writing – review & editing.
Laith Hattar: data acquisition.
Aju Jose: data acquisition.
Lori Lyn Price: formal analysis, writing – review & editing.
Peter LaCamera: conceptualization, writing – review & editing.
Hernan Avella: conceptualization, data curation, writing – review & editing.
Conflicts of interestAll authors have no conflicts of interests to disclose that could have appeared to influence the work reported in this paper.
The authors would like to thank research coordinator, Alexandra Cawood, of Steward St. Elizabeth's Medical Center, Division of Pulmonary, Critical Care and Sleep Medicine.