


Soluble suppressor of tumorigenicity-2 (sST2) is a biomarker for heart failure and pulmonary injury. We hypothesize that sST2 could help predict severity of SARS-CoV-2 infections.
MethodssST2 was analyzed in patients consecutively admitted for SARS-CoV-2 pneumonia. Other prognostic markers were also measured. In-hospital complications were registered, including death, ICU admission, and respiratory support requirements.
Results495 patients were studied (53% male, age: 57.6±17.6). At admission, median sST2 concentrations was 48.5ng/mL [IQR, 30.6–83.1ng/mL] and correlated with male gender, older age, comorbidities, other severity biomarkers, and respiratory support requirements. sST2 levels were higher in patients who died (n=45, 9.1%) (45.6 [28.0, 75.9]ng/mL vs. 144 [82.6, 319] ng/mL, p<0.001) and those admitted to ICU (n=46, 9.3%) (44.7 [27.5, 71.3] ng/mL vs. 125 [69.0, 262]ng/mL, p<0.001). sST2 levels>210ng/mL were a strong predictor of complicated in-hospital courses, with higher risk of death (OR, 39.3, CI95% 15.9, 103) and death/ICU (OR 38.3, CI95% 16.3–97.5) after adjusting for all other risk factors. The addition of sST2 enhanced the predictive capacity of mortality risk models.
ConclusionssST2 represents a robust severity predictor in COVID-19 and could be an important tool for identifying at-risk patients who may benefit from closer follow-up and specific therapies.
El supresor soluble de tumorigenicidad 2 (sST2) es un biomarcador de insuficiencia cardiaca y daño pulmonar. Nuestra hipótesis es que la determinación de sST2 al ingreso podría ayudar a predecir la gravedad de la infección por SARS-CoV-2.
MétodosSe analizó la concentración de sST2 en pacientes ingresados por neumonía por SARS-CoV-2, junto con otros biomarcadores pronósticos conocidos. Asimismo, se registraron las complicaciones durante la estancia hospitalaria, incluidas la muerte, el ingreso en Unidad de Cuidados Intensivos (UCI) y los requerimientos de soporte respiratorio.
ResultadosSe estudiaron 495 pacientes (53% hombres, edad 57,6 ± 17,6). Al ingreso, la mediana de la concentración de sST2 fue 48,5 ng/mL (índice intercuartílico [IQR] 30,6-83,1 ng/mL) y correlacionó con el género masculino, una mayor edad, comorbilidades, otros biomarcadores de gravedad, así como necesidad de soporte respiratorio. Los niveles de sST2 fueron mayores en pacientes que fallecieron (n = 45, 9,1%) (45,6 [28,0, 75,9] ng/mL vs. 144 [82,6, 319] ng/mL, p < 0,001) y aquellos que requirieron ingreso en UCI (n = 46, 9,3%) (44,7 [27,5, 71,3] ng/mL vs. 125 [69,0, 262] ng/mL, p < 0,001). Así, los valores de sST2 > 210 ng/mL se han demostrado como un fuerte predictor de complicaciones, con un mayor riesgo de fallecimiento (odds ratio [OR], 39,3, intervalo de confianza [IC] 95% 15,9, 103) y fallecimiento o ingreso en UCI (OR 38,3, IC 95% 16,3-97,5), tras el ajuste por todos los demás factores de riesgo. La adición de la determinación de los niveles de sST2 mejoró la potencia predictiva de los modelos de riesgo desarrollados.
ConclusionesEl sST2 representa un predictor robusto de la gravedad en pacientes con COVID-19 y podría convertirse en una herramienta importante para la identificación de pacientes en riesgo que podrían beneficiarse de un mayor seguimiento y terapias específicas.
The novel coronavirus SARS CoV-2 (Severe Acute Respiratory Syndrome coronavirus 2) is the causative agent of coronavirus disease 2019 (COVID-19), which has spread rapidly, leading the global population to pandemic conditions and individual countries to healthcare collapse.1,2 The clinical manifestations of COVID-19 range from patients with asymptomatic infection or mild upper respiratory tract involvement to patients with severe pneumonia that develops into acute respiratory distress syndrome (ARDS) with multiorgan involvement and/or failure and requires admission to intensive care units (ICUs) for treatment with high-flow oxygen or mechanical ventilation.3 Immune and inflammatory responses in SARS-CoV-2 infection determine the disease severity of the disease, causing the infamous cytokine storm.
Tumorigenicity suppressor 2 (ST2) is part of the interleukin-1 receptor (IL-1) family of proteins and is involved in inflammatory processes such as autoimmune diseases, sepsis, asthma, or pulmonary fibrosis. ST2 is the receptor for interleukin-33, a cytokine of a type known as “alarmins” that are secreted by most cells in the body in response to cellular damage or stress. Two biologically relevant isoforms of ST2 are produced by alternative splicing of the ST2 gene: a transmembrane isoform (ST2L) and a soluble and circulating isoform (sST2).4,5 The IL-33/ST2L signaling pathway serves a protective function by reducing the inflammatory response and preventing fibrosis, cardiomyocyte hypertrophy, and apoptosis in patients with heart failure (HF).6 By contrast, sST2 acts as a decoy receptor, as it binds more avidly than ST2L to IL-33, thereby reducing the ST2L/IL-33 interaction and attenuating the favorable effects of the ST2L isoform.
In addition to the cardiological effects of sST2, different studies have provided sufficient evidence to support a role for sST2 in several lung diseases, such as asthma, ARDS, and pulmonary fibrosis.7–9 Alladina et al.10 described an association between sST2 levels and the need for mechanical ventilation, reintubation, and mortality in patients with ARDS. Likewise, Pascual-Figal et al. demonstrated that, in decompensated heart failure (HF), sST2 originates mostly in the lungs, specifically in type II pneumocytes, in response to myocardial damage.11 Their evidence came via the use of an experimental model of HF in rodents, in which they observed an increase in the expression of sST2 in the lungs.
The aim of this study was to determine the clinical performance of sST2 as a biomarker for the prognosis of severe COVID-19 disease, defined as admission to the ICU, as well as death.
Materials and methodsStudy populationThis prospective observational study was conducted on 495 patients hospitalized from July 2020 to March 2021 with SARS CoV-2 pneumonia at the Virgen de la Arrixaca tertiary hospital in Murcia, Spain. We included adult patients (over 18 years of age) with a diagnosis of COVID-19 confirmed by a polymerase chain reaction (PCR) test of nasopharyngeal exudate who had undergone a blood analysis at admission and for whom a blood sample was available. Patients admitted to our hospital by referral from other health centers were excluded. Even though the vaccination fin Spain started at the end of December 2020, just one of the patients had received the first dose of Pfizer vaccine before his hospitalization for COVID pneumonia.
Biological samples were obtained at the time of hospital admission and were collected, processed, and transferred by the Network Biobank of the Region of Murcia, BIOBANC-MUR, registered in the National Registry of Biobanks (registration number: B.0000859), following standard working procedures and with the approval of the Ethics Committee and the Scientific Committee. Virgen de la Arrixaca University Hospital Clinical Research Ethics Committee (CEIm), internal code: 2020-6-1-4HCUVA.
Patients provided signed informed consent for the conservation of the samples and their use in clinical research. The study was approved by the hospital's ethics committee.
Variables and clinical eventsThe demographic variables of the patients at the time of admission and the clinical events during hospitalization were collected. These variables included clinical risk factors, such as gender, age, and the presence of comorbidities, as well as analytical parameters, including hematological parameters (blood count and coagulation with D-dimer), markers of renal, hepatic, and cardiac function, and biomarkers of inflammation. The WHO Clinical Progression Scale was also scored for each patient. Clinical events occurring during hospitalization were defined as death, intensive care requirements (high-flow non-invasive oxygen, invasive mechanical ventilation, or extracorporeal membrane oxygenation), clinical deterioration in terms of WHO and Sequential Organ Failure Assessment (SOFA) scales, development of respiratory distress, and need for oxygen at discharge.
Analytical methodsBlood samples were taken at the time of hospital admission in vacuum tubes for serum, with lithium heparin as an anticoagulant for biochemical determinations, with citrate for coagulation tests, and with EDTA K3 for blood counts.
Blood counts were performed on an XN 4000i hematology (Sysmex®) analyzer. The determination of the basic coagulation and D-dimer tests were performed in an ACL TOP 350 analyzer (Werfen®). In accordance with the hospital's COVID-19 protocol, a panel of biochemical determinations was established and conducted using a Cobas® 8000 system (Roche Diagnostics®). This panel included biochemical assessments of renal function (urea and creatinine), liver function (AST, ALT, GGT, and bilirubin), inflammation (using ferritin, high-sensitive C-reactive protein [hs-CRP], and interleukin-6), and heart damage (using NT-proBNP and Troponin T).
Soluble ST2 was measured using the SEQUENT-IA™ ST2 assay test. This is a homogeneous quantitative monoclonal immunoassay from Critical Diagnostics® that uses turbidimetry for the measurement of serum-soluble ST2. The assay was adapted to be measured in a Cobas® c502 analyzer (Roche Diagnostics). According to the manufacturer, the minimum detectable value is 10.8ng/ml, being the lower linear limit 15ng/ml and the upper linear limit 300ng/ml. A concentration of 35ng/mL is between the 90th and 95th percentile of the normal population. It can be measured both in serum and EDTA anticoagulated plasma, and the test duration is around 15min. Thus, the sST2 measurement can be performed at the emergency laboratory in half an hour.
Statistical analysisDescriptive analyses were performed based on the quartiles of sST2. For numerical variables, means with standard deviations or median with interquartile ranges were calculated depending on their normal distribution. For categorical variables, their frequencies were calculated as percentages. The numerical variables were compared using ANOVA or the Kruskal–Wallis test (in cases of non-normality). The categorical variables were compared using the chi-square test or Fisher's exact test (for variables complying with the Cochran Q test).
Receiver operating characteristic (ROC) curves were analyzed to study the capacity of numerical values of sST2 marker to predict death and ICU events. To compare both of them, DeLong test was used.
Logistic regressions were adjusted for the events of death and admission to the ICU and for the combined event of death and admission to the ICU. As a preliminary step, each variable was categorized into different levels of risk using the stratum-specific likelihood ratios (SSLRs) method of Peirce and Cornell.12 This method allows to categorize a variable into different risk groups by calculating the probability of having a risk event in each group, using information about the prevalence of the risk event and the sensitivity and specificity of a test in each subgroup. Starting with five strata, having the death event evenly distributed, sST2 was categorized into three risk levels.
Three logistic regression models were fitted to predict the death event based on the sST2 risk groups. The first model used covariates with clinical importance (age, sex, D Dimer, Ferritin, Troponin T and IL-6); the second one added sST2 to see its prediction potential, and the third model used the stepwise method with bidirectional elimination to choose the best predictive variables based on the Akaike information criterion (AIC). AIC penalizes models with more parameters, so the best model is the one that explains the most variation using the fewest independent variables (lower AIC scores are better). In addition to AIC, the likelihood ratio test has been used to compare the models.
All statistical analyses were performed with the R, v.4.1 statistical software.
ResultsStudy populationThe study population consisted of 495 patients (53% male), with a mean age of 57.6±17.6 years and median age of 57.0 and interquartile range (IQR) of [46.0, 72.0] years (Table 1). Overall, 43.6% of the patients were overweight or obese (BMI>30kg/m2), and 13.4% had some type of lung disease. Their cardiovascular risk factors included arterial hypertension as the most frequent (42.8%), followed by hypercholesterolemia (34.3%) and diabetes mellitus (30.4%). Some (18.4%) presented evidence of cardiovascular disease, with cerebrovascular issues (8.7%) and atrial fibrillation (5.3%) as the most frequent signs (supplemental Table 1). At admission, the duration of symptoms was a median of 6 days, and the WHO class score was ≥4 in 58.6% of the patients.
Distribution of the clinical characteristics at baseline by quartiles of ST2.
| sST2 quartiles | ||||||
|---|---|---|---|---|---|---|
| Overall | <30.5 | 30.6–48 | 49–83.1 | >83.1 | p | |
| N | 495 | 125 | 122 | 123 | 125 | |
| Age, years | 57.0 [46.0, 72.0] | 49.0 [40.0, 62.0] | 53.9 [45.1, 66.0] | 62.0 [51.0, 76.0] | 64.0 [52.6, 78.0] | <0.001 |
| Male | 262 (53.0) | 42 (33.6) | 60 (49.2) | 73 (59.8) | 87 (69.6) | <0.001 |
| BMI, kg/m2 | 28.9±5.70 | 27.4±7.36 | 28.4±3.46 | 30.5±4.92 | 28.8±5.70 | 0.266 |
| Obesity (BMI>30kg/m2) | 78 (43.6) | 17 (38.6) | 14 (37.8) | 20 (40.8) | 27 (55.1) | 0.292 |
| Characteristics at admission | ||||||
| Lengh of symptoms, days | 6 [3, 8] | 7 [3, 9] | 6 [3, 9] | 6 [3, 8] | 5 [3, 7] | 0.244 |
| Lengh of hospitalization, days | 6 [4, 10] | 5 [3, 7] | 6 [3, 8] | 7 [5, 10] | 9 [5, 14] | <0.001 |
| WHO scale | <0.001 | |||||
| <4 | 192 (41.4) | 73 (60.3) | 54 (46.6) | 37 (31.6) | 28 (25.5) | |
| ≥4 | 272(58.6) | 48 (39.7) | 62 (53.4) | 80 (68.4) | 82 (74.5) | |
| Respiratory rate | 19.7±6.14 | 17.7±5.92 | 18.2±4.96 | 20.0±5.09 | 22.2±7.32 | 0.004 |
| Sat O2before O2, % | 93.3±6.29 | 95.7±3.14 | 94.8±4.26 | 92.6±5.09 | 89.7±9.46 | <0.001 |
| Sat O2after O2, % | 96.2±2.83 | 96.6±2.52 | 96.8±2.15 | 95.9±2.27 | 95.7±3.65 | 0.351 |
| Biomarkers | ||||||
| D-dimer, ng/ml | 284 [180, 515] | 237 [151, 366] | 231 [165, 395] | 326 [203, 545] | 360 [245, 741.3] | <0.001 |
| Ferritine, ng/ml | 413 [192, 906] | 274 [112, 492] | 344 [204, 645] | 513 [226, 990] | 875 [333, 1475] | <0.001 |
| IL-6, pg/ml | 39.0 [16.2, 69.3] | 20.0 [8.30, 34.8] | 36.7 [18.8, 60.3] | 53.5 [30.8, 81.3] | 54.3 [17.3, 117] | <0.001 |
| hs-CRP, mg/dl | 5.40 [2.37, 11.5] | 2.59 [0.91, 4.63] | 5.11 [2.02, 9.71] | 9.03 [4.12, 15.0] | 9.04 [4.38, 15.2] | <0.001 |
| hs-c TnT, pg/ml | 8.00 [5.00, 17.0] | 5.00 [4.00, 9.00] | 6.00 [4.00, 12.8] | 10.0 [6.00, 18.8] | 13.0 [6.00, 34.0] | <0.001 |
| NT-proBNP, pg/ml | 105 [38.1, 386] | 39.9 [16.8, 125] | 76.3 [33.0, 196] | 159 [61.7, 561] | 296 [100, 1672] | <0.001 |
BMI: body mass index; mean± n (%).
At admission, the patients’ sST2 concentration was 49.2ng/mL (IQR, 30.5–83.6ng/mL). Supplemental Table 1 shows the clinical characteristics at admission, according to the quartiles of sST2. A positive association was observed with male gender (p<0.001) and older patient age (p<0.001). Likewise, higher sST2 concentrations were observed in the presence of comorbidities, such as arterial hypertension (p<0.001), type 2 diabetes mellitus (p=0.025), heart failure (p=0.036), cerebrovascular disease (p=0.042), dementia (p=0.032) and chronic obstructive pulmonary disease (p=0.010). Conversely, a significant association was also found between higher levels of sST2 and higher concentrations of markers of stress and heart damage (NT-proBNP and hs-cTnT), inflammation (IL-6, Ferritin, hs-CRP), and thrombosis (D-Dimer).
An association was observed between sST2 concentrations and clinical severity at admission, in terms of WHO class score (p<0.001), respiratory rate (p=0.004), and oxygen saturation measured in the emergency room (p<0.001).
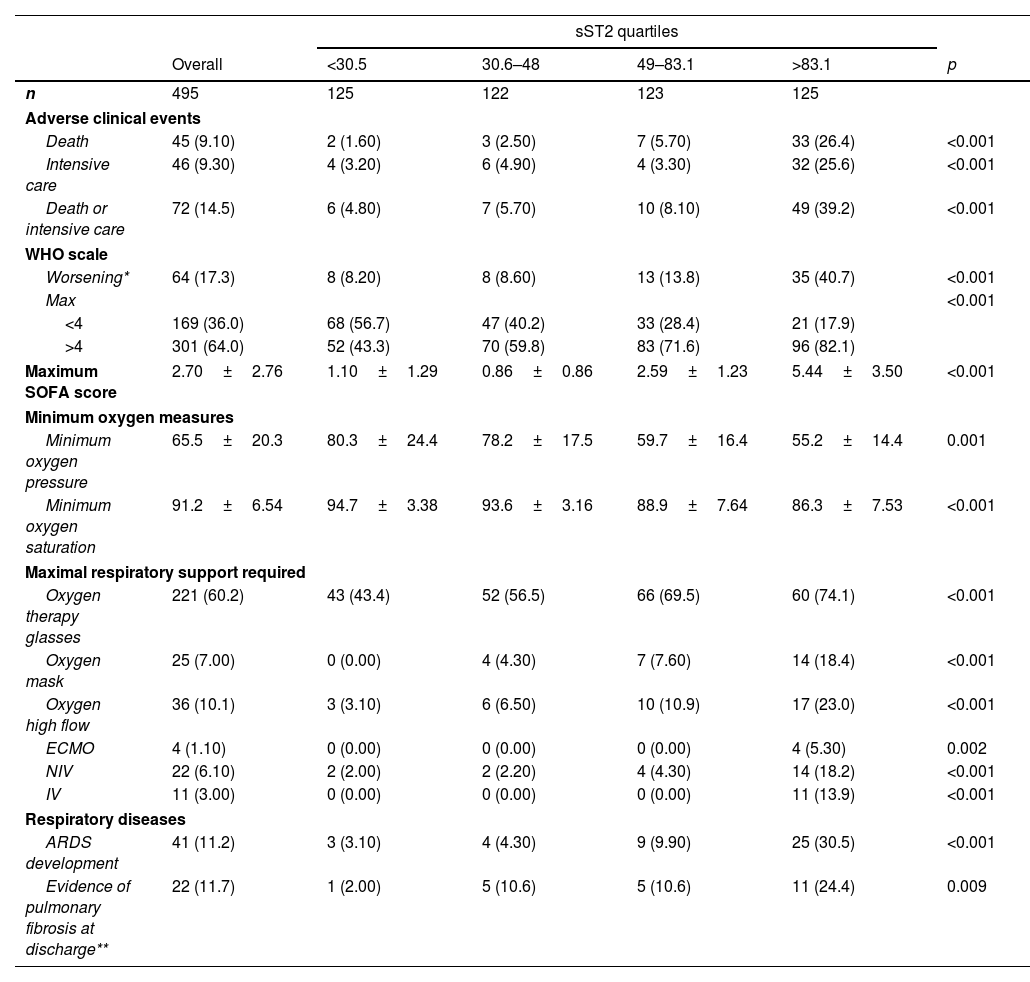
sST2 concentrations and in-hospital evolutionAfter admission, patients were followed during their time of hospitalization (median: 6 days, IQR: 3–8 days), and clinical and respiratory worsening, as well as adverse events, were recorded. During hospital admission, 45 patients died (9.1%), and 46 required admissions to the ICU (9.3%).
As shown in Table 2, the sST2 levels at admission showed a significant association with a worse hospital evolution, with higher rates of clinical deterioration in terms of the WHO (p<0.001) and the SOFA (p<0.001) scales, as well as worsening of oxygen partial pressure (p=0.001) and oxygen saturation (p<0.001), need for respiratory support, development of respiratory distress (p<0.001), need for intensive care (p<0.001), and death (p<0.001).
Distribution of clinical endpoints by quartiles of concentrations of ST2.
| sST2 quartiles | ||||||
|---|---|---|---|---|---|---|
| Overall | <30.5 | 30.6–48 | 49–83.1 | >83.1 | p | |
| n | 495 | 125 | 122 | 123 | 125 | |
| Adverse clinical events | ||||||
| Death | 45 (9.10) | 2 (1.60) | 3 (2.50) | 7 (5.70) | 33 (26.4) | <0.001 |
| Intensive care | 46 (9.30) | 4 (3.20) | 6 (4.90) | 4 (3.30) | 32 (25.6) | <0.001 |
| Death or intensive care | 72 (14.5) | 6 (4.80) | 7 (5.70) | 10 (8.10) | 49 (39.2) | <0.001 |
| WHO scale | ||||||
| Worsening* | 64 (17.3) | 8 (8.20) | 8 (8.60) | 13 (13.8) | 35 (40.7) | <0.001 |
| Max | <0.001 | |||||
| <4 | 169 (36.0) | 68 (56.7) | 47 (40.2) | 33 (28.4) | 21 (17.9) | |
| >4 | 301 (64.0) | 52 (43.3) | 70 (59.8) | 83 (71.6) | 96 (82.1) | |
| Maximum SOFA score | 2.70±2.76 | 1.10±1.29 | 0.86±0.86 | 2.59±1.23 | 5.44±3.50 | <0.001 |
| Minimum oxygen measures | ||||||
| Minimum oxygen pressure | 65.5±20.3 | 80.3±24.4 | 78.2±17.5 | 59.7±16.4 | 55.2±14.4 | 0.001 |
| Minimum oxygen saturation | 91.2±6.54 | 94.7±3.38 | 93.6±3.16 | 88.9±7.64 | 86.3±7.53 | <0.001 |
| Maximal respiratory support required | ||||||
| Oxygen therapy glasses | 221 (60.2) | 43 (43.4) | 52 (56.5) | 66 (69.5) | 60 (74.1) | <0.001 |
| Oxygen mask | 25 (7.00) | 0 (0.00) | 4 (4.30) | 7 (7.60) | 14 (18.4) | <0.001 |
| Oxygen high flow | 36 (10.1) | 3 (3.10) | 6 (6.50) | 10 (10.9) | 17 (23.0) | <0.001 |
| ECMO | 4 (1.10) | 0 (0.00) | 0 (0.00) | 0 (0.00) | 4 (5.30) | 0.002 |
| NIV | 22 (6.10) | 2 (2.00) | 2 (2.20) | 4 (4.30) | 14 (18.2) | <0.001 |
| IV | 11 (3.00) | 0 (0.00) | 0 (0.00) | 0 (0.00) | 11 (13.9) | <0.001 |
| Respiratory diseases | ||||||
| ARDS development | 41 (11.2) | 3 (3.10) | 4 (4.30) | 9 (9.90) | 25 (30.5) | <0.001 |
| Evidence of pulmonary fibrosis at discharge** | 22 (11.7) | 1 (2.00) | 5 (10.6) | 5 (10.6) | 11 (24.4) | 0.009 |
ARDS: acute respiratory distress syndrome; ECMO: extracorporeal membrane oxygenation; IV: invasive ventilation; NIV: non-invasive ventilation. mean±SD, median [IQR] and n (%)
* Worsening defined as an increase in OMS scale of a point or more.
** Tested in 168 patients.
Furthermore, the sST2 concentrations were higher in patients who subsequently died (45.6 [IQR; 28.0, 75.9]ng/mL vs. 144 [IQR; 82.6, 319]ng/mL, p<0.001) and in those requiring ICU admission (44.7 [IQR; 27.5, 71.3]ng/mL vs. 125 [IQR; 69.0, 262]ng/mL, p<0.001), Suplemental Fig. 1.
In addition, among the patients who survived and were discharged, the presence of pulmonary fibrosis in radiology at discharge was 24% in patients in the upper quartile at admission, compared to only 2% in the lower quartile and 10.6% in the intermediate quartiles (p=0.009).
Usefulness of sST2 as a predictor of adverse clinical eventsAnalysis of the receiver operating characteristic (ROC) curve showed an area under the curve for death prediction of 0.837 (0.771–0.901), with 90.1% sensitivity and 68.0% specificity at the selected cut-off point of 63.3ng/mL. For prediction of a need for ICU admission, the area under the ROC curve was 0.762 (0.678–0.847). The selected cut-off point in this case was of 99.9ng/mL, with sensitivity 67.4% and specificity 83.5%.
Using Peirce and Cornell's Stratum-specific Likelihood Ratios method, three subgroups of sST2 concentrations with significantly different risk were obtained: <82.2ng/mL, 82.2–210ng/mL, and >210ng/mL. Fig. 1 shows the frequency of adverse events and the associated risk at each sST2 level. Among the 31 patients with sST2>210ng/mL, the frequencies of adverse events during hospitalization were 54.8% for death, 48.4% for ICU admission, and 71% for intensive care or death. The corresponding ORs were 39.3 (95% CI: 15.9–103), 23.6 (95% CI: 9.85–58.4), and 38.3 (95% CI: 16.3–97.5) for death, the need for intensive care, and ICU/death, respectively.

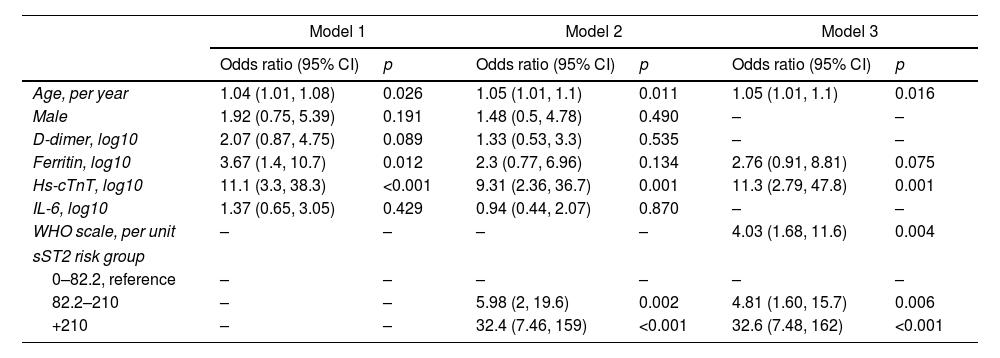
Table 3 shows the additional value of sST2 measurements for the stratification of risk of death during hospitalization. Considering the statistically significant variables in the prediction of death (Table S1) shown in model 1 (age, gender, D-dimer, ferritin, cardiac Troponin T, and IL-6), the addition of sST2 (model 2) significantly improved the predictive value, as reflected in the reduction of the value of AIC. Model 3, in which the best model was sought using the stepwise method, shows that several variables, including age, WHO classification in the first 24h, ferritin and troponin on the logarithmic scale, and categorical sST2, were part of the best model for the prediction of death, with an AIC of 126.89 compared to an AIC of 161.23 and 140.70 of models 1 and 2, respectively.
Logistic regression models for the endpoint all-cause mortality.
| Model 1 | Model 2 | Model 3 | ||||
|---|---|---|---|---|---|---|
| Odds ratio (95% CI) | p | Odds ratio (95% CI) | p | Odds ratio (95% CI) | p | |
| Age, per year | 1.04 (1.01, 1.08) | 0.026 | 1.05 (1.01, 1.1) | 0.011 | 1.05 (1.01, 1.1) | 0.016 |
| Male | 1.92 (0.75, 5.39) | 0.191 | 1.48 (0.5, 4.78) | 0.490 | – | – |
| D-dimer, log10 | 2.07 (0.87, 4.75) | 0.089 | 1.33 (0.53, 3.3) | 0.535 | – | – |
| Ferritin, log10 | 3.67 (1.4, 10.7) | 0.012 | 2.3 (0.77, 6.96) | 0.134 | 2.76 (0.91, 8.81) | 0.075 |
| Hs-cTnT, log10 | 11.1 (3.3, 38.3) | <0.001 | 9.31 (2.36, 36.7) | 0.001 | 11.3 (2.79, 47.8) | 0.001 |
| IL-6, log10 | 1.37 (0.65, 3.05) | 0.429 | 0.94 (0.44, 2.07) | 0.870 | – | – |
| WHO scale, per unit | – | – | – | – | 4.03 (1.68, 11.6) | 0.004 |
| sST2 risk group | ||||||
| 0–82.2, reference | – | – | – | – | – | – |
| 82.2–210 | – | – | 5.98 (2, 19.6) | 0.002 | 4.81 (1.60, 15.7) | 0.006 |
| +210 | – | – | 32.4 (7.46, 159) | <0.001 | 32.6 (7.48, 162) | <0.001 |
In this retrospective observational study with a large sample of hospitalized patients with COVID-19, the plasma concentrations of sST2 in the first 24h of hospitalization showed excellent prognostic value in predicting the risk of clinical worsening and death during hospitalization.
The spread of SARS-CoV-2 around the world has led to a hospital collapse, which has posed an unprecedented challenge to clinicians and governments. COVID-19 can be an asymptomatic or mild illness, or it can lead to the onset of SARS, with respiratory failure, need for respiratory support, and even death in some patients.
After two years of this pandemic, multiple waves of infection, and even with vaccination of the majority of the population, SARSCoV-19 continues to pose a health problem. In this scenario, early identification of patients susceptible to developing more severe symptoms and who will need ventilatory support is essential to improve the individualized treatment of symptomatic patients.
sST2 is the soluble form of tumorigenicity suppressor 2 and participates in the IL-33/ST2 axis, which is involved in the immune response to viruses, as well as in autoimmune diseases, asthma, and pulmonary fibrosis. As our group has previously demonstrated, pulmonary pneumocytes are the main producers of sST2 in response to alveolar damage.11
Abers et al. analyzed a large number of inflammation-related proteins to characterize the immune response to COVID-19, including the activation of different immune cells, such as monocytes/macrophages, neutrophils, T lymphocytes, and nonhematopoietic cells. In their study, sST2 levels, along with other inflammatory markers, such as sTNFRSF1A, IL-10, and IL-15, were increased in COVID-19 patients and showed a strong correlation with disease severity, with marked elevations in patients who died.13
The usefulness of the sST2 biomarker as a predictor of severity in patients with COVID-19 has already been studied by other research groups, although the number of patients included in these studies was smaller than ours. Sánchez-Marteles et al. studied the concentration of sT2 at admission and discharge in 144 patients, 14 of whom required admission to the ICU (9.7%) and 1 who died (0.7%).14 Omland et al. studied 123 patients, of whom 27 were admitted to the ICU (22%) and 8 died (6.5%).15 Alladina et al. studied 72 patients who were admitted to the ICU and 77 patients who were not admitted to the ICU but required oxygen supplementation.16 The average age of the patients in those studies was similar to ours, as was the presence of comorbidities.
In our study, similar to the findings in previous studies,14,15 we found a good association between sST2 levels and markers of inflammation, such as hs-CRP or IL-6, and between sST2 and other acute phase reactants, such as ferritin and D-dimer.
Several studies conducted in recent years have shown sST2 to be very useful in determining the severity and prognosis in patients with heart failure.17 In our analysis, we also found an association between sST2 levels in patients with COVID-19 and markers of stress and heart damage, such as NT-proBNP and troponin T. Increases in Troponin T have also been associated with the severity of COVID infections.18,19 Omland obtained similar results15 whereas Sánchez-Marteles did not study cardiac markers.14
sSt2 has a pulmonary origin, and we have observed a statistically significant association between the levels of this biomarker and the oxygen saturation of patients at admission, as also reported by Omland et al., as well as with the WHO class during the first 24h of hospitalization.15 This agrees with the findings of Alladina et al., who observed that the plasma sST2 concentrations were associated not only with the severity of the disease, but also with the need for respiratory support and, consequently, with persistent lung damage.16
Our analysis of the ROC curves for the prognosis of ICU admission and death showed excellent performance, with an AUC of 0.762 for the case of need for intensive care and an AUC of 0.836 for the prognosis of death. These values are similar to those recently published, although those studies all included fewer patients.14,15,20,21 The previous studies indicated that age and gender, together with inflammatory markers and heart damage, were clear predictors of risk in patients with COVID-19,22–24 similary to our own results (Supplemental Table 2). In our study, we evaluated different risk models that integrate different biomarkers (D-dimer, ferritin, cardiac Troponin T, and IL-6), age, and gender, as well as the clinical status of the patients in terms of their WHO class. In all cases, sST2 provided additional information on these risk variables and is therefore postulated to be a powerful tool for better management of patients with COVID-19.
The main limitation of the present study is that the patients came from two different waves of infection and, in an epidemiological situation, with different variables than in the current wave. However, the robustness of the findings supports the value of sST2 as a marker of risk in the symptomatic COVID-19 patient, although a prospective evaluation in new cohorts would be recommended in the coming years. Another limitation is the absence of serial values of sST2 during hospitalization, since the concentrations were measured only at admission. Our hypothesis is that the serial determination of sST2 values throughout a patient's hospitalization could be of additional benefit in monitoring the risk of disease progression and response to treatment, especially considering the current new treatment options.
In conclusion, this study supports the usefulness of sST2 and the measurement of its circulating concentrations for assessment of the risk of clinical and respiratory deterioration, as well as serious complications, in patients with symptomatic COVID-19 disease and particularly those patients requiring hospital care. Therefore, this biomarker may become an important tool to help identify at-risk patients who may benefit from closer follow-up or even initiation of specific therapies to endeavor to prevent disease progression.
Authors’ contributionsMAC: Investigation, Methodology, Writing – original draft.
JANV: Writing – original draft, Methodology, Conceptualization, Supervision.
IMMA: Investigation, Methodology.
ARP: Formal analysis, Data curation.
ICL: Investigation, Methodology.
AHV: Formal analysis, Data curation.
JARL: Investigation.
AK: Writing – review & editing.
ABG: Writing – review & editing.
DPF: Writing – original draft, Conceptualization, Funding acquisition, Supervision.
Ethical considerationsInformed consent was obtained from all patients as well as the Virgen de la Arrixaca University Hospital Clinical Research Ethics Committee (CEIm), internal code: 2020-6-1-4HCUVA.
FundingNone.
Conflict of interestNone of the authors have any conflict of interest.
We are grateful for the generous contribution of the patients and the collaboration of the Biobank Network of the Region of Murcia, BIOBANC-MUR, registration number B.0000859. BIOBANC-MUR, supported by the “Instituto de Salud Carlos III”, “Instituto Murciano de Investigación Biosanitaria Virgen de la Arrixaca, IMIB” and “Consejería de Salud de la Comunidad Autónoma de la Región de Murcia.”

