


Point of care lung ultrasound (POCUS) has been recently used to assess prognosis in COVID-19 patients. However, there are no data comparing POCUS and chest-X ray, a technique widely used.
Patients and methodsRetrospective analysis in stable COVID-19 patients. Schalekamp radiological lung scale and LUZ-Score ultrasound scale were compared. Primary end-point was in-hospital death and/or need for Intensive Care Unit admission.
ResultsA total of 138 patients were included. Median Schalekamp scale was 2 (2) and median LUZ-Score scale was 21 (10). No significant correlation was observed between both techniques. Patients with a LUZ-Score≥21 points at admission had worse lung function and higher concentrations of LDH, CRP and Interleuquine-6. Schalekamp scale failed to identify patients at a higher risk at admission for the primary end-point. Addition of POCUS to a previous clinical model, improved risk prediction (AUC 0.805 [95% CI: 0.662−0.948]; P=<0.001).
ConclusionsChest X-ray and POCUS showed no correlation at admission in this analysis. Only POCUS identified a group of patients with greater clinical and analytical involvement. POCUS improved, previous clinical model, while chest X-ray did not add relevant predictive information for the primary endpoint.
La ecografía torácica es una técnica novedosa para estratificar el riesgo de los pacientes COVID-19. Sin embargo, no existen datos que comparen dicha técnica con la radiografía de tórax, una técnica ampliamente utilizada en esta enfermedad.
Pacientes y métodosAnálisis retrospectivo en pacientes estables COVID-19. Se compararon la escala de daño pulmonar radiológica de Schalekamp y ecográfica de LUZ-Score. El objetivo primario fue la muerte intrahospitalaria o la necesidad de ingreso en la UCI para tratamiento con ventilación mecánica.
ResultadosSe reclutaron 138 pacientes. La mediana de la escala de Schalekamp fue de 2 (2) y la del LUZ-Score de 21 (10). No se objetivó una correlación significativa entre ambas escalas. Los pacientes con un LUZ-Score≥21 puntos al ingreso presentaron peor función pulmonar y mayores concentraciones de LDH, PCR e interleucina-6. La escala radiológica de Schalekamp no logró identificar a una población de mayor riesgo. Únicamente la adición de la ecografía pulmonar a un modelo de valoración clínica mejoró de manera significativa el área bajo la curva para el objetivo primario (ABC 0,805 [IC 95%: 0,662−0,948]; p≤0,001).
ConclusionesNo se objetivó una correlación entre la afectación radiológica y la ecográfica. Únicamente la ecografía pulmonar identificó un subgrupo de pacientes con una mayor afectación clínico-analítica. La ecografía pulmonar mejoró el modelo de predicción clínico, mientras que la radiografía de tórax no añadió información relevante.
Severe adult respiratory distress virus type 2 (SARS-CoV-2) infection, known as COVID-19, has led to high morbidity and mortality worldwide1,2. The disease has a significant respiratory involvement, capable of producing adult respiratory distress syndrome (ARDS) regardless of age, especially in vulnerable patients2–4. Given that this is an infectious disease capable of producing severe disease in young patients with no medical history2,5, objective tools for early identification of patients at higher risk are vital to improve the prognosis of the disease.
Plain chest X-ray is a simple, safe and widely used technique in the initial assessment of COVID-196. Bilateral radiological involvement has been identified in critically ill patients as an independent risk factor7. However, despite its usefulness, it is an operator-dependent technique and has been found to be most cost-effective when using complex computer models analysing radiological images8, a resource that is not always available in hospitals.
In contrast, lung ultrasound has represented a major breakthrough in the management of this disease9. It is an easy-to-apply, reproducible, harmless technique with results similar to those obtained by computed tomography (CT)10. Grading of COVID-19 lesions using ultrasound scoring systems has been correlated with short-term prognosis11–13, and research related to this technique in COVID-19 is becoming increasingly common14–16.
The hypothesis of this study is that the predictive ability of lung ultrasound is superior to that of X-ray. The objectives of this study are: 1) To analyse the baseline characteristics of a cohort of hospitalised patients according to lung lesions generated by SARS-CoV-2 and identified by X-ray or lung ultrasound. 2) Analyse the correlation between X-ray and lung ultrasound findings. 3) To analyse the predictive capacity of X-ray versus lung ultrasound on admission to identify patients with worse outcome during hospitalisation.
Patients and methodsStudy designA retrospective study conducted in the Infectious Diseases and Internal Medicine departments of a university hospital between July and October 2020. Inclusion criteria for the study have been previously published11. In summary, these were patients aged≥18years admitted with a diagnosis of symptomatic SARS-CoV-2 infection confirmed by PCR or serology (IgM and/or IgG) and who agreed to the study terms. The most important exclusion criteria were previous admission to the intensive care unit (ICU), refusal of the patient or the presence of advanced chronic diseases such as COPD, advanced cognitive impairment or significant functional dependence11.
The patient’s biological and clinical variables were recorded during the first 72h of admission for COVID-19. An approximate calculation of the PaO2/FiO2 was made, defined as the quotient between the saturation of O2 and FiO2 administered (estimated PaO2/FiO2) and the patient’s degree of dyspnoea was quantified using the subjective Borg scale (between 0 and 10)11.
Chest X-rayThe images were obtained from chest X-ray in posteroanterior and/or anteroposterior projection, when performed by portable equipment, during the first 24h of admission and were independently analysed by an expert radiologist, blinded to other clinical and laboratory parameters or clinical events that occurred during follow-up. The quantification of radiological lung lesions was performed according to the validated scale of Schalekamp et al.17. This scale is based on the analysis of four lung quadrants (two in each lung), each one rated from 0 to 2 according to the degree of lung involvement caused by COVID-19, with a final score between 0 and 8 points17,18. The maximum time accepted between the performance of both techniques (chest X-ray and chest ultrasound) was 24h, starting from the first care provided in the emergency department, in order to avoid differences in the identification of lesions depending on the test used.
Lung ultrasoundThe protocol used was the LUZ-Score11. It is a quantitative scale that analyses the degree of ultrasound involvement based on the findings in each of the twelve thoracic quadrants analysed, with a final score between 0 and 48 points. This technique focuses primarily on the analysis of the different lung patterns, paying particular attention to the presence of pulmonary b-lines and/or subpleural consolidations13.
ObjectivesThe primary endpoint of the study was defined as the combined event of in-hospital death and/or need for ICU admission to initiate mechanical ventilation. Several secondary endpoints were also considered: 1) the need for increased flow (FiO2) of oxygen during the first 72h; 2) the need to change or increase previously prescribed drug therapy during the first 72h after admission; and 3) the need to increase oxygen flow and/or drug therapy during the first 72h after admission.
Statistical analysisCategorical variables were expressed as percentages. Continuous variables were expressed as mean ±standard deviation or median (interquartile range [IQR]) according to normal distribution. The comparative analysis of quantitative variables was carried out using Student’s t-test or Mann-Whitney U test, in the case of non-continuous variables. Categorical variables were analysed using the chi square test (χ2). The correlation between the two scales was analysed using Spearman's test.
An initial univariate analysis was carried out to create the different prediction models for the primary endpoint, including those variables that were significant or with a p<0.100 in the hypothesis test. The multivariate model was designed taking into account those variables that were significant in the univariate analysis, including also those parameters that have been shown in previous work to have a poor prognosis in COVID-19 patients and whose p-value in the univariate analysis was less than 0.100 (age, lactate dehydrogenase [LDH], body mass index [BMI] and previous history of diabetes). Once the clinical model was designed, its power was calculated by analysing the areas under the curve (AUC) and the corresponding ROC curves. Based on this clinical model, alternative models were designed, including the parameters of this study (lung ultrasound and/or chest X-ray) in case they were significant in the univariate analysis. Lastly, survival curves were analysed using Kaplan-Meier curves and the Log-Rank test.
Confidence intervals were 95%, with statistical significance established at a p-value of less than 0.05. Statistical analysis was conducted using the SPSS statistical package in its version 24.0 for Windows.
ResultsBaseline sample characteristics (Tables 1 and 2)Chest X-ray versus lung ultrasoundThe median Schalekamp score17 (X-ray) was 2 points (IR: 2) and the median LUZ score11 (lung ultrasound) was 21 points (IR: 10), with no significant degree of correlation between both techniques (Spearman’s Rho=0.146; p=0.086).
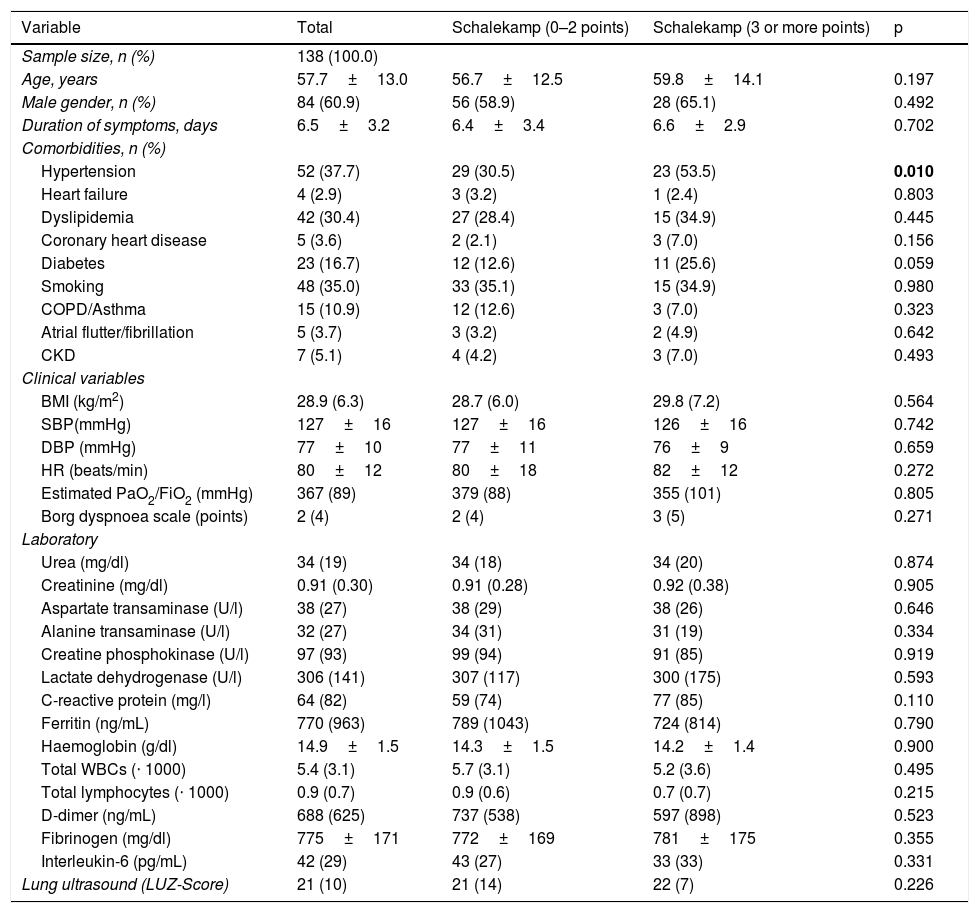
Baseline characteristics of the sample according to lung involvement quantified using the Schalekamp radiological scale (median) on admission.
| Variable | Total | Schalekamp (0–2 points) | Schalekamp (3 or more points) | p |
|---|---|---|---|---|
| Sample size, n (%) | 138 (100.0) | |||
| Age, years | 57.7±13.0 | 56.7±12.5 | 59.8±14.1 | 0.197 |
| Male gender, n (%) | 84 (60.9) | 56 (58.9) | 28 (65.1) | 0.492 |
| Duration of symptoms, days | 6.5±3.2 | 6.4±3.4 | 6.6±2.9 | 0.702 |
| Comorbidities, n (%) | ||||
| Hypertension | 52 (37.7) | 29 (30.5) | 23 (53.5) | 0.010 |
| Heart failure | 4 (2.9) | 3 (3.2) | 1 (2.4) | 0.803 |
| Dyslipidemia | 42 (30.4) | 27 (28.4) | 15 (34.9) | 0.445 |
| Coronary heart disease | 5 (3.6) | 2 (2.1) | 3 (7.0) | 0.156 |
| Diabetes | 23 (16.7) | 12 (12.6) | 11 (25.6) | 0.059 |
| Smoking | 48 (35.0) | 33 (35.1) | 15 (34.9) | 0.980 |
| COPD/Asthma | 15 (10.9) | 12 (12.6) | 3 (7.0) | 0.323 |
| Atrial flutter/fibrillation | 5 (3.7) | 3 (3.2) | 2 (4.9) | 0.642 |
| CKD | 7 (5.1) | 4 (4.2) | 3 (7.0) | 0.493 |
| Clinical variables | ||||
| BMI (kg/m2) | 28.9 (6.3) | 28.7 (6.0) | 29.8 (7.2) | 0.564 |
| SBP(mmHg) | 127±16 | 127±16 | 126±16 | 0.742 |
| DBP (mmHg) | 77±10 | 77±11 | 76±9 | 0.659 |
| HR (beats/min) | 80±12 | 80±18 | 82±12 | 0.272 |
| Estimated PaO2/FiO2 (mmHg) | 367 (89) | 379 (88) | 355 (101) | 0.805 |
| Borg dyspnoea scale (points) | 2 (4) | 2 (4) | 3 (5) | 0.271 |
| Laboratory | ||||
| Urea (mg/dl) | 34 (19) | 34 (18) | 34 (20) | 0.874 |
| Creatinine (mg/dl) | 0.91 (0.30) | 0.91 (0.28) | 0.92 (0.38) | 0.905 |
| Aspartate transaminase (U/l) | 38 (27) | 38 (29) | 38 (26) | 0.646 |
| Alanine transaminase (U/l) | 32 (27) | 34 (31) | 31 (19) | 0.334 |
| Creatine phosphokinase (U/l) | 97 (93) | 99 (94) | 91 (85) | 0.919 |
| Lactate dehydrogenase (U/l) | 306 (141) | 307 (117) | 300 (175) | 0.593 |
| C-reactive protein (mg/l) | 64 (82) | 59 (74) | 77 (85) | 0.110 |
| Ferritin (ng/mL) | 770 (963) | 789 (1043) | 724 (814) | 0.790 |
| Haemoglobin (g/dl) | 14.9±1.5 | 14.3±1.5 | 14.2±1.4 | 0.900 |
| Total WBCs (⋅ 1000) | 5.4 (3.1) | 5.7 (3.1) | 5.2 (3.6) | 0.495 |
| Total lymphocytes (⋅ 1000) | 0.9 (0.7) | 0.9 (0.6) | 0.7 (0.7) | 0.215 |
| D-dimer (ng/mL) | 688 (625) | 737 (538) | 597 (898) | 0.523 |
| Fibrinogen (mg/dl) | 775±171 | 772±169 | 781±175 | 0.355 |
| Interleukin-6 (pg/mL) | 42 (29) | 43 (27) | 33 (33) | 0.331 |
| Lung ultrasound (LUZ-Score) | 21 (10) | 21 (14) | 22 (7) | 0.226 |
COPD: chronic obstructive pulmonary disease; CKD: chronic kidney disease (estimated glomerular filtration rate <60mL/min/1.73m2 calculated by CKD-EPI creatinine equation); HR: heart rate; BMI: body mass index; LUZ-Score: Lung Ultrasound Zaragoza-Score; DBP: diastolic blood pressure; SBP: systolic blood pressure.
Variables are shown as mean±standard deviation or median (interquartile range).
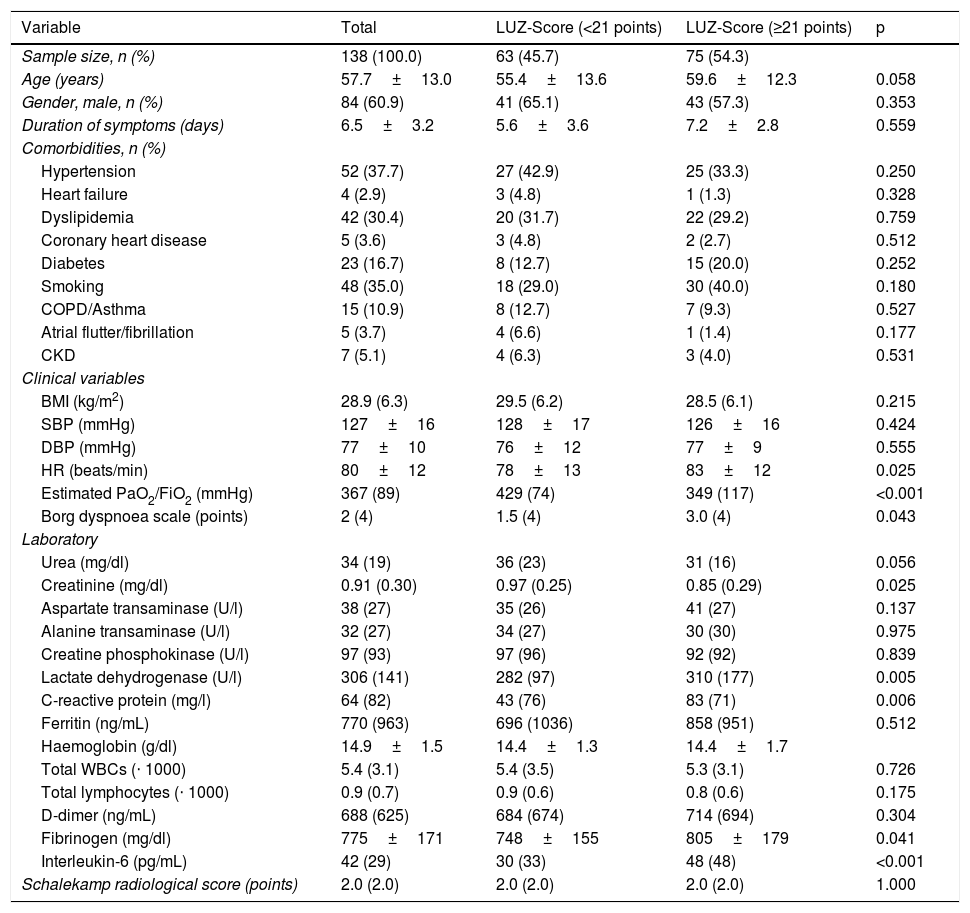
Baseline characteristics of the sample according to lung involvement quantified using the LUZ-Score ultrasound scale (median) on admission.
| Variable | Total | LUZ-Score (<21 points) | LUZ-Score (≥21 points) | p |
|---|---|---|---|---|
| Sample size, n (%) | 138 (100.0) | 63 (45.7) | 75 (54.3) | |
| Age (years) | 57.7±13.0 | 55.4±13.6 | 59.6±12.3 | 0.058 |
| Gender, male, n (%) | 84 (60.9) | 41 (65.1) | 43 (57.3) | 0.353 |
| Duration of symptoms (days) | 6.5±3.2 | 5.6±3.6 | 7.2±2.8 | 0.559 |
| Comorbidities, n (%) | ||||
| Hypertension | 52 (37.7) | 27 (42.9) | 25 (33.3) | 0.250 |
| Heart failure | 4 (2.9) | 3 (4.8) | 1 (1.3) | 0.328 |
| Dyslipidemia | 42 (30.4) | 20 (31.7) | 22 (29.2) | 0.759 |
| Coronary heart disease | 5 (3.6) | 3 (4.8) | 2 (2.7) | 0.512 |
| Diabetes | 23 (16.7) | 8 (12.7) | 15 (20.0) | 0.252 |
| Smoking | 48 (35.0) | 18 (29.0) | 30 (40.0) | 0.180 |
| COPD/Asthma | 15 (10.9) | 8 (12.7) | 7 (9.3) | 0.527 |
| Atrial flutter/fibrillation | 5 (3.7) | 4 (6.6) | 1 (1.4) | 0.177 |
| CKD | 7 (5.1) | 4 (6.3) | 3 (4.0) | 0.531 |
| Clinical variables | ||||
| BMI (kg/m2) | 28.9 (6.3) | 29.5 (6.2) | 28.5 (6.1) | 0.215 |
| SBP (mmHg) | 127±16 | 128±17 | 126±16 | 0.424 |
| DBP (mmHg) | 77±10 | 76±12 | 77±9 | 0.555 |
| HR (beats/min) | 80±12 | 78±13 | 83±12 | 0.025 |
| Estimated PaO2/FiO2 (mmHg) | 367 (89) | 429 (74) | 349 (117) | <0.001 |
| Borg dyspnoea scale (points) | 2 (4) | 1.5 (4) | 3.0 (4) | 0.043 |
| Laboratory | ||||
| Urea (mg/dl) | 34 (19) | 36 (23) | 31 (16) | 0.056 |
| Creatinine (mg/dl) | 0.91 (0.30) | 0.97 (0.25) | 0.85 (0.29) | 0.025 |
| Aspartate transaminase (U/l) | 38 (27) | 35 (26) | 41 (27) | 0.137 |
| Alanine transaminase (U/l) | 32 (27) | 34 (27) | 30 (30) | 0.975 |
| Creatine phosphokinase (U/l) | 97 (93) | 97 (96) | 92 (92) | 0.839 |
| Lactate dehydrogenase (U/l) | 306 (141) | 282 (97) | 310 (177) | 0.005 |
| C-reactive protein (mg/l) | 64 (82) | 43 (76) | 83 (71) | 0.006 |
| Ferritin (ng/mL) | 770 (963) | 696 (1036) | 858 (951) | 0.512 |
| Haemoglobin (g/dl) | 14.9±1.5 | 14.4±1.3 | 14.4±1.7 | |
| Total WBCs (⋅ 1000) | 5.4 (3.1) | 5.4 (3.5) | 5.3 (3.1) | 0.726 |
| Total lymphocytes (⋅ 1000) | 0.9 (0.7) | 0.9 (0.6) | 0.8 (0.6) | 0.175 |
| D-dimer (ng/mL) | 688 (625) | 684 (674) | 714 (694) | 0.304 |
| Fibrinogen (mg/dl) | 775±171 | 748±155 | 805±179 | 0.041 |
| Interleukin-6 (pg/mL) | 42 (29) | 30 (33) | 48 (48) | <0.001 |
| Schalekamp radiological score (points) | 2.0 (2.0) | 2.0 (2.0) | 2.0 (2.0) | 1.000 |
COPD: chronic obstructive pulmonary disease; CKD: chronic kidney disease (estimated glomerular filtration rate <60mL/min/1.73m2 calculated by CKD-EPI creatinine equation); HR: heart rate; BMI: body mass index; LUZ-Score: Lung Ultrasound Zaragoza-Score; DBP: diastolic blood pressure; SBP: systolic blood pressure.
Variables are shown as mean±standard deviation or median (interquartile range).
The baseline characteristics of the sample according to the radiological score (median) can be assessed in Table 1. With the exception of the prevalence of hypertension (53.5% vs. 30.5%; p=0.010), no differences were found in the baseline characteristics of the sample of those patients with the highest Schalekamp score17 (3 or more points) (Table 1).
The baseline characteristics of the sample according to the ultrasound score are shown in Table 2. Patients with higher LUZ-Score11 (≥21 points) had a higher heart rate on admission, a lower estimated PaO2/FiO2, as well as a greater subjective feeling of dyspnoea (Borg scale). Laboratory tests showed a significant elevation of inflammatory markers, such as CRP and interleukin-6 (IL-6). Creatinine and LDH concentrations were also higher in those patients with greater lung involvement determined by ultrasound (≥21 points) (Table 2).
Endpoint analysis and clinical prediction modelsA total of 15 patients (10.9%) reached the primary endpoint of in-hospital death and/or need of ICU admission for mechanical ventilation. A total of 45 patients (34.1%) needed to increase oxygen flow during the first 72h, 53 patients (39.6%) saw their drug therapy increased during the first 72h and 64 patients (49.2%) required either an increase in oxygen flow or an increase in drug therapy (Appendix B Supplementary Table 1).
When comparing the Schalekamp and LUZ-Score scales, statistically significant differences were only found for primary and secondary endpoints when using lung ultrasound (Appendix B Supplementary Table 1). The analysis of the survival curves did not show statistically significant differences neither for the chest X-ray (Log-Rank test=0.155) nor for pulmonary ultrasound (Log-Rank test=0.077) (Fig. 1A and B).
![Survival curves for the primary endpoint (in-hospital death and/or admission to the intensive care unit for mechanical ventilation) according to lung involvement determined by: A) Chest X-ray (greater or less than the median of the Schalekamp scale [2 points], and B) Lung ultrasound (higher or lower than the median of the LUZ-Score [21 points].](https://static.elsevier.es/multimedia/23870206/0000015900000011/v2_202301310812/S2387020622005265/v2_202301310812/en/main.assets/gr1.jpeg?xkr=ue/ImdikoIMrsJoerZ+w997EogCnBdOOD93cPFbanNeMnx59J5MZq19QkIYapO3C4/82hd8IkitUzHU8lFslQzIP52f6p2sau3Jv++tKu+fVXRzRPYZ9JBA6DrilcF2h10bwtDEmlziA6tsATudaCPbLt5g5J9eyvYzBxFXajzwfkDCvWOm2WTT9Ew1ilTtUaGVIaXVdxekRUcHCc0claYRzdBYDtOrn12qLvISPT2UzPo+ZenOjnWadYqMQjdozNdhH34NYceTC6Hpl7+yk89JWvzC3p3n39QxsaMNP3uo= "Survival curves for the primary endpoint (in-hospital death and/or admission to the intensive care unit for mechanical ventilation) according to lung involvement determined by: A) Chest X-ray (greater or less than the median of the Schalekamp scale [2 points], and B) Lung ultrasound (higher or lower than the median of the LUZ-Score [21 points].")
Survival curves for the primary endpoint (in-hospital death and/or admission to the intensive care unit for mechanical ventilation) according to lung involvement determined by: A) Chest X-ray (greater or less than the median of the Schalekamp scale [2 points], and B) Lung ultrasound (higher or lower than the median of the LUZ-Score [21 points].
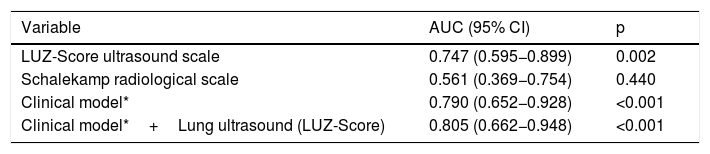
Only the clinical model (AUC: 0.790 [0.652−0.928]; p=<0.001) and lung ultrasound (AUC 0.747 [0.595−0.899]; p=0.002), showed statistically significant results (Fig. 2 and Table 3). When combining the baseline clinical model with pulmonary ultrasound on admission, an increase in predictive capacity was observed (AUC 0.805 [CI95%: 0.662−0.948]; p≤0.001). In contrast, the X-ray (Schalekamp et al.17) did not show statistically significant results (AUC: 0.561 [CI 95%: 0.369−0.754]; p=0.440) (Fig. 2 and Table 3).
 according to the different models analysed (clinical model, LUZ-Score ultrasound scale, and combination of both).")
Areas under the curve of the different models analysed for the primary endpoint of in-hospital death and/or admission to the intensive care unit.
| Variable | AUC (95% CI) | p |
|---|---|---|
| LUZ-Score ultrasound scale | 0.747 (0.595−0.899) | 0.002 |
| Schalekamp radiological scale | 0.561 (0.369−0.754) | 0.440 |
| Clinical model* | 0.790 (0.652−0.928) | <0.001 |
| Clinical model*+Lung ultrasound (LUZ-Score) | 0.805 (0.662−0.948) | <0.001 |
For more information, see Appendix B Supplementary Table 3).
In the present study we performed a comparative analysis between X-ray (Schalekamp et al.17) and lung ultrasound (LUZ-Score11) to identify COVID-19 patients with a worse outcome during their hospital stay. Our results show that the quantitative assessment of lung damage by lung ultrasound is superior to that by X-ray, without a good correlation between the two techniques. In fact, only the addition of lung ultrasound to a clinical prediction model improved its predictive capacity, demonstrating its potential usefulness in identifying patients with a worse prognosis on admission. These results are unprecedented, and no similar studies have been found comparing both techniques using quantitative scales in the medical literature.
Early selection and identification of patients with COVID-19 whose clinical characteristics make them high-risk patients is a key objective in order to improve prognosis during admission. Since the start of the pandemic, many prognostic tools have been developed, some based on purely clinical data19 or predictive models including laboratory20 or imaging test 11,16,17,21 parameters.
Schalekamp et al.17 researched whether quantification of lung damage, using a quantitative radiological scale, was able to identify COVID-19 patients with worse outcomes. Their results showed that this scale was an independent predictor of poor in-hospital prognosis17. However, this study included approximately 47% of critical patients and data such as oxygen saturation or BMI were not included, factors that could have overestimated the usefulness of this scale as a predictor of risk17.
Compared to X-ray, lung ultrasound has been a breakthrough in COVID-19 patients11,16,21,22. Its accuracy has been compared to lung CT in a small series of cases15,22,23, and its intrinsic characteristics (reproducibility, absence of irradiation, etc.) make it an attractive technique9.
In our analysis, population stratification using a quantitative ultrasound scale (LUZ-Score≥21 points) identified a subgroup of patients with worse lung function (estimated PaO2/FiO2 and LDH) and higher concentrations of acute phase reactants (CRP, fibrinogen and IL-6), suggesting that the LUZ-Score can identify the most severely affected patients. In contrast, the Schalekamp17 scale did not find differences among the population, and there was no significant correlation with the ultrasound scale either, which could be due to several causes. Our sample had an average BMI of 28.9kg/m2, so the high degree of overweight could have hindered radiological interpretation, especially if we take into account that, given that this is a highly transmissible disease, most X-rays were taken with portable equipment in an anteroposterior projection, reducing the test's diagnostic yield18,24,25. Furthermore, it is essential to point out the clinical-radiological dissociation that many COVID-19 patients have on admission due to the distinctive pathophysiological chronology of this disease, a situation that may cause the chest X-ray to underestimate the existing lung damage1,2,26–28. Our results suggest this, and indeed, the Schalekamp scale17 was not significant in the univariate logistic regression analysis. Lung ultrasound, however, showed a good area under the curve on its own, only slightly lower than that of the clinical model designed from our population, and the combination of both parameters (ultrasound and clinical model) allowed the generation of a clinical prediction model with an area under the curve of 0.805 (95%CI 0.662−0.948), although no significant differences were observed in the survival curves, probably due to the low number of events (10.9%).
As for the limitations of our study, we have to take into account that it is a retrospective analysis conducted on a cohort of patients from a single hospital centre, so our results have not been validated and cannot be applied to another population. In addition, it would have been useful to have chest CT images (gold standard) with which to compare the radiological and ultrasound images; however, not all patients with COVID-19 included in this analysis had this technique available, as the request was left to the physician responsible for the patient on the basis of clinical criteria. Finally, the sample size used may have reduced the final power of the study, which is a characteristic of this type of analysis.
In conclusion, we did not find a correlation between the Schalekamp scale and the LUZ-Score to quantify lung involvement on admission in patients with COVID-19. Patients with greater ultrasound involvement (higher LUZ-Score) had worse lung function as measured by clinical and/or laboratory parameters, a situation that was not observed in patients with greater radiological involvement (Schalekamp). The addition of a first lung ultrasound assessment on admission improved the predictive ability of a clinical model, so we suggest its use to identify higher-risk COVID-19 patients on admission.
Ethical considerationsThe study complied with the general guidelines of the Declaration of Helsinki and was approved by the corresponding ethics committee on 13 May 2020 (CEICA, Ref. CP-CI PI20/248).
FundingThe study was funded through a crowdfunding campaign promoted by the Instituto de Investigación Sanitario Aragón (IIS Aragón) during the years 2019–2020 (https://www.iisaragon.es/utilidad-de-la-ecografia-clinica-y-el-uso-de-biomarcadores-sericos-en-la-estratificacion-del-riesgo-de-pacientes-con-infeccion-por-sars-cov2-covid-19/)
Conflict of interestsThe authors declare that they have no conflict of interest in the conduct of this article.
The following are Supplementary data to this article:
