


The primary aim of this study was to quantify the impact of industry and infrastructure innovations on sustainable production and consumption within the circular economy (CE) in European Union (EU) countries. From the perspective of the Sustainable Development Goals (SDGs), the relationships between indicators representing SDG 9 and SDG 12 were examined. To achieve this, data from Eurostat for the period 2010–2021 were analyzed using regression and cluster analysis. The analyses revealed significant differences among EU countries in the areas investigated. The Netherlands and Belgium were among the highest-rated countries in terms of the examined relationships. Denmark excelled in industrial and infrastructure innovations, while Romania ranked among the lowest. A year-on-year decrease since 2010 was observed for several indicators, including the circular material use rate and the public transport ratio. Developed countries such as Finland and Luxembourg experienced a recent decrease in circular material use rate. A significant relationship was identified between the circular material use rate and industry and infrastructure innovations. Countries such as Romania, Portugal, Croatia, and Cyprus were in the worst positions. The results of the study are beneficial for policymakers focused on transitioning economies to CE, as well as for experts in business environments, educational policies, and regional development. These results support the development of benchmarking indicators at national and international levels, facilitating the creation of composite models for multidimensional analysis implementation. The findings are relevant for political strategists at both regional and international levels and may provide valuable insights for analytical and research teams designing predictive models.
The transformation of enterprises to the circular economy (CE) necessitates systemic innovation processes that encompass not only intensive innovations but also dynamic and holistic combinations of service innovations and new organizational structures (De Jesus et al., 2018). CE demands the implementation of sustainable business models (SBMs) that consider a broad range of stakeholder interests, including those of society and the environment (Bocken et al., 2014). Many innovative approaches implemented in enterprises through business models have not been concentrated as innovative business models, particularly if they involve mechanisms and solutions ensuring innovation and sustainability. Thus, research teams highlight the need to develop business models with a common language to expedite and facilitate the development of SBMs in both research and practice. Sustainable development and effective transformation to CE require new technological approaches in production and consumption models, as several studies indicate (Androniceanu et al., 2021; Ahmed et al., 2022). At present, minimizing material use in the design phase and seeking optimal production variants are crucial, as is achieving the highest possible value from materials through effective recycling. Di Maio and Rem (2015) note that some indicators do not motivate a higher rate of innovation implementation, criticizing, for example, the recycling rate indicator for its inaccuracy and negative impact on decision-making processes, leading to weak industry innovations. Innovating SBMs is complex, requiring knowledge of ecosystem drivers and trends, understanding stakeholder value in enterprises, and evaluating the impact of sustainability and circularity (Antikainen and Valkokari, 2016). Therefore, a systematic investigation of the links between Industry 4.0 and CE technologies is needed to quantify obstacles and potentials in achieving the Sustainable Development Goals (SDGs) (Patyal et al., 2022). In this regard, both micro-level and macro-level connections are essential for explicitly identifying penetrations into individual SDGs. The broad definition of SDGs has been criticized for contributing to insufficient achievement of SDG goals from the perspective of countries (Rodriguez-Anton et al., 2019).
These consistent facts motivated our study, which aimed to investigate and evaluate the relationships between the indicators of SDG 12—responsible consumption and production, and SDG 9—building resilient infrastructure, promoting inclusive and sustainable industrialization, and fostering innovation. Exploring the relations between SDG 12 and SDG 9 is based on global pressures to increase resource efficiency and efforts to improve sustainability, creating space for innovation process development and increased industry competitiveness. Therefore, changing the current production and consumption of goods is necessary, placing greater emphasis on creating higher added value with fewer inputs, reducing costs, and minimizing environmental impact.
Literature reviewTechnological processes and innovations are critical in transforming traditional economies into CE. Sectoral differentiation at national levels, the structure of the economic system, and the effects of international trade significantly influence innovation processes, thus impacting the transition to CE and its progress.
In the recent period, Industry 4.0 and CE have experienced rapid growth, and research studies, such as those by Machado et al. (2020), indicate a strong relationship between CE and Industry 4.0. This growth is further supported by the increasing impact of artificial intelligence (AI) and active policies (Ramadoss et al., 2018; Bag and Pretorius, 2022). Lei et al. (2023) emphasize the importance of investigating the relationships between Industry 4.0 technologies and CE processes, not only from the perspective of CE implementation but also in using Industry 4.0 to achieve the SDGs. These authors also highlight the insufficiently researched impacts of Industry 4.0 technologies on CE practices. The transition to a CE, where resources flow in cyclical systems, is complex and requires the reconfiguration of supply chains and multi-level collaboration (Kő et al., 2022; Meath et al., 2022). In the recent period, many research studies have aimed to facilitate this transition, focusing on identifying CE driving forces, prerequisites for CE development, and barriers, including procedural and financial obstacles, both in enterprises (microeconomic sphere) and economies (macroeconomic sphere). However, there is a lack of research addressing support models for overcoming obstacles in implementing CE processes. Meath et al. (2022) and Trevisan et al. (2023) note that successful CE implementation requires a multi-level transition platform at the industrial level, including collaborative initiatives at the meso level to interconnect micro and macro levels. According to Bag and Pretorius (2022), the success of CE implementation results from a symbiosis between institutional pressures, resources, and human skills for adopting Industry 4.0 technology. Industry 4.0 can positively impact sustainable production and CE. In addition, social determinants related to these aspects have been extensively studied, primarily focusing on the negative impacts of traditional production on the environment and population (Vrabcova et al., 2022).
Progress measurement in CE utilizationNumerous studies evaluated CE progress using indicators such as recycling rate, municipal waste recycling rate, research and development (R&D) spending across sectors, trade-in recyclable raw materials, environmental tax revenue, and resource productivity (Tantau et al., 2018). Pantcheva (2023) identifies key indicators for measuring CE progress: GDP per capita, R&D expenditure, resource productivity, and environmental tax revenue, which are crucial for quantifying circularity levels. Their analysis of the 27 European Union (EU) countries indicates that past R&D spending is significant for predicting circularity levels. The implementation of CE within the EU necessitates intelligent regulation and systematic collaboration across all levels–from global to national (including states, regions, cities, enterprises, and populations). Constructing collaboration networks and implementing appropriate models for collaboration and exchange will be essential (Sabău-Popa et al., 2022).
The progress of CE implementation varies among countries and is influenced by multiple factors. López-Portillo et al. (2021) also found differing patterns of waste treatment behavior based on country clustering, GDP per capita, R&D expenditure, resource productivity, and length of EU membership. Bassi and Dias (2019) highlighted differences in CE usage rates resulting from diverse measures implemented in EU countries. They also noted enterprise size, measured by the number of employees and total turnover, as a significant factor differentiating levels of CE usage.
CE development process aspectsSmall and medium-sized enterprises require improved measures for the implementation of CE processes, encompassing better planning and execution. The rate of innovative development also significantly influences the level of circularity in individual countries. Innovation processes accelerated globally from 2000 to 2019 (Metzger et al., 2023). It is also crucial to examine innovative development and its impact on CE progress within the context of sectoral differentiation. This is supported by the study of Brandao et al. (2021), which investigated circular bioeconomy strategies bolstered by an increase in related patents. The authors criticize the underutilization of the potential of circular bioeconomy strategies, impacting the limited sharing of this knowledge and, subsequently, environmental sustainability. The perception of the role of patents in CE development can vary. While patents represent the results of innovation processes and knowledge sharing, Zwart (2021) argues that patents do not currently enhance CE from a global perspective. However, there is evidence that patents can contribute to CE development under certain circumstances. Magrí et al. (2017) used patents to assess technological development progress and evaluate integrated solutions and CE progress in countries. Patents and scientific publications are employed as significant indicators of scientific research outcomes and for comparative analyses of their results between countries. De Blas et al. (2020) explored the relationship between CE and transport, examining four global strategies for the decarbonization of transport by 2050. Their study showed that the massive replacement of individual diesel-powered vehicles with electric ones would not sufficiently reduce greenhouse gas emissions to align with climate stabilization goals. Alaerts et al. (2020) criticized the current state of mobility for not being circular but rather continuing in a linear direction. The transition to public transport and bicycles has not seen significant development, and even new cars entering the market are not lighter, despite continuous improvements in environmental characteristics. Paradowska (2017) emphasizes the importance of using micro-indicators for evaluating CE progress in transport to quantify various forms of progress. It is also recommended to employ indicators that assess materials in low-emission vehicles. The development of CE in road transport will necessitate numerous measures across different levels and fields. The complexity of the road transport sector and the interconnections between various actors and stakeholders throughout the vehicle lifecycle present substantial obstacles in CE development processes and innovation challenges. Public transport and shared mobility services are among the optimal solutions for creating smart mobility plans. Policymakers should reevaluate the transport and mobility sectors, considering structural changes in transport systems and the development and economic restructuring involved in comprehensive decision-making processes (Pamučar et al., 2023).
Awan et al. (2019) explore the issue of CE in relation to pollution, which they regard as a global health problem. They recommend identifying optimal procedures for implementation in CE to achieve a zero pollution rate. These authors also advocate for introducing multi-level management and a systematic approach to enhance pollution prevention planning. Sauvé et al. (2016) and Kajikawa et al. (2014) suggest a transdisciplinary approach to address this issue. Sectoral aspects are crucial, requiring examination not only of sector-specific internal factors but also sectoral resource requirements and environmental impacts (Pinchuk et al., 2019). Xiong and Xu (2021) propose that the production processes’ negative effects on the environment can be effectively mitigated by implementing new-generation production techniques, such as the use of AI. Integrating AI can solve not only output problems but also enhance the efficiency and accuracy of production processes.
CE development determinantsNumerous studies indicated that the age structure of the particular country is a significant predictor of its transition to a CE (Neves & Marques, 2022; Ali et al., 2022; Hao et al., 2020). Older individuals often find it more challenging to change their behavior compared to younger people, leading to calls for the development of policies targeting older populations to foster understanding and support for the CE transition. These aspects are related to the economic, social, and environmental dimensions of the CE transition. In addition, findings suggest that income inequality complicates the CE transition, with people in the middle-income group more likely to engage in green behavior (De Jesus et al., 2018). Studies also highlight the current insufficiency of employee knowledge and experience in maintaining resilient businesses. Whicher et al. (2018) identified a skills gap in CE design, necessitating various retraining mechanisms. Burger et al. (2019) discuss the opportunities and risks associated with employment, learning processes, and skills related to CE. Research results underscore the strong heterogeneity of job requirements in Central Europe and the need for specific education and training programs for future CE development. Dumitrescu (2020) found a correlation between tertiary education levels and municipal waste recycling rates, suggesting that higher education is vital in the CE transition process. In some countries, efforts to transform economies to CE are slow, affecting the culture of learning and reflective practice (Dieleman and Martínez-Rodríguez, 2019). Conversely, many economies recognize the importance of the education system and support the construction of education models compatible with CE process requirements (Bugallo- Burns, 2018; Coleman and Gould, 2019; Bugallo-Rodríguez & Vega-Marcote, 2020). Serrano-Bedia and Perez-Perez (2022) assert that higher education institutions play a significant role in CE transformation processes, offering consulting services to involved parties, collaborating with industry, consumers, governments, and promoting ecologically responsible citizenship. However, there is still a lack of research addressing the critical role of universities in CE transition processes (Salas et al., 2021; Giannoccaro et al., 2021). According to Qu et al. (2021), creating dynamic university governance models that facilitate the transition of economies to CE and support the effective transition of countries’ economies to circularity is essential.
CE offers new business opportunities for innovative enterprises, yet some studies highlight deficiencies in indicators for evaluating CE processes across various fields. Di Maio et al. (2017) note that the value of materials recovered from waste constitutes a small fraction of European GDP, indicating a lack of key performance indicators to stimulate the recycling industry. To address this, Moraga et al. (2019) propose a classification framework for categorizing indicators according to CE strategies and measurement ranges, which could support the construction of an evaluation system for indicators within CE. Other methods and indicators for estimating CE potentials in open economies are also being verified (Geerken et al., 2019). Their economic benefits will be evident in comparative analyses of countries and in using their results to create active policies. Rincón-Moreno, Ormazábal, Álvarez, and Jaca (2021) criticize the absence of standard indicators for evaluating CE progress, which leads to misunderstandings and obstacles in CE implementation. They suggest that indicators currently used to evaluate CE progress at the macroeconomic level could also be applied at the microeconomic level. Standardizing these indicators could offer comparative potential and eliminate issues arising from the introduction of specific metrics within individual countries. Therefore, the development of indicator systems can significantly support the CE transition and the systematic generation of its effects. CE progress also significantly impacts sector digitalization, including within high-speed internet connectivity. Hernández-Chover et al. (2022) explored the digitalization potential of the urban water sector, identifying several practical instances to accelerate the transition of this infrastructure toward economic, social, and environmental sustainability. Intensive digitalization processes and the Internet of Things are also observed in other sectors, contributing not only to CE progress but also to achieving the SDGs (Makarova et al., 2020). Measuring CE development progress through high-speed internet use in sectors and enterprises is feasible through various metrics, effectively capturing changes in supplier-customer relations, marketing, business, and financial strategies.
The findings from these studies evidently demonstrate the interconnectedness between the production and consumption of circular materials and certain aspects of industry and infrastructure innovations. Although these investigations focus on specific dimensions within the innovation processes in industry and infrastructure, their outcomes distinctly reveal the substantial potential of innovative and technological development in altering the production and consumption of circular materials. Simultaneously, they pinpoint the weaknesses in these processes that adversely affect policy formulation, among other aspects. In various sectors and fields, the intensity of innovative and technological development varies. In some areas, it is more pronounced, while in others, numerous factors, such as resource or process constraints, hinder innovation. There are significant differences not only within countries across different sectors but also between countries. These established facts have shaped the primary objective of our study, which is to quantify the impact of innovations in the field of industry and infrastructure on sustainable production and consumption within the CE in EU countries. The results of this study will be highly beneficial for policymakers, regional development plans, and experts in the business and financial sectors.
Material and methodsFor the sustainable development of economies, a systematic investigation of the main sustainability dimensions and the factors influencing them is essential. Examining CE models is crucial for achieving SDG-12, which focuses on responsible consumption and production. The integration of digital technologies is fundamental to the development of sustainable models in production and consumption, and innovation processes are integral to this. These processes result from the convergence of digital technologies with various sectors, including medicine, biotechnology, agriculture, energy, education, mobility, logistics, and manufacturing. These aspects significantly influenced the formulation of the main aim of the study and the selection of variables.
Our study investigated the use of CE through the indicator circular material use rate, which is linked to the strategy of preserving materials through recycling and downcycling and aligning with the aim of technological cycles incorporating life cycle thinking (Moraga et al., 2019). The sustainability field was focused on innovation in industry and infrastructure. The analytical processes were concentrated in two areas. The first area focused on evaluating the position of EU countries in the interconnection of circular materials consumption and innovation indicators in industry and infrastructure. The second area examined the relationships between industrial and infrastructure innovations and the consumption of circular materials in EU countries. Research in this field is guided by the following research questions:
RQ1: Is there a significant relation between the circular material use rate and gross domestic expenditure on research and development (R&D) in EU countries?
RQ2: Is there a significant relation between the circular material use rate and the employment rate in the R&D sector in EU countries?
RQ3: Is there a significant relation between the circular material use rate and the number of patent submissions in EU countries?
RQ4: Is there a significant relation between the circular material use rate and the proportion of public transport in total transportation in EU countries?
RQ5: Is there a significant relation between the circular material use rate and air pollution in EU countries?
RQ6: Is there a significant relation between the circular material use rate and the tertiary education levels of women and men in EU countries?
RQ7: Is there a significant relation between the circular material use rate and the gross value added by the environmental goods sector in environmental and resource management in EU countries?
RQ8: Is there a significant relation between the circular material use rate and high-speed internet connectivity in EU countries?
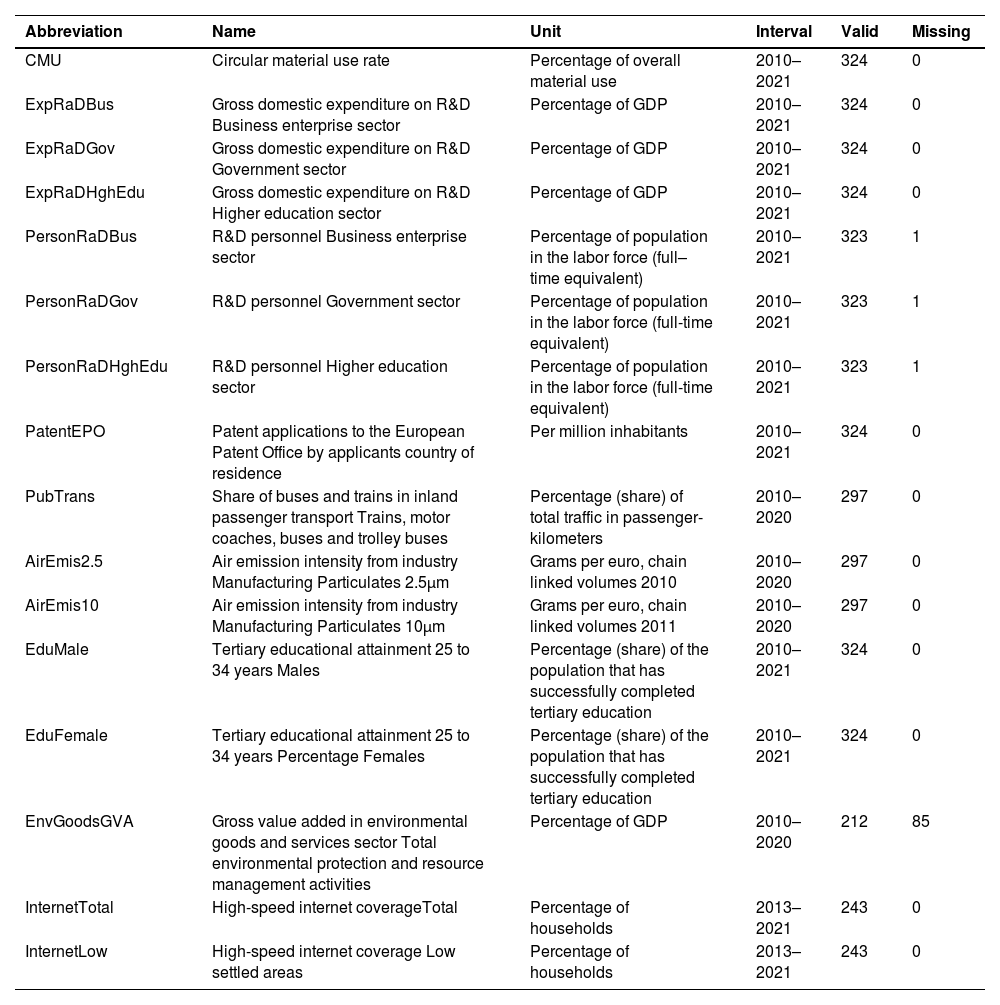
Table 1 provides descriptions of the variables used in the analytical processes. This study is characterized by its reliance on secondary data sourced from Eurostat databases. Detailed references for each dataset are provided in the notes below in Table 1. For clarity and convenience, initial focus should be placed on the first column (Abbreviations), as these abbreviations are consistently used in subsequent sections. The selection of variables aligns with the research objectives previously outlined.
Variables description.
Source: CMU: Circular material use rate (Eurostat, 2023a); ExpRaDBus, ExpRaDGov, ExpRaDHghEdu: Gross domestic expenditure on R&D by sector (Eurostat, 2023b); PersonRaDBus, PersonRaDGov, PersonRaDHghEdu: R&D personnel by sector (Eurostat, 2023c); PatentEPO, PubTrans: Patent applications to the European Patent Office by applicants’/inventors’ country of residence (source: EPO) (Eurostat, 2023d); PubTrans: Share of buses and trains in inland passenger transport (Eurostat, 2023e); AirEmis2.5, AirEmis10: Air emission intensity from industry (Eurostat, 2023f), EduMale, EduFemale: Tertiary educational attainment by sex (Eurostat, 2023g); EnvGoodsGVA: Gross value added in environmental goods and services sector (Eurostat, 2023h); InternetTotal, InternetLow: High-speed internet coverage, by type of area (source: DG CNECT and Eurostat) (Eurostat, 2023i).
The analytical processes encompassed data from all EU countries, including Austria (AUT), Belgium (BEL), Bulgaria (BGR), Croatia (HRV), Cyprus (CYP), Czechia (CZE), Denmark (DNK), Estonia (EST), Finland (FIN), France (FRA), Germany (DEU), Greece (GRC), Hungary (HUN), Ireland (IRL), Italy (ITA), Latvia (LVA), Lithuania (LTU), Luxembourg (LUX), Malta (MLT), the Netherlands (NLD), Poland (POL), Portugal (POR), Romania (ROU), Slovakia (SVK), Slovenia (SVN), Spain (ESP), and Sweden (SWE). The indicators were available for various time intervals, as shown in Table 1 (Interval column). The earliest data in this study, primarily influenced by the 2008 financial crisis, were collected in 2010. The most recent data were obtained in 2021, representing the latest information available from the Eurostat database at the time of data compilation. As indicated in Table 1, the EnvGoodsGVA indicator had the highest number of missing values (missing = 85).
Several procedures were employed in the analytical processes. Initially, year-on-year changes were calculated, with growth or decline expressed in percentages. Part of the analysis involved working with the data and their year-to-year changes. In descriptive analysis, fundamental indicators such as arithmetic mean, standard deviation, coefficient of variation, minimum, and maximum were used, enabling an overall evaluation of the situation in the EU. Partitioning Around Medoids cluster analysis and the Manhattan distance metric were applied, with the appropriate number of clusters estimated using the silhouette method (Kassambara, 2017). Inputs for cluster analysis were the average values of specific characteristics in individual countries, calculated over the observed period and subsequently standardized from 0 to 1, with higher values indicating more positive outcomes.
In the initial stage of the second part, focused on evaluating the relationship between circular material use (CMU) and innovations in industry and infrastructure, Spearman's correlation coefficient was utilized for correlation analysis. This was complemented by panel regression analysis, directly linked to assessing research questions 1 to 8. Prior to its application, several tests — the F test, Hausman test, and Breusch-Pagan test — were conducted. Subsequently, both fixed (Arellano estimator) and random (White estimator) effect models were implemented (Wooldridge, 2010). The F test evaluated the significance of the factor structure across countries and individual years. Since significance was confirmed only for country structures, individual effect models were employed to assess the significance of the relationships. The Hausman test aided in selecting between fixed (within) or random effect models. A p-value below 0.05 indicated a preference for the within model, which occurred in one instance. The Breusch-Pagan test was used to assess residual variability (homoscedasticity). In several instances, significant heteroscedasticity was detected, necessitating the use of robust estimators for coefficient estimation in all models.
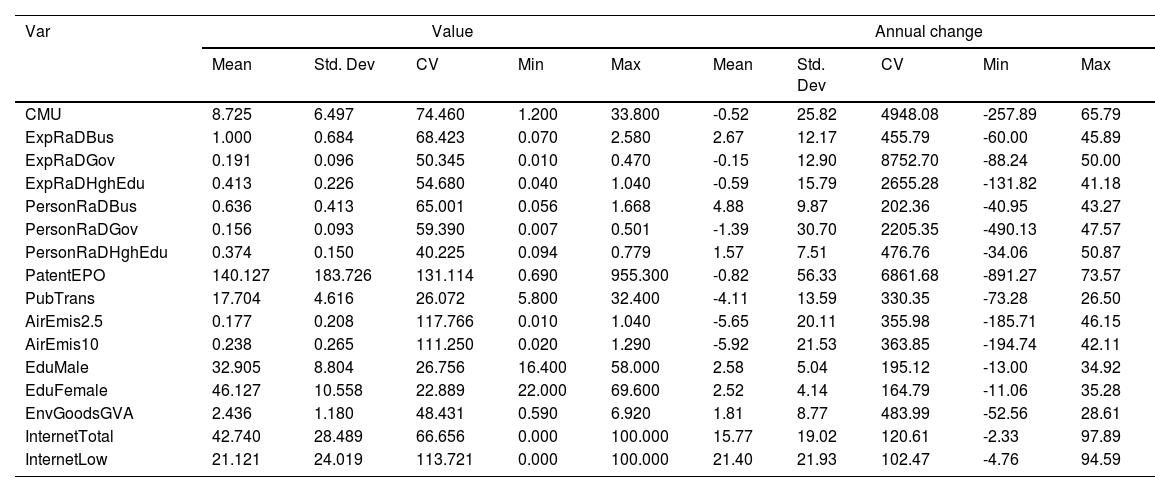
ResultsThe initial part of the results section highlights the status of various countries concerning the consumption of circular materials and innovations. The subsequent part offers a thorough examination of the association between these domains, with a particular focus on the status of EU countries. Table 2 presents the primary outcomes of the descriptive statistical analysis, along with the annual changes in the values of individual indicators.
Descriptive analysis.
Table 2 presents key findings from the descriptive analysis, offering insights into both the absolute values of indicators and their year-on-year changes. Significant results are presented alongside these changes. A value greater than 0 indicates an increase over the observed period, while a value less than 0 signifies a decrease. The conclusion of the examined period is notably influenced by the coronavirus disease 2019 pandemic, which occurred in 2020 and 2021.
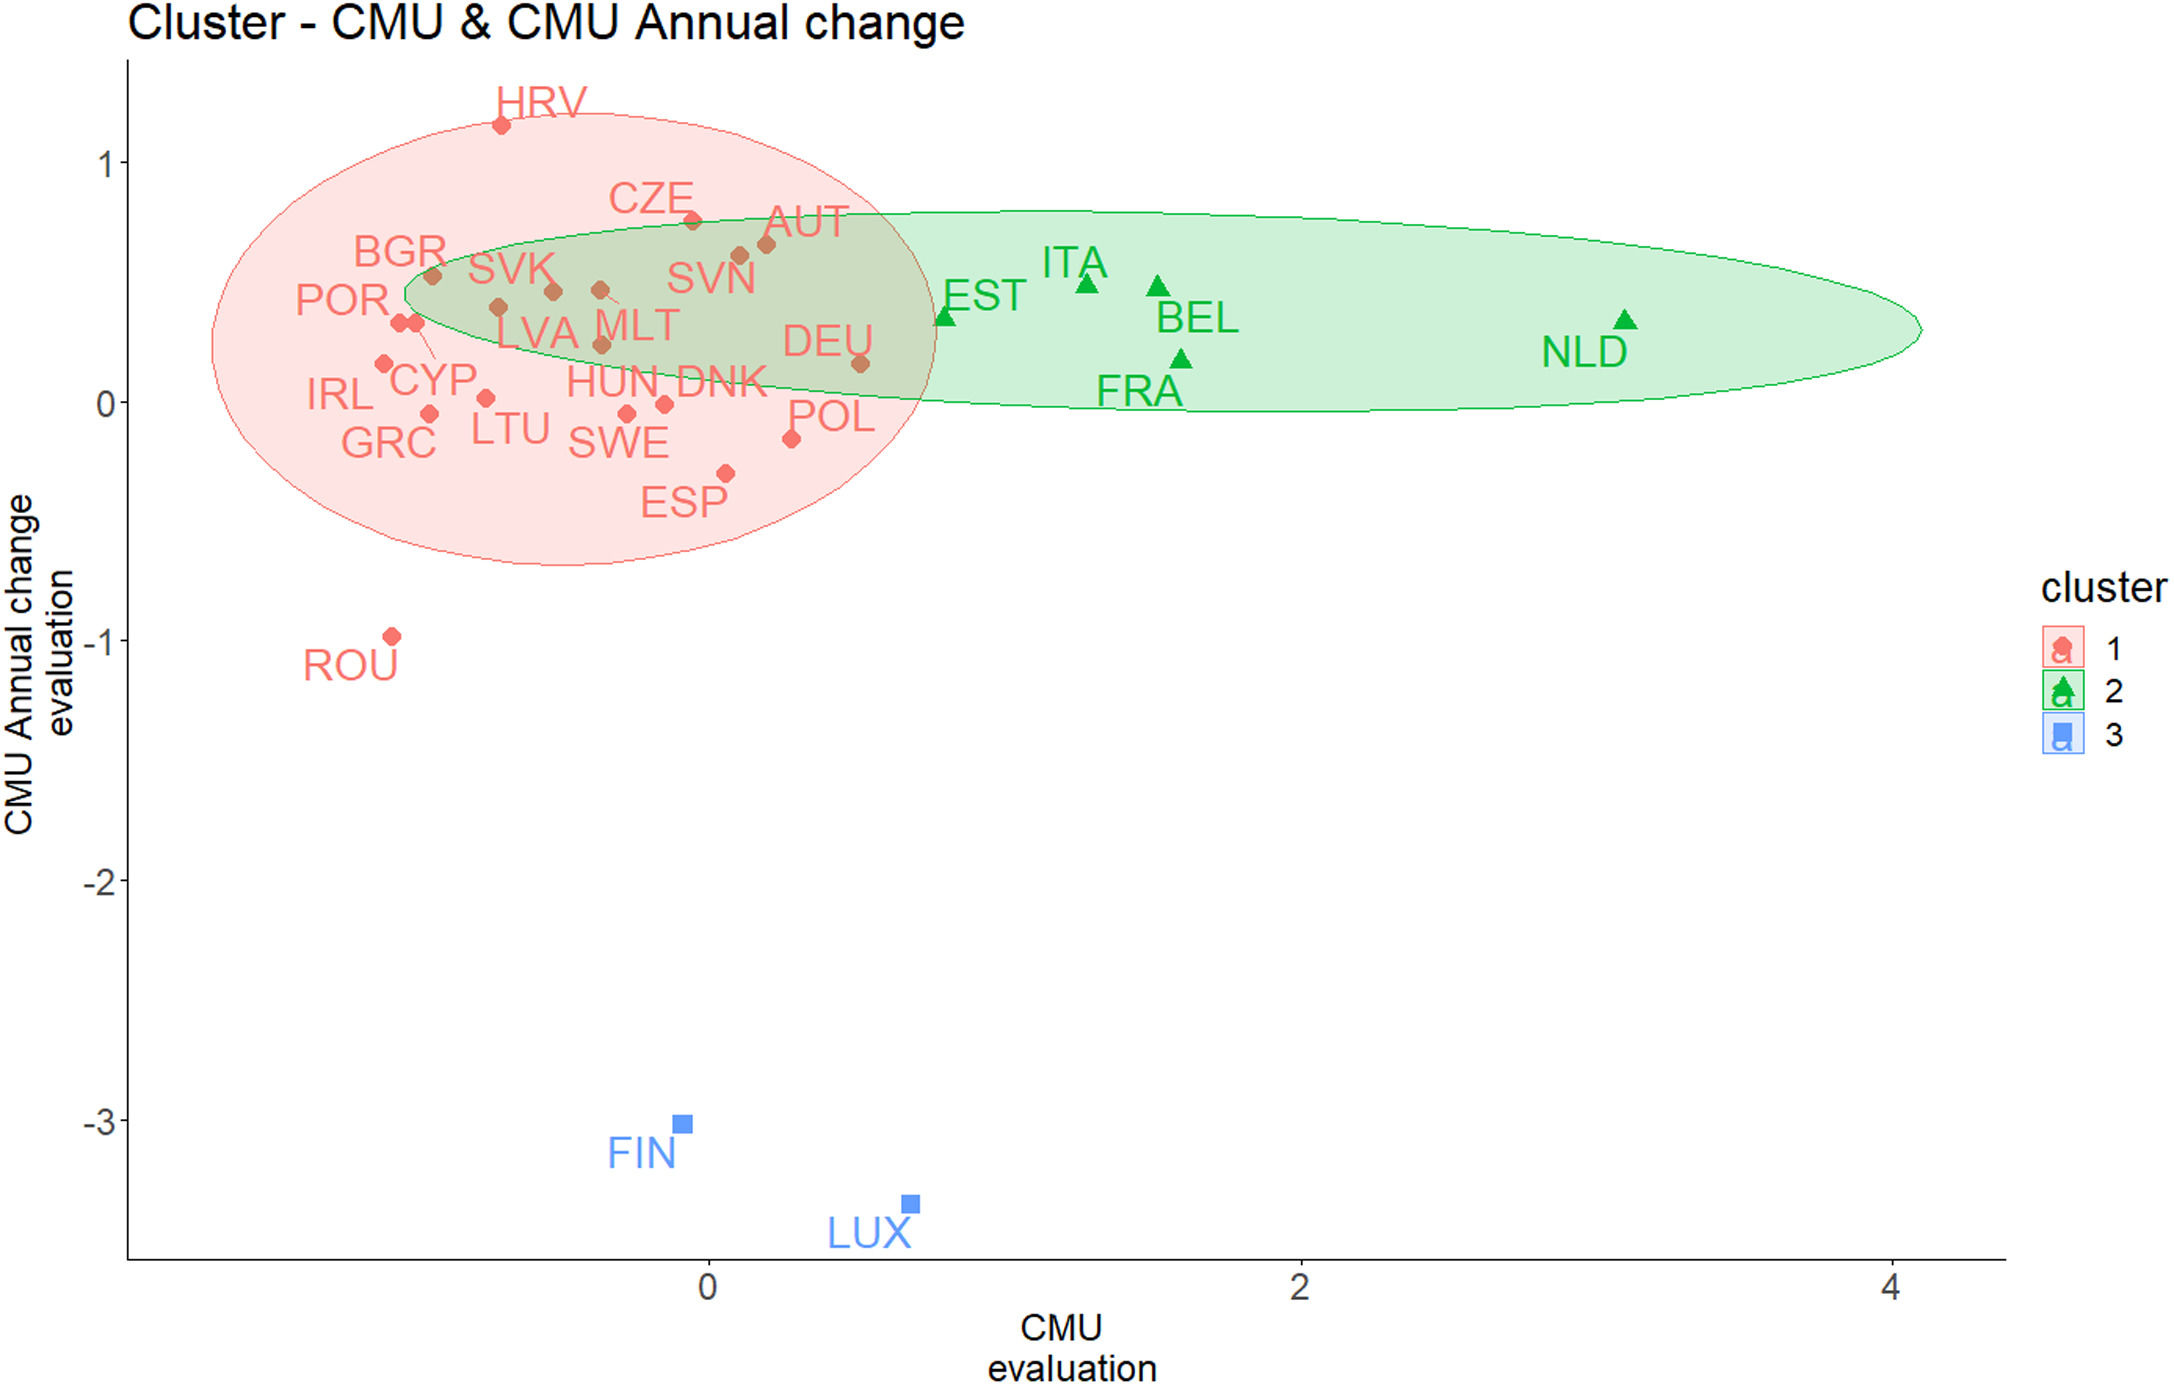
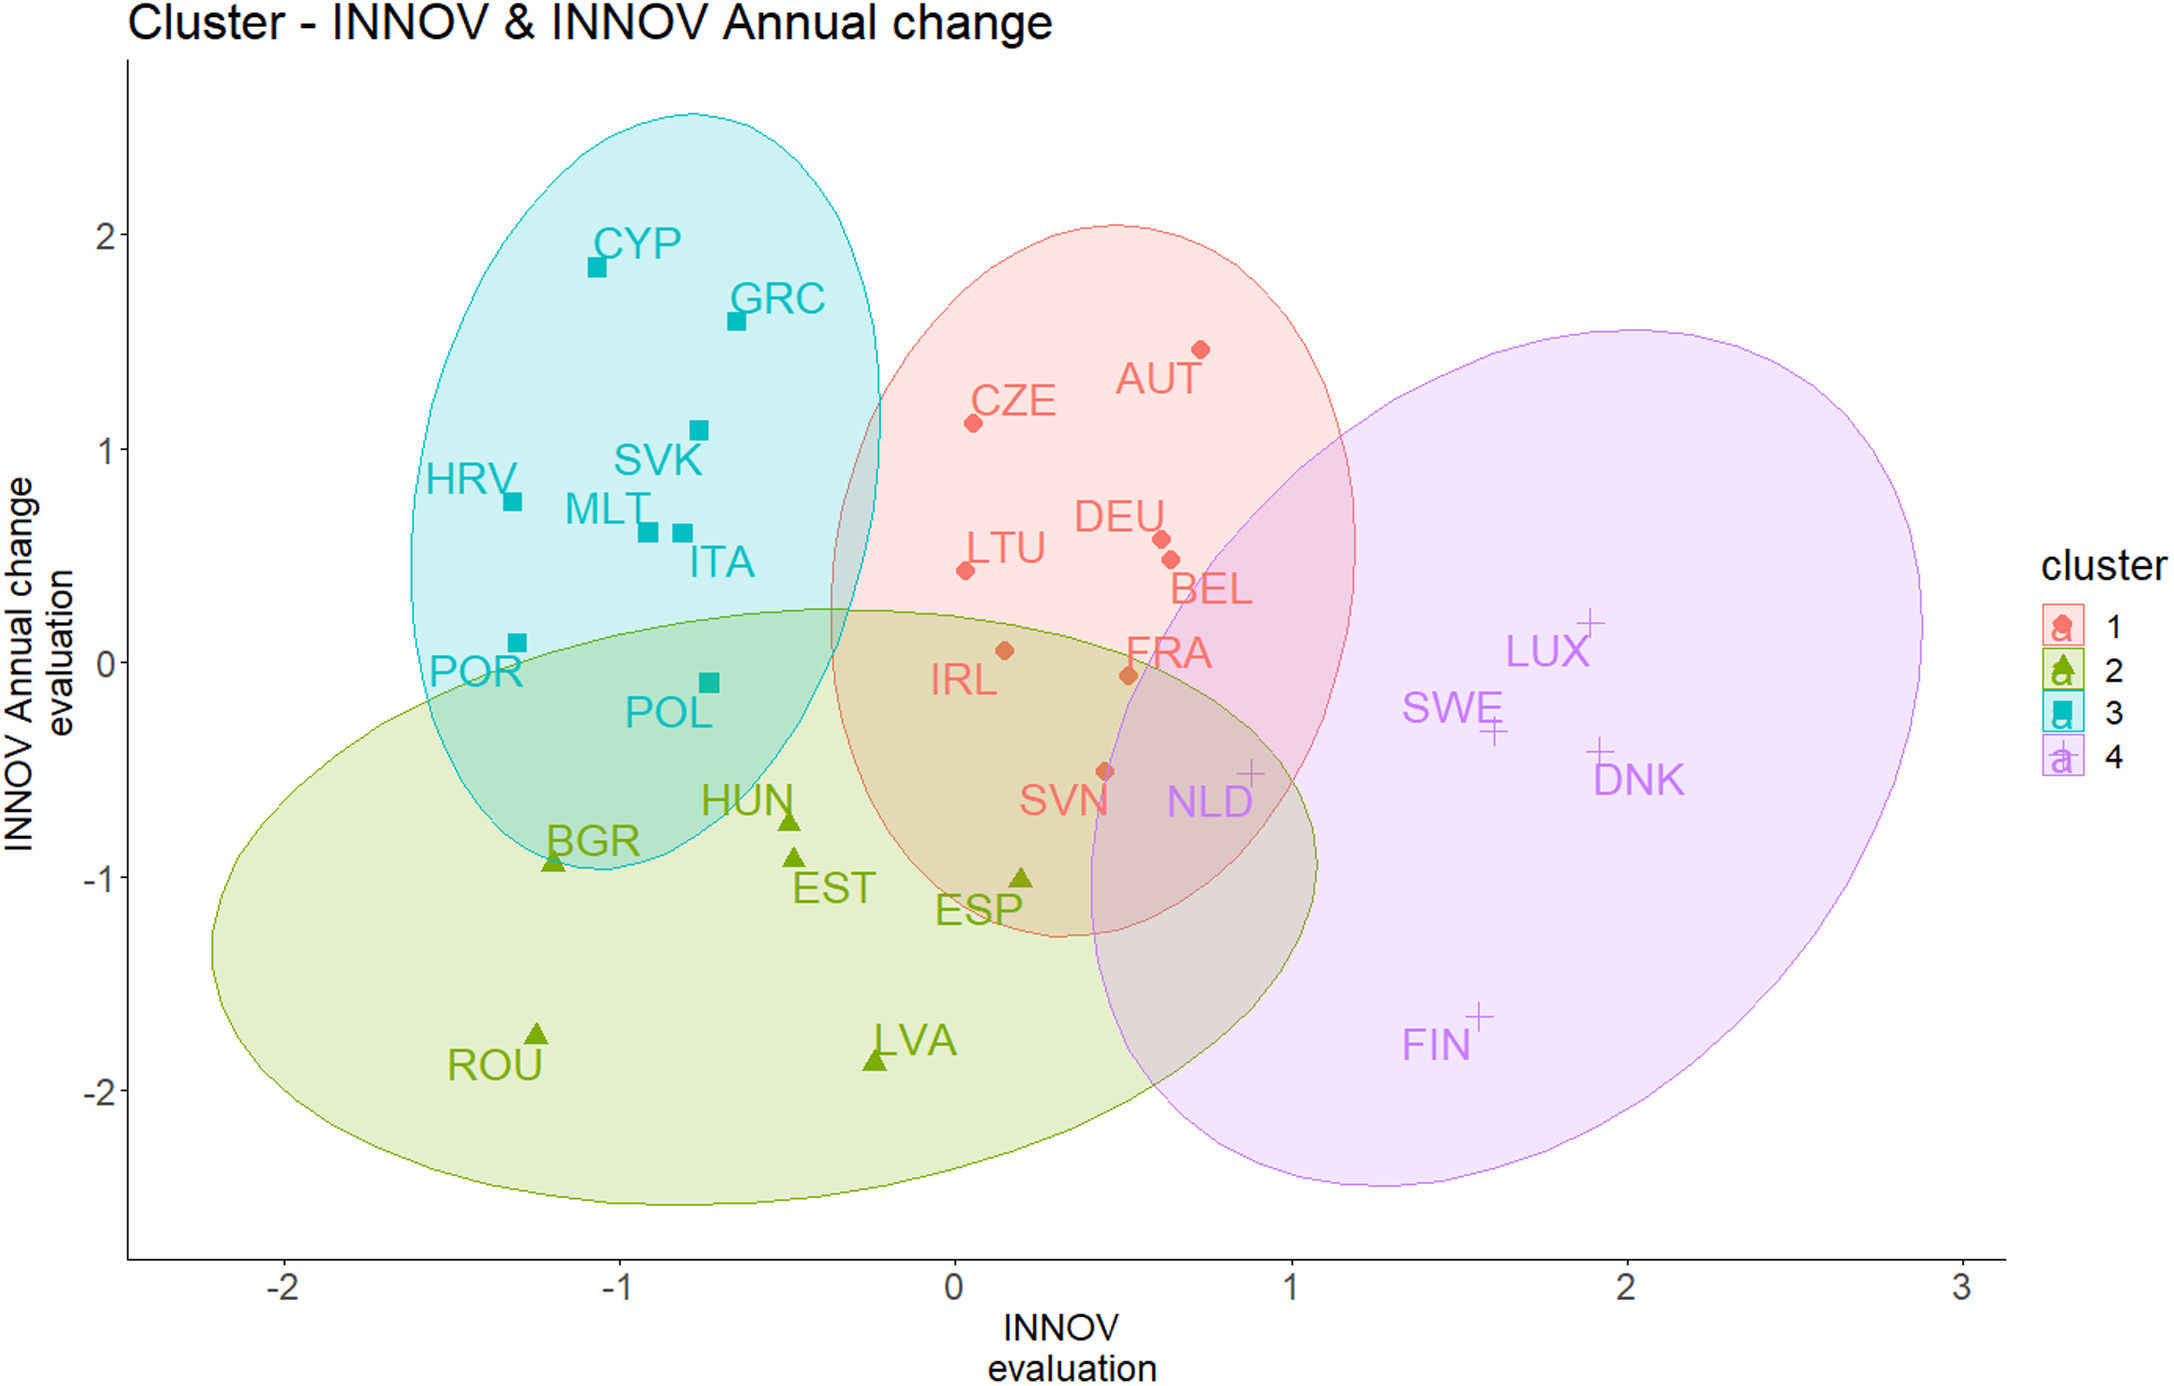
To evaluate the standing of individual EU countries in terms of the analyzed indicators, cluster analysis was utilized. This involved calculating the average of the data for each country over the years. The data were then normalized on a scale from 0 to 1, where a higher value denotes a more favorable assessment. Innovation indicators were averaged to create a new variable. Conversely, the occurrence of particulate matter with diameters of 2.5 µm and 10 µm was inversely standardized, meaning a higher score indicated lower pollution levels. The silhouette method was employed to determine the optimal number of clusters. It suggested dividing the data into three clusters for CMU and four clusters for innovations.
Fig. 1 illustrates the positioning of EU countries in relation to the examined indicators. The results of the cluster analysis reveal that the highest-rated countries are situated in the upper-right quadrant, while the lowest-rated ones are found in the lower-left quadrant. In terms of circular material consumption, the countries in the green cluster, particularly the Netherlands, stand out with a distinctly different position compared to others. The lowest-rated countries fall within the blue cluster, characterized by very low year-on-year changes in circular material consumption, yet these countries still show potential for growth. It is important to note that the lower rankings of Finland and Luxembourg are primarily due to the year-on-year fluctuations in the CMU indicator, which resulted in unfavorable assessments for these nations. Romania shows a slight improvement, ranking as the third lowest-performing country among the selected EU member states.

Fig. 2 visualizes the positioning of EU countries in relation to the studied indicators, specifically focusing on innovations in industry and infrastructure. Sweden, Denmark, and Luxembourg emerged as the top performers in this category. However, Finland's performance was negatively impacted by its year-on-year change. Countries with negative ratings are collectively placed in cluster 2, with Romania occupying the least favorable position. These observations offer insights into the underlying factors contributing to the underperformance of countries typically considered developed. This aspect is further illustrated and elaborated upon in Fig. 3.


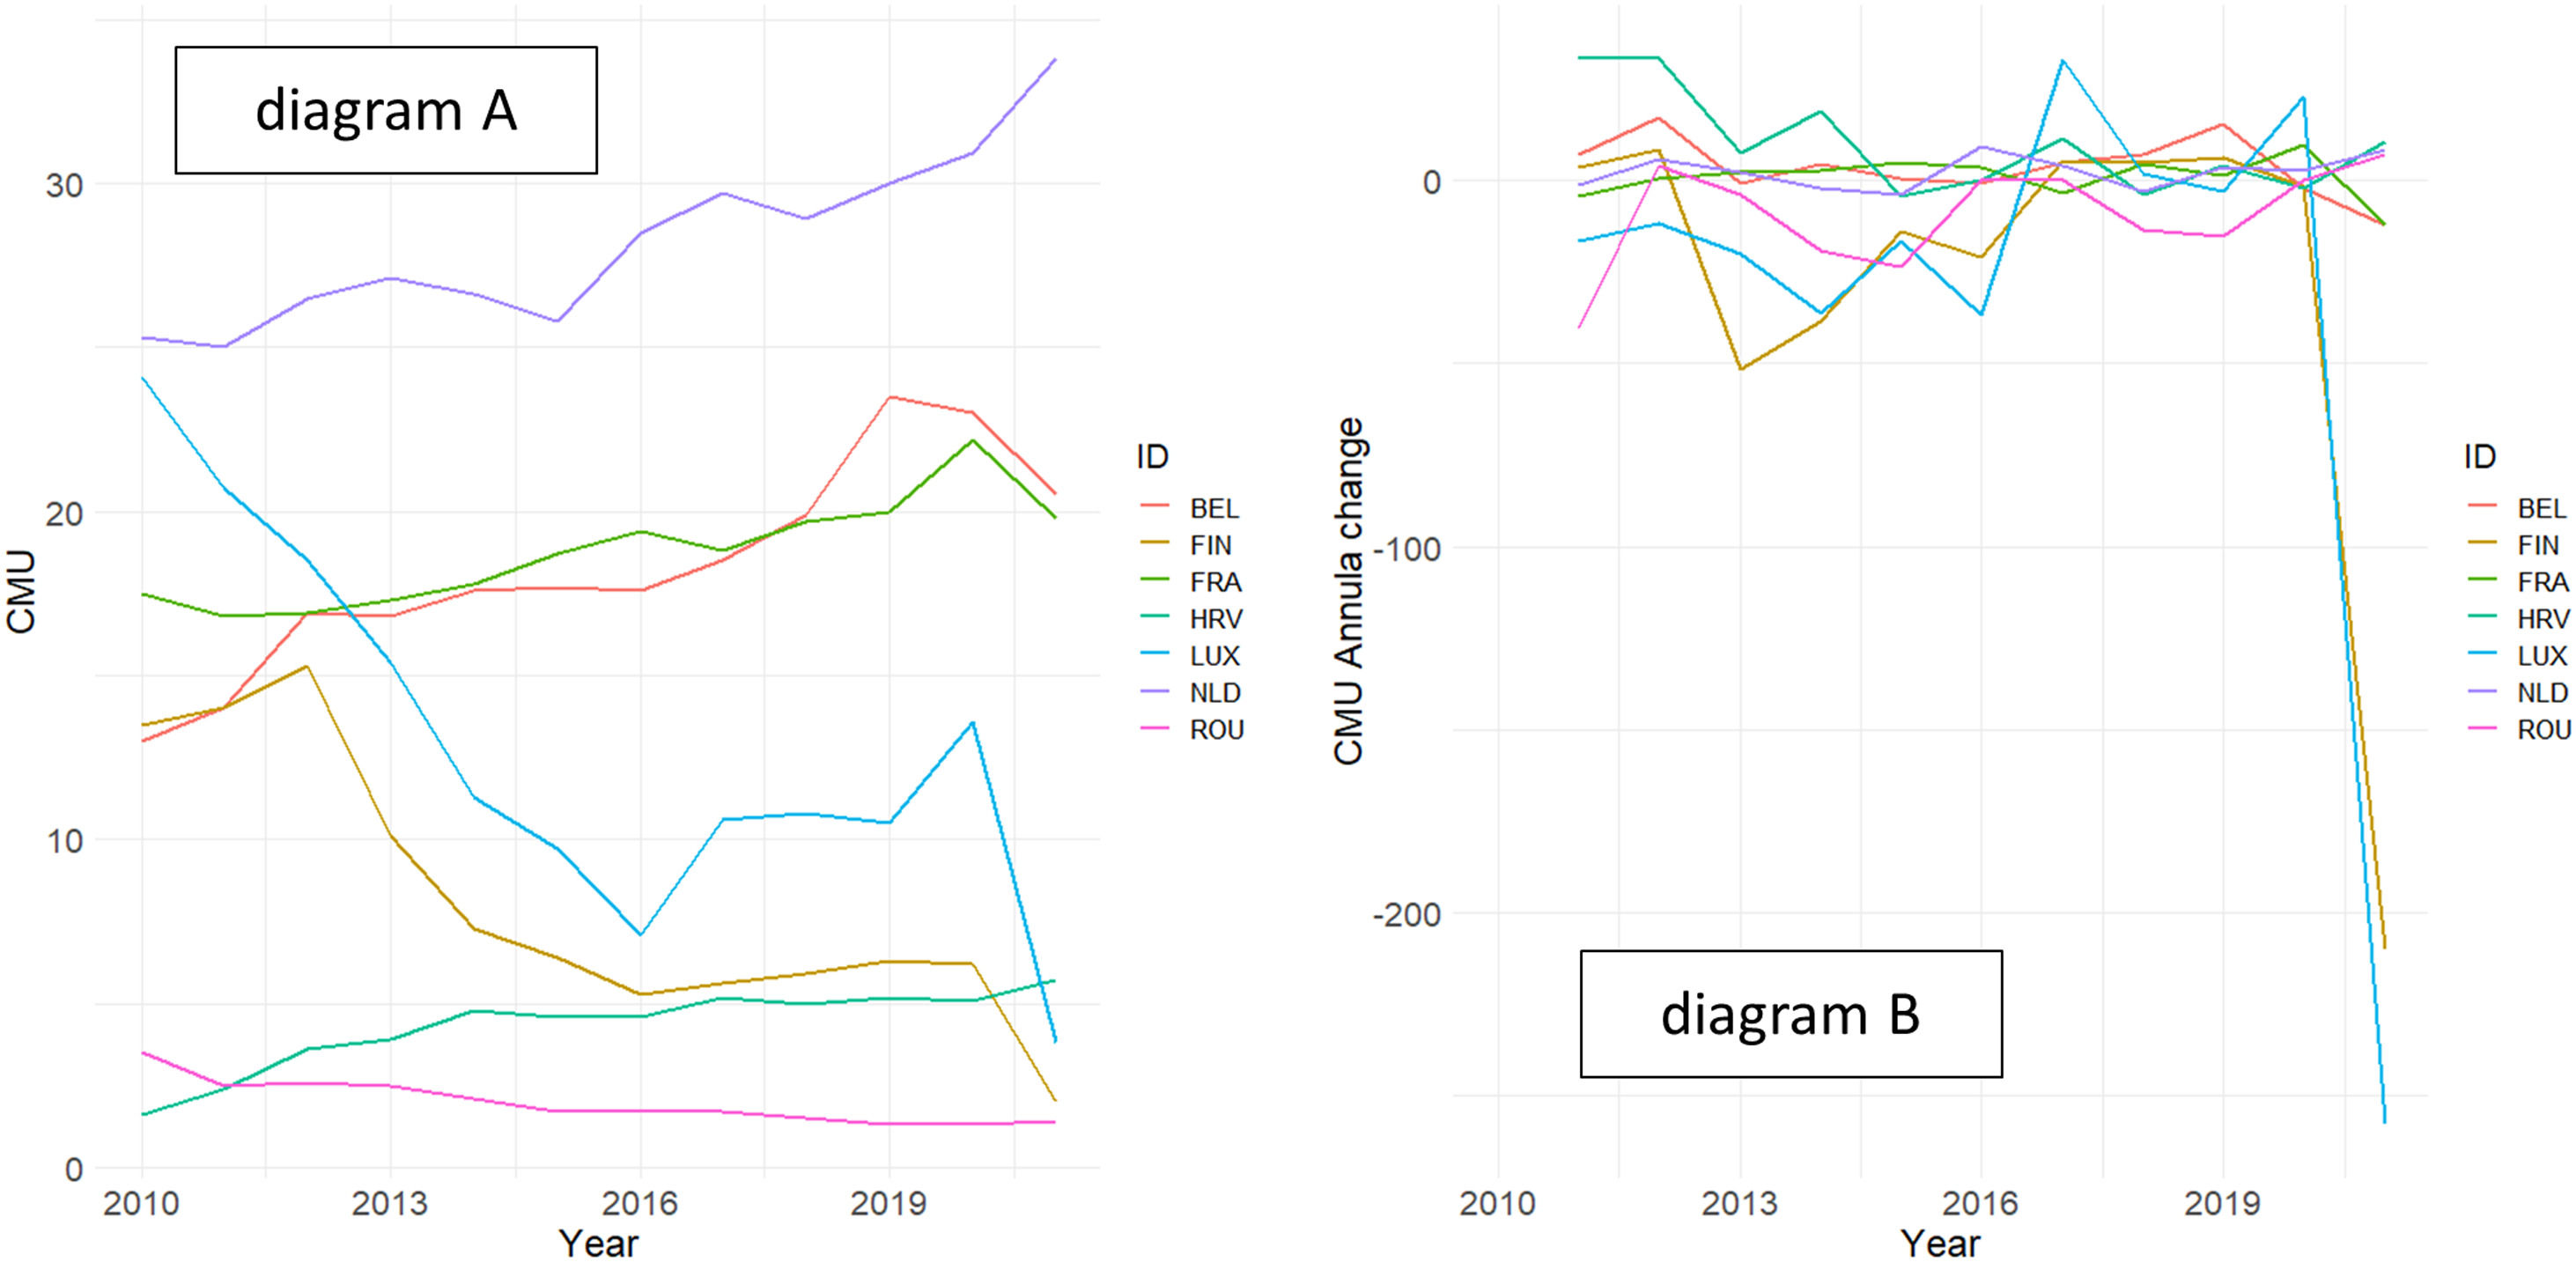
Fig. 3 comprises two trend diagrams. Diagram A concentrates on CM, while Diagram B focuses on the year-on-year change in CMU. The negative trajectory of the CMU year-on-year change, as discussed in Fig. 2, is particularly noteworthy. In Diagram A, a detailed examination of Finland and Luxembourg reveals a long-term downward trend in circular materials consumption. Furthermore, in Diagram B, these countries are distinctly marked by their obvious declines. This trend necessitates a more in-depth analysis, particularly considering these are the countries with relatively high economic development, which initially suggested an expectation of contrary development.
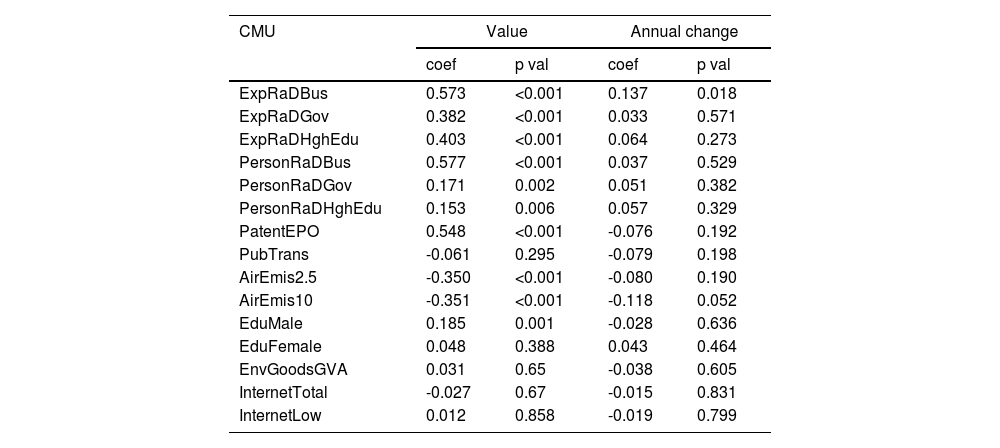
Table 3 outlines the relationships between the indicators of industry and infrastructure innovations and circular materials consumption. The table is bifurcated into two sections: one detailing the general outcomes and the other focusing on the year-on-year changes in these outcomes.
Correlation analysis - Spearman ρ - the industry and infrastructure innovations with CMU.
The evaluation of the statistical significance of the coefficients primarily contrasts with the year-on-year changes of the selected indicators, where the vast majority did not exhibit a significant relationship. In contrast, a significant relationship was confirmed in most instances concerning the general outputs. For the significant outputs, the level of relation predominantly ranged from medium to high. A more comprehensive verification of these relationships is subsequently conducted through panel regression analysis. Owing to the exceedingly low prevalence of significant relationships, several indicators describing year-on-year changes will be excluded from the panel regression analysis.
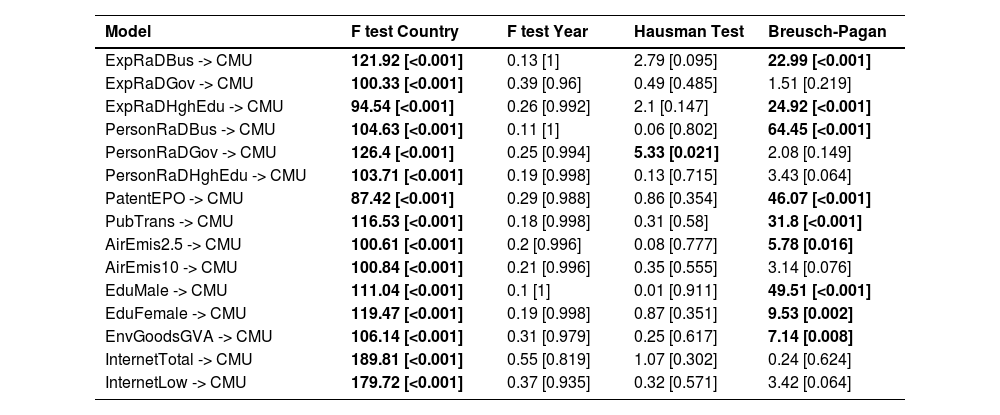
Table 4 provides information about the preferences of the panel regression models and the associated p-values. The outcomes in the table demonstrate that the overall structure of the countries is statistically significant. However, the structure of the countries in individual years remains disputable within the panel regression model. The individual effects model was utilized, and the Hausman test indicates statistical significance in only one instance. Therefore, the fixed effect model is preferred in this context. The last column of the table presents the results of the Breusch-Pagan test, indicating significant heteroscedasticity in the majority of cases. Consequently, robust methods will be employed to estimate the coefficients.
Condition tests of application of the panel regression models.
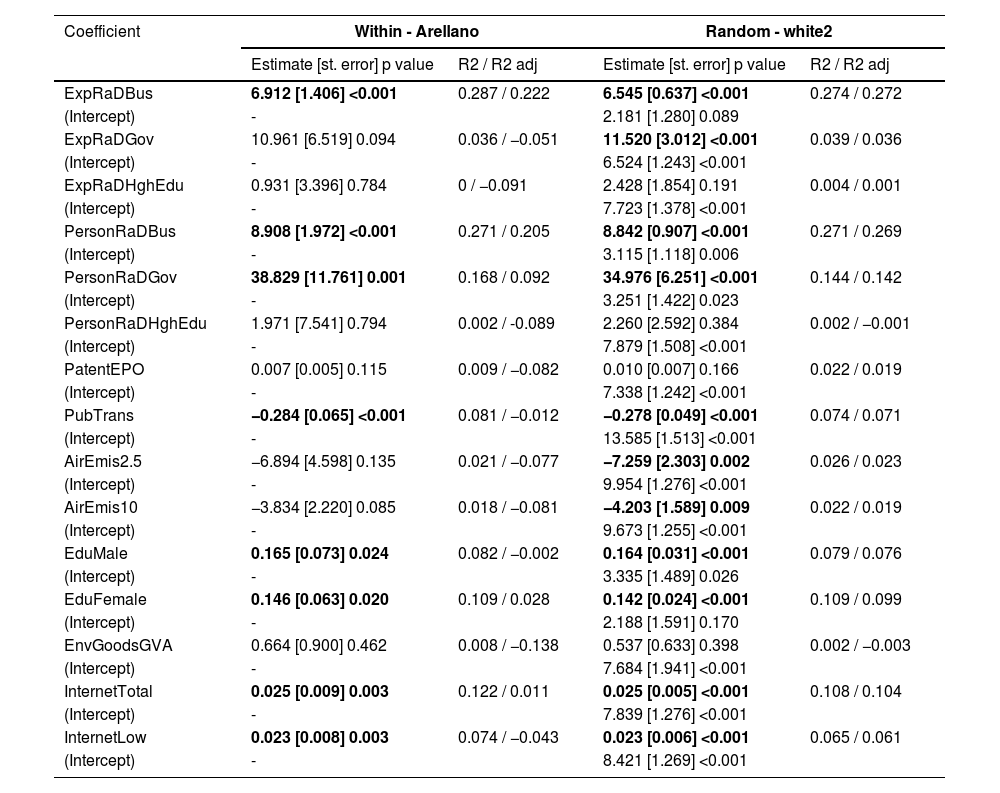
Table 5 illustrates the results of observed relationships confirming the presence of significant connections between industry, infrastructure innovations, and circular materials consumption. The fixed model application was recommended only for the PersonRaDGov -> CMU model. As we can see, the significance of this relationship was confirmed (statistic β: 38.829; standard error: 11.761; p-value: 0.001). In addition to this relationship, significant relationships were observed in 10 other models. In total, these models were evident in 11 out of 15 cases. When interpreting these results, it is advisable to consider the sign of the β coefficient. If the coefficient is positive, then we can expect higher circular materials consumption in countries with a higher level of industrial and infrastructure innovations, and vice versa. In three cases (PubTrans, AirEmis2.5, AirEmis10), a negative relationship was identified, which is predictable given the characteristics of the input variables. In these cases, countries with higher negative outputs, such as air pollution, as well as a higher ratio of public transport (buses, trains), can be associated with lower circular materials use.
Interconnection of the industry and infrastructure innovations indicators and CMU.
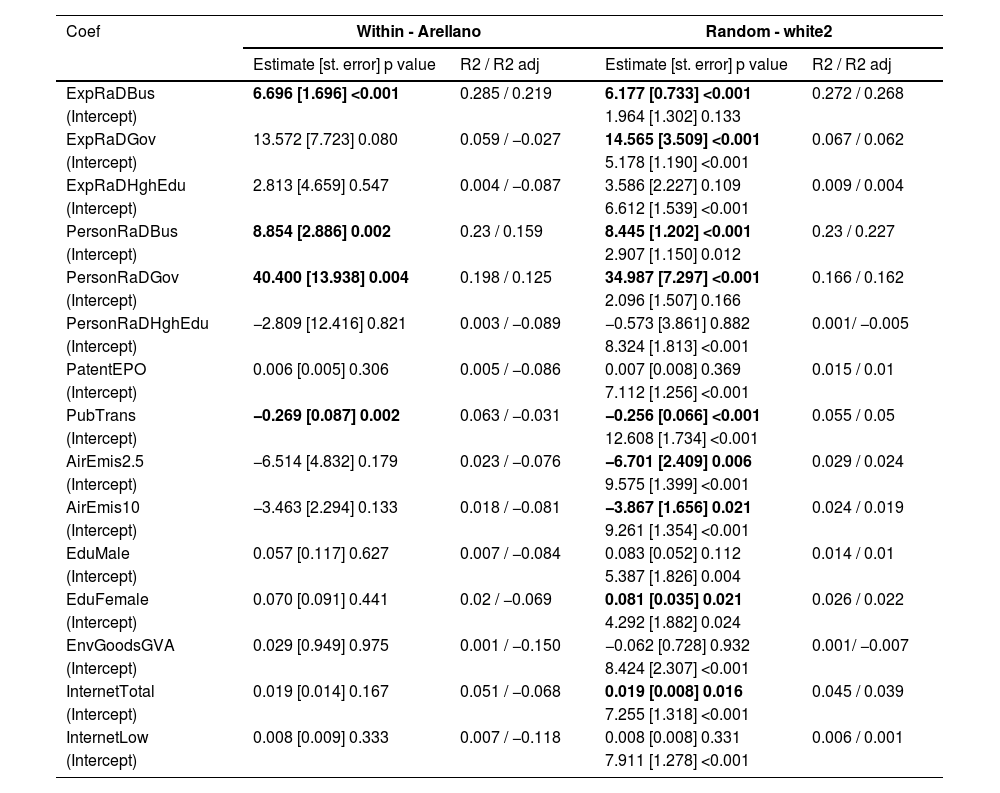
Table 6 presents an assessment of the robustness of the examined models. Robustness was evaluated through the transformation of the sample set. Eighteen countries were selected randomly for the analytical processes, with the number determined using a random algorithm ranging from 10 to 20 countries. Subsequently, the random algorithm specified a sample set consisting of the following specific countries: Belgium, Bulgaria, Croatia, Cyprus, Czechia, Denmark, Estonia, Finland, France, Greece, Luxembourg, Poland, Portugal, Romania, Slovakia, Slovenia, Spain, and Sweden.
Interconnection of the indicators and CMU - robustness evaluation.
The robustness assessment suggests that the outcomes presented in Table 5 are not expected to significantly differ from those in Table 4. A comparison of the results reveals that, in several cases, the models in the robustness table did not exhibit statistical significance (p-value > 0.05) when compared to Table 4. Regarding the sign of the coefficients, there was only one difference, which pertained to the PersonRaDHghEdu fixed effects model. The results of the robustness assessment are indicative of the sample, implying that outcomes demonstrating consistent results and minimal deviation in the standard error between the regular and robust models can be generalized for the entire EU. However, for models with different results, caution is recommended when attempting to make generalizations.
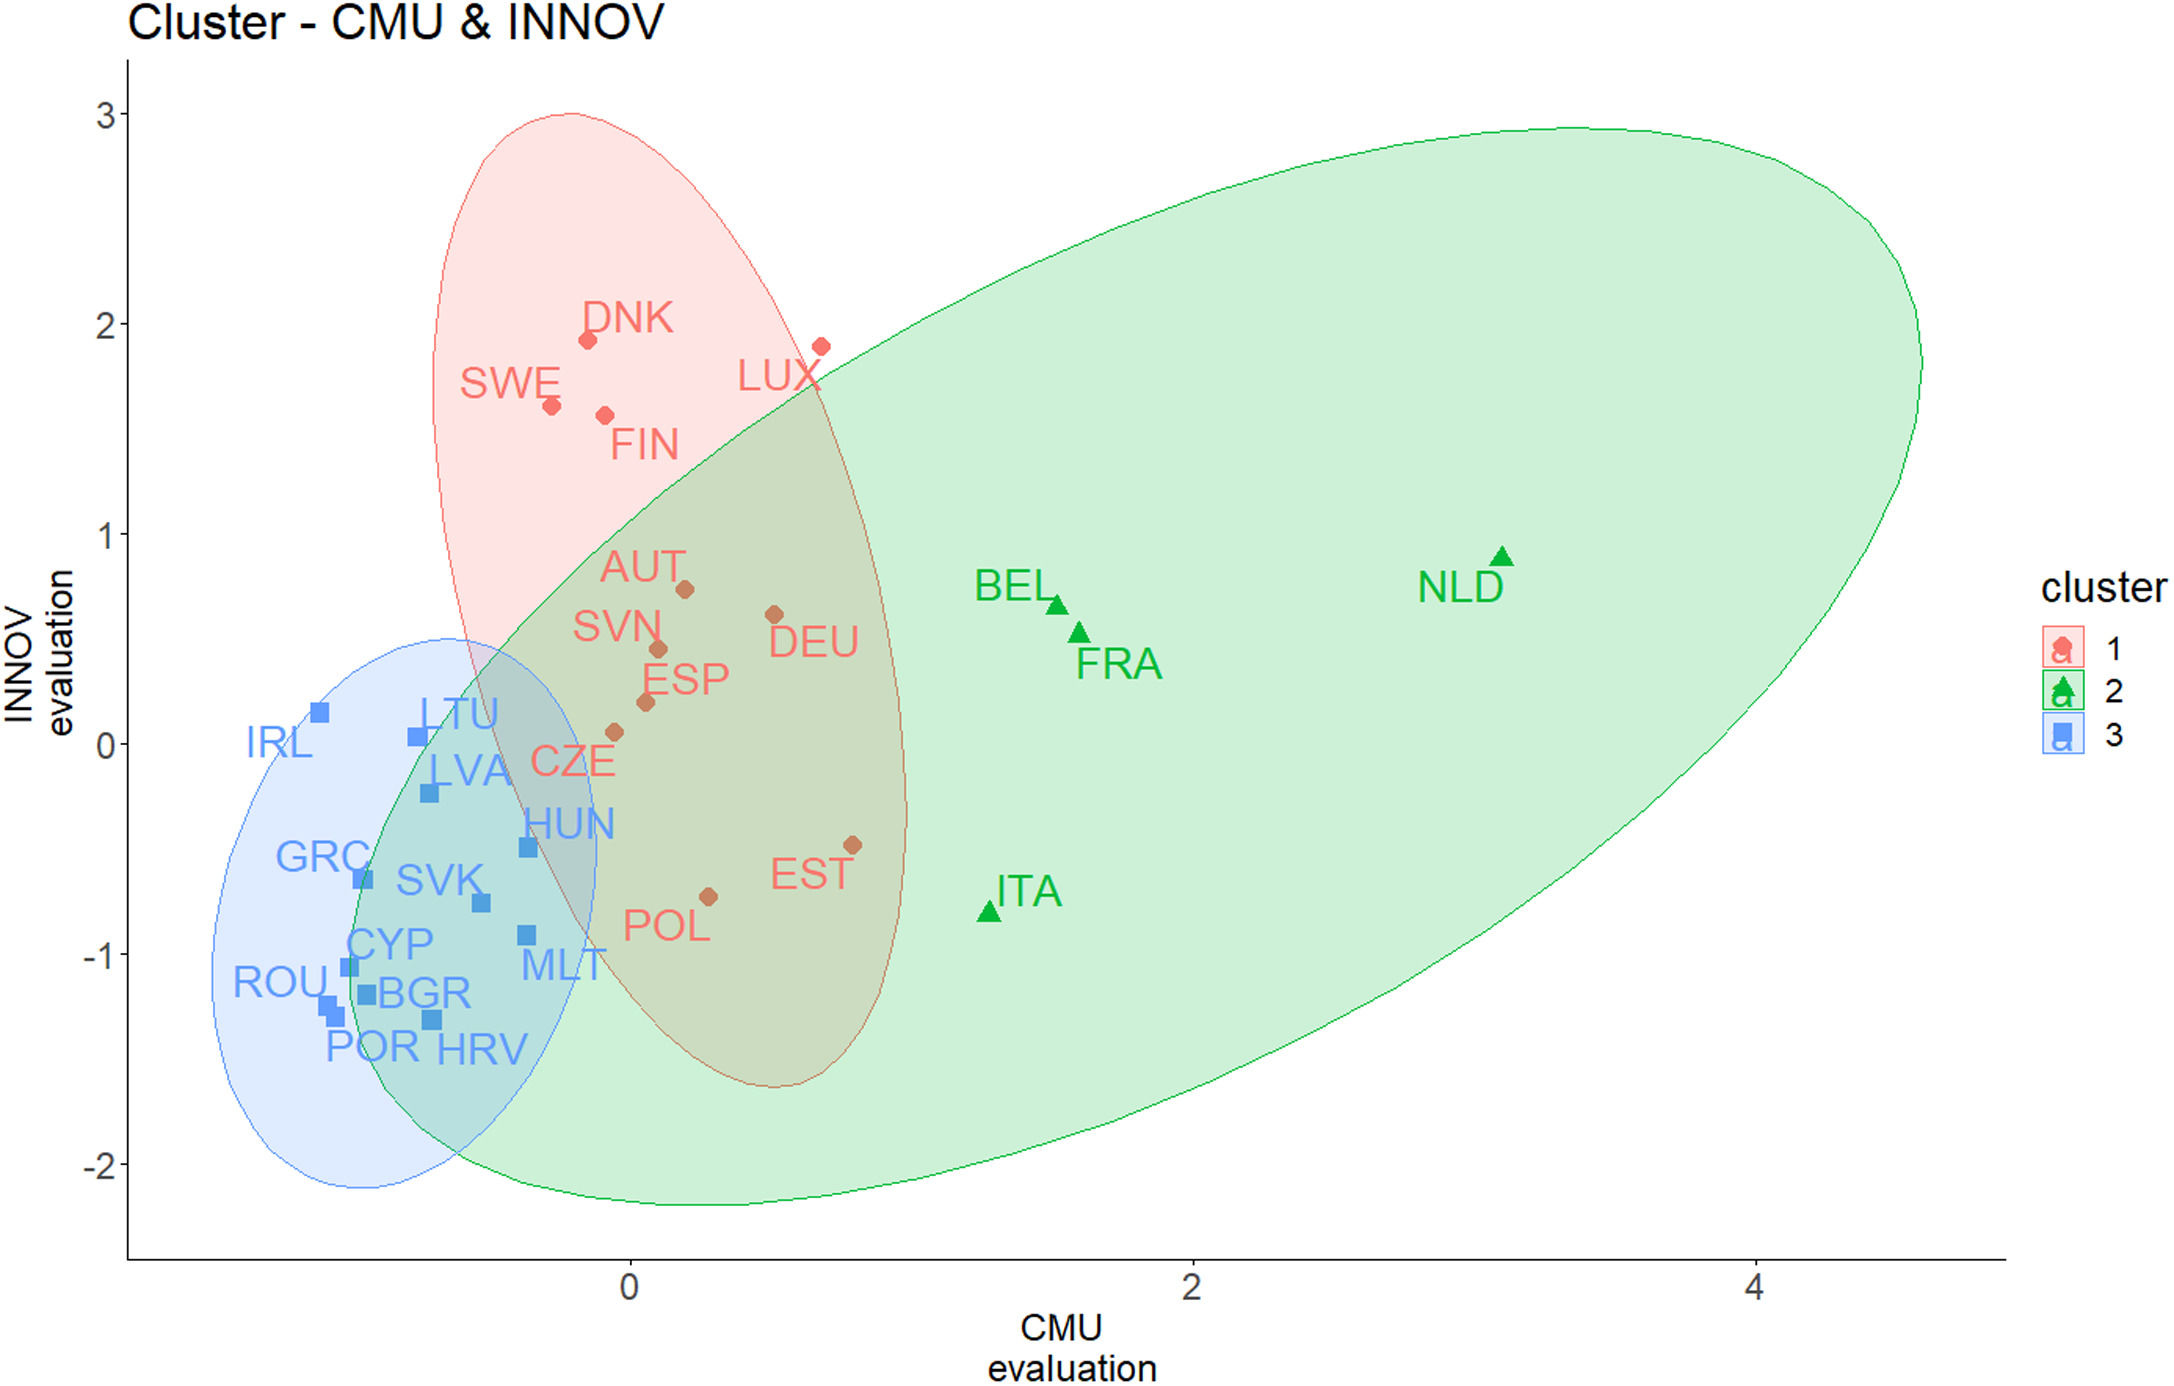
To assess the position of individual countries in the relationship between circular materials usage and innovations in the industry and infrastructure (Fig. 4), we employed cluster analysis. The input for this analysis was represented by average data, calculated by averaging values for each country over the observed period. Subsequently, the data were standardized to a scale from 0 to 1, where a higher value indicates a more positive evaluation. The indicators for industry and infrastructure innovations were averaged to create a new variable. However, for the occurrence of solid particles in the air of 2.5 µm and 10 µm, standardization was reversed, meaning a more positive evaluation represents a lower occurrence of pollution. The silhouette method was utilized to determine the number of clusters, recommending a division into three clusters. Fig. 3 prominently highlights that countries in the upper-right corner can be considered the best-rated, while those in the lower-left corner are the worst-rated. With this perspective in mind, we draw attention to the position of the countries in the blue cluster, which includes Romania, Portugal, Croatia, and Bulgaria. Denmark holds the most favorable position in terms of innovations in the industry and infrastructure, while the Netherlands excels in terms of CMU.
Discussion
The primary objective of this study was to quantify the impact of industry and infrastructure innovations on sustainable production and consumption within the CE in EU countries. To achieve this aim, the study followed two distinct research trajectories. In the first area, the study examined the positions of EU countries in terms of circular materials consumption and innovations in industry and infrastructure. Significant differences were observed in both circular materials consumption and innovations in industry and infrastructure among the countries. The second research trajectory focused on exploring the interconnection between innovations in industry and infrastructure and circular materials consumption.
In the initial phase of the analytical processes, descriptive analysis was applied to evaluate the overall outcomes and their year-to-year changes. The results of the analyses confirmed significant differences among the countries, particularly in year-on-year changes. Some indicators exhibited coefficients of variation on the order of hundreds to thousands percent, highlighting substantial fluctuations over time. These significant changes in the monitored CE indicators align with findings from previous research studies (Tantau et al., 2018; Sverko Grdic et al., 2020).
Investigation of the relations between CE material use and innovation indicatorsThe interconnection between circular materials consumption, innovation indicators, and their interannual changes was investigated through cluster analysis. Some countries exhibited very low values of year-on-year changes and an average, or even below-average, level of circular materials consumption, as seen in Finland and Luxembourg. Romania also displayed very low circular materials consumption and a low growth rate in year-on-year changes. In contrast, countries such as the Netherlands, Belgium, and France showed relatively high levels of circular materials consumption and year-on-year growth rates in the monitored indicators. Regarding industry and infrastructure innovation, Luxembourg, Sweden, and Denmark dominated in this area, while Romania lagged significantly behind. These findings align with the results of several research studies, including López-Portillo et al. (2021), Bassi and Dias (2019), and others, which explicitly confirm differences in CE use rates among countries. These differences are attributed to various factors, such as waste treatment behavior, R&D expenditures, GDP per capita, and resource productivity. Bassi and Dias (2019) confirmed the relevance of examining the fundamental characteristics of enterprises, such as their size in terms of the number of employees, turnover, and sector. They also discussed the influence of the various adapted policies in the EU countries. The importance of the sector as a determinant of the different CE use rate in relation to the innovations is also confirmed by Brandao et al. (2021), Pinchuk et al. (2019), and others.
From the outcomes of the cluster analysis examining the relationship between circular materials consumption and industry and infrastructure innovations, it appears that Romania is among the countries with the lowest rating. Portugal, Croatia, Bulgaria, and Cyprus also fall into this category. Despite their low ratings, these countries have the potential for stable and rapid growth if appropriate policies are implemented. Denmark, Luxembourg, Finland, Sweden, and the Netherlands received positive evaluations. However, there is a negative trend in year-on-year changes, particularly in Luxembourg and Finland, suggesting that these countries should focus on this area and use appropriate policies to positively influence the trend. Constructing optimal policies to improve circular materials usage rates and increase industry and infrastructure innovations is a complex process in each country. Challenges include insufficient measurements, classification of indicators according to CE strategies, measurement ranges, methodologies for estimating CE potentials, and more, as highlighted in studies by Moraga et al. (2019), Geerken et al. (2019), Rincón-Moreno et al. (2021).
From the analytical outcomes of panel regression analysis, it is demonstrated that there is a significant relationship between innovation indicators and circular materials usage rates in the majority of cases. Overall, a significant relationship was confirmed in 11 out of 15 tested relationships.
Evaluation of the research questions RQ1 to RQ8In the investigation of the eight research questions focused on various indicators, interesting results were discovered:
RQ1 aimed to verify the relationships between circular materials usage and gross domestic expenditure on R&D. A positive, significant relationship was identified for the ratio of expenditures on science and research in the business and government sectors. A stronger relation was found in the business sector compared to the government sector. However, no significant relationship was confirmed for higher education. These findings suggest that countries with a higher ratio of spending on science and research in both the business and government sectors tend to exhibit a higher rate of circular materials usage. Increased investment in these areas could potentially boost circular materials usage.
As part of RQ2, the relationship between circular materials consumption and employment in R&D was investigated. A positive, significant relationship was observed in the business and government sectors, while the higher education sector did not exhibit a significant correlation with circular material usage. Assessing the employment aspect in relation to CE presents procedural challenges in many European countries due to the diverse job requirements in Central Europe. This necessitates the implementation of specific education and training programs, as highlighted in studies by Burger et al. (2019) and Dumitrescu (2020). Dieleman and Martínez-Rodríguez (2019) also emphasize the slow progress in implementing CE processes, which can impact various CE-related indicators.
In RQ3, the impact of patents on circular materials usage was explored, but no significant relationship was demonstrated. This result aligns with the findings of Zwart (2021), which suggest that patents do not currently drive global CE advancement. However, there are studies, such as those by Portillo-Tarragona et al. (2022) and Marín-Vinuesa et al. (2023), which present different perspectives on the role of patents in CE development.
RQ4 focused on linking the ratio of public transport to total transport with circular materials usage, revealing a negative, significant relationship. Even in developed countries with higher circular materials usage, public transport is not significantly preferred. De Blas et al. (2020) confirm that climate stabilization cannot be achieved solely by replacing diesel vehicles with electric ones. These findings are consistent with Alaerts et al. (2020), who criticize the lack of a significant shift from personal transport to more eco-friendly alternatives within countries. Addressing this issue requires structural changes in transport systems, demanding effective decision-making processes and the development of smart mobility plans, as discussed by Pamučar et al. (2023).
RQ5 explored the field of air pollution and found negative, significant relationships with circular materials consumption. Many authors advocate for improved planning of preventive measures for air pollution and the search for optimal solutions to achieve zero pollution, as highlighted by Awan et al. (2019). These challenges also entail evaluating health impacts. Addressing these issues requires not only the introduction of new-generation production processes but also the application of AI elements, which are expected to have positive effects across all sectors, as suggested by Pinchuk et al. (2019) and Xiong and Xu (2021).
The tertiary education rate is frequently investigated in relation to CE. Moreover, discussions surrounding the requirements for the education system in relation to CE strategies are on the rise. The inadequately developed CE concepts or significant differentiation within sectors can contribute to the creation of non-systematic educational programs. This, in turn, leads to incompatibility with CE utilization and its outcomes. This aspect was explored within the framework of RQ 6. Gender aspects introduce other interesting perspectives to this issue. It was discovered that in countries where there is a higher participation rate in tertiary education among individuals aged 25 to 35, both men and women, a greater utilization of circular materials can be anticipated. The association was found to be slightly stronger in women than in men. These findings align with previous studies such as Bugallo-Rodríguez and Vega-Marcote (2020), Burns (2018), Coleman and Gould (2019), and Serrano-Bedia and Perez-Perez (2022). These studies highlight that in many countries, an educational system compatible with the requirements of CE processes is being developed. Countries recognize the significance of higher education in CE transformation processes. However, there is a lack of studies analyzing the critical role of universities in the transition of the countries to CE. To ensure the continuous evolution of the traditional education system into a dynamic one that reflects the transitioning economies toward CE, cross-sector collaboration and network-building at the national and international levels will be essential. Some authors also emphasize the need to establish dynamic university management models, which will require cross-sector collaborative ties as well (Qu et al., 2021).
RQ7 examined the relationship between circular materials usage and the gross added value of environmental goods in the environment and resource management sector but did not uncover statistically significant results.
Industry and infrastructure innovations are frequently explored with the internet connection indicator. As part of RQ8, the investigation delved into the relationship between circular materials use and high-speed internet coverage. A significant positive correlation was identified in this indicator, both without regional development categorization and beyond industrial units. These findings align with the outcomes of several research studies, which emphasize a clear connection to the Internet of Things (IoT). IoT can potentially facilitate the digitalization of numerous operations and processes (Kerdlap et al., 2019). Some research studies point out that the IoT technologies, despite their strong potential for driving the digital transformation of economies toward sustainability, it does not contribute to the sustainable development of the IoT sector itself due to its significant carbon footprint resulting from the use of scarce raw materials and energy in production, operation, and recycling processes (Fraga-Lamas et al., 2021). Nevertheless, recent studies offer guidance on how to leverage IoT to support CE strategies (Rejeb et al., 2020; Beier et al., 2018; Ferrera et al., 2017).
Some authors affirm that current research aligns with the goals defined by various national programs (Machado et al., 2020). However, our research results highlight several research gaps and, consequently, define new research opportunities in the field. These opportunities aim to clarify specificities within sectors and their interconnections, particularly concerning the current state of CE development and technological innovation.
ConclusionThe concepts of sustainable production and consumption, along with the integration of new technologies, should comprehensively support multiple dimensions of sustainability. This includes the development of SBMs, sustainable supply chains, sustainable circular production systems, and product design, among other aspects. Numerous research studies reveal that this field is not yet fully consolidated and is influenced by various factors. Therefore, it is crucial to understand the approaches to the most critical dimensions of sustainable production and consumption and examine the influence of innovative and technological potential on them. CE policies in individual countries play a significant role and are a key component of climate policies. The choice of preferred policies depends on their creators and the primary goals they aim to achieve. While economic outcomes should not dominate the selection of environmental policies, it is important to identify and prioritize other environmental objectives. Policies that stimulate innovation will be essential for the transition to a CE, and their impact on the efficiency and competitiveness of industries in Europe is expected to grow. Identified regional disparities and discrepancies within countries in the field of CE highlight the need for secondary redistribution policies to maintain public support for the CE transition. The results of our study draw attention to these facts. The primary objective of this study was to quantify the impact of industry and infrastructure innovations on sustainable production and consumption in the context of the CE within EU countries. Secondary data spanning from 2010 to 2021 related to SDG-9 and SDG-12 was analyzed. The study employed regression analysis and clustering analysis to investigate eight research questions. The results revealed significant variations in the relationships between CMU and innovations in industry and infrastructure. The study results affirm the significance of exploring the mentioned relationships, recognizing that this area constitutes only a partial aspect of the broader landscape of innovation and technological development processes. While this research framework provided valuable insights, it also highlighted the need for further research to improve CE processes and integrate them into technological and innovation development. By examining the relationships between individual indicators, significant differences between countries were identified. These differences were influenced by various policies, rates of technological and innovative development, and demographic and socio-economic characteristics. This underscores the need for investigating the individual dimensions using in-depth data and emphasizes the importance of creating shared national and international databases. Such databases would enable the active connection between micro and macro levels, which is crucial for crafting effective policies within CE and developing new approaches and methodologies.
It is important to note that the study identified some data limitations. The gross value-added indicator in the environmental goods and services sector demonstrated relatively many missing statistical units in the initial years. In addition, the indicator for the ratio of public transport is not comprehensive, as it does not encompass all types of transport. When interpreting results related to these indicators, caution is advised. Future research will focus on uncovering the determinants that contributed to the negative assessment of circular materials consumption in developed countries such as Luxembourg and Finland.
FundingThis work was supported by Tomas Bata University in Zlín via RVO Excellent project number RO/FaME/2023/03, “Application of circular economy principles to the creation of circular business models and economic quantification of the use of circular economy in the economy of European countries.”
Ethical approvalAll procedures performed in studies involving human participants were in accordance with the ethical standards of the institutional and/or national research committee and with the 1964 Helsinki declaration and its later amendments or comparable ethical standards.
CRediT authorship contribution statementMarinko Skare: Methodology, Formal analysis, Supervision, Validation, Visualization, Investigation, Writing – original draft, Writing – review & editing. Beata Gavurova: Conceptualization, Funding acquisition, Investigation, Resources, Project administration, Writing – original draft, Writing – review & editing. Martin Rigelsky: Data curation, Formal analysis, Methodology, Software, Writing – review & editing.