


Despite its obvious motivational impairment, anhedonia as a transdiagnostic psychopathological construct is accompanied by deficits in attention function. Previous studies have identified voluntary attention anomalies in anhedonia, but its involuntary attention has received less study.
MethodUsing a visual novelty oddball task, the current event-related potential study assessed electrophysical correlates underlying mismatch detection in anhedonia with a non-clinical sample. Well-matched healthy control (N = 28; CNT), social anhedonia (N = 27; SA), and physical anhedonia (N = 26; PA) groups were presented standard, target, and perceptually novel stimuli while their EEG was recording.
ResultsThe PA group relative to the CNT group exhibited a reduced N2 to novel stimuli but not to target stimuli. In contrast, the SA group as compared to the other two groups showed comparable N2 responses to both target and novel stimuli. Control analyses indicated that these patterns were unaffected by depression symptoms.
ConclusionsThese findings suggest that anhedonia is a heterogenous construct associated with impairments in early detection of visual novelty in physical but not social anhedonia, highlighting that dysfunction in involuntary attention may play a mediating role in the development, maintenance, and consequences of anhedonia-related psychopathology.
Anhedonia refers to a reduced interest or pleasure in physical or social activities (Chapman et al., 1976). The most outstanding feature of anhedonia is its transdiagnostic nature in various psychopathological conditions such as major depressive disorder (Treadway & Zald, 2011) and schizophrenia with negative symptoms (Wolf, 2006). As such, anhedonia has been included as one dimension of the Research Domain Criteria, a classification framework aiming to identify psychological and pathological mechanisms common to relevant diseases (Insel et al., 2010). Importantly, anhedonia can also be present in non-clinical populations as an enduring personality trait and serves as a potential candidate for psychopathological endophenotype (Hasler et al., 2004; Pizzagalli et al., 2005), representing the genetic liability of relevant disorders in nonaffected but susceptible individuals. One endeavor in this direction is to elucidate the psychological and neurobiological substrates underlying anhedonia among non-clinical samples (Barkus & Badcock, 2019; Harvey et al., 2007), which can provide important insights into the prevention and diagnosis of relevant diseases.
It has been known for decades that anhedonia is a heterogenous construct and can be decomposed into physical and social anhedonia (Chapman et al., 1976), and this two-dimensional structure of anhedonia has been validated among both non-clinical and clinical individuals (Langvik & Borgen Austad, 2019; Yang et al., 2022). Physical anhedonia is associated with decreased pleasure for physical or sensory experiences, whereas social anhedonia involves deriving less pleasure from social interaction with other people. Several lines of evidence suggest that physical and social anhedonia are dissociable psychologically and neurobiologically. For example, individuals with depression symptoms typically exhibit physical and social anhedonia simultaneously, but those with schizophrenia spectrum disorder display social anhedonia more frequently than physical anhedonia (Blanchard & Cohen, 2006; Gandhi et al., 2022). Finally, previous neuroimaging studies have identified distinct structural and neural patterns for physical and social anhedonia (Wang et al., 2014; Zhang et al., 2016).
Although emotional and motivational impairments are the most dramatic feature of anhedonia (Der-Avakian & Markou, 2012; Romer Thomsen et al., 2015), this construct is also accompanied by cognitive deficits and information processing anomalies (Gooding & Pflum, 2022; Yu et al., 2021). Of these, deficits in attention function have attracted the most interest in the literature (Arnfred & Chen, 2004; Cohen et al., 2012; Franken et al., 2006; Salgari et al., 2021). Indeed, attentional dysfunction has been repeatedly shown among individuals with physical anhedonia (Dubal et al., 2000; Yee & Miller, 1994), whereas social cognitive impairment has been reliably observed among individuals with social anhedonia (Barkus, 2021; Barkus & Badcock, 2019). Unfortunately, previous studies have focused on the voluntary attention but largely overlooked another important aspect of attention: the involuntary attention, which is not elicited by intentions but by prominent or salient events (Eimer et al., 1996).
Several event-related potentials (ERPs) studies have examined the relationship between anhedonia and mismatch detection, a critical mechanism triggering involuntary attention (Friedman et al., 2001; Ranganath & Rainer, 2003). These studies have focused on the anterior N2, a frontally negative deflection peaking between 200 and 350 ms after stimulus onset (Folstein & Van Petten, 2008). The anterior N2 related to mismatch detection is referred as to the mismatched negativity (MMN; previously known as the N2a) in the auditory modality (Naatanen et al., 2007) and novelty N2 in the visual modality (Daffner et al., 2000). The auditory MMN is typically observed in the absence of focal attention and is thought to reflect the automatic detection of stimulus changes. In contrast, the visual novelty N2 is sensitive to the mismatch between an external stimulus and an available mental template formed by either short-term or long-term experience (Folstein & Van Petten, 2008). Using a pitch discrimination task, Miller (1986) first found that individuals with high physical anhedonia relative to healthy controls showed an enhanced N2 over frontal areas. The author interpreted the N2 enhancement as a deficit in the use of memory template whereby anhedonics processed each tone as novel even when it was objectively familiar. Two following-up studies (Fernandes et al., 1999; Giese-Davis et al., 1993) examined the N2b in an attention condition and the MMN in an ignore condition as a function of degree of mismatch of a stimulus with preceding stimuli. The authors found that the MMN in the ignore condition was increased linearly as the length of the homogeneous sequence increased across physical anheonics and healthy controls. In the attention condition, however, anhedonics relative to healthy controls exhibited an enhanced N2b when the new stimulus matched the template but not when it mismatched the template. The authors interpreted the abnormal N2b as a deficit in “voluntary, strategy-sensitive process” in anhedonia (Giese-Davis et al., 1993). Finally, two other studies using an auditory oddball task found no N2 differences between depressed patients with low physical anhedonia and those with high physical anhedonia (Bruder et al., 1998) or between non-clinical individuals with high social anhedonia and those with low social anhedonia (Nuchpongsai et al., 1999).
One limitation of previous research is that the anterior N2 elicited by auditory stimuli is often a mixture of the MMN, N2b, and N2c (Folstein & Van Petten, 2008), resulting in that mismatch detection mechanisms underlying anhedonia remain elusive. Importantly, although the abnormal N2 in anhedonia is mainly observed in response to the mismatch of a stimulus with a mental template (i.e., novelty), it should be noted that novelty can be either context-based or stimulus-based (Folstein & Van Petten, 2008; Friedman et al., 2001; Ranganath & Rainer, 2003). The context-based novelty refers to the deviation from a perceptual template based on shorter-term exposure to recurring standards. In contrast, the stimulus-based novelty refers to the deviation from a perceptual template based on long-term experiences with ordinary objects. In previous anhedonia studies, the mismatch N2 is largely context-based (Fernandes et al., 1999; Giese-Davis et al., 1993). To our knowledge, no studies examined the mismatch N2 in response to the deviation from long-term experience (i.e., stimulus-based). Interestingly, it is well established that the unusual or unfamiliar nature of stimulus novelty is the main source of the anterior N2 in the visual modality (Daffner et al., 2000; Nittono et al., 2007). Moreover, although physical and social anhedonia is dissociable psychologically and neurobiologically, previous ERP studies on mismatch detection never took into account the construct of anhedonia.
Here, we set out to characterize the electrophysiological correlates underlying mismatch detection in physical and social anhedonia using a non-clinical sample. We carefully selected our participants such that their physical anhedonia was orthogonal to social anhedonia. We recorded Electroencephalogram (EEG) with a visual novelty oddball task wherein participants responded to the target stimuli and ignored the standard and novel stimuli. The novel stimuli were highly unusual and unfamiliar objects and thus resulted in a discrepancy from stored representation, which could elicit a reliable, large novelty N2 over frontal areas (Daffner et al., 2000; Tarbi et al., 2011). We hypothesized a reduced anterior N2 in response to novel but not to target stimuli in anhedonia, which should be observed among participants high in physical anhedonia rather than social anhedonia.
Material and methodsParticipantsParticipants consisted of a healthy control (CNT) group (N = 29), a social anhedonia (SA) group (N = 27), and a physical anhedonia (PA) group (N = 26). All participants were selected from a large sample pool of 1577 university students (579 males and 998 females) based on their scores on the Chinese version of the Revised Chapman Physical Anhedonia Scale (RPAS) and the Revised Chapman Social Anhedonia Scale (RSAS; Chan et al., 2012). The RPAS contains 61 true-false items to assess individual differences in the ability to experience pleasure from physical or sensory experiences. The RSAS contains 40 true-false items to assess individual differences in the capacity to experience pleasure from social stimuli. A higher score on the RPAS or the RSAS indicates a higher level of physical or social anhedonia, respectively. Cronbach's alpha coefficient of the current sample was 0.86 for the RPAS and 0.86 for the RSAS. As would be expected, the correlation between the two anhedonia scales was significantly correlated (r = 0.50, p < .001); however, the correlation was not so high as to suggest complete overlap.1
The criteria of sample selection were based on varying physical anhedonia while stabilizing social anhedonia, and vice versa (Chen et al., 2018). Specifically, the means and SDs of the distribution of the RPAS (M = 15.38, SD = 8.07) and RSAS (M = 10.85, SD = 6.58) scores were calculated, respectively. The SA group was composed of participants with high social (greater than M + 1.0 SD of the mean RSAS score) and normal physical (between M ± 0.5 SD of the mean RPAS score) anhedonia scores; the PA group with high physical (greater than M + 1.0 SD of the mean RPAS score) and normal social (between M ± 0.5 SD of the mean RSAS score) anhedonia scores; the CNT group with both normal social (between M ± 0.5 SD of the mean RSAS score) and physical (between M ± 0.5 SD of the mean RPAS score) anhedonia scores. Given that depression often coincides with anhedonia, Beck Depression Inventory II (BDI-II) was used to assess participants’ severity of depressive symptom (Beck et al., 1996). Participants also completed the Temporal Experience of Pleasure Scale (TEPS) to measure their experiences of pleasures derived from anticipation of prospective rewards and in-the-moment pleasure during reward consumption (Gard et al., 2006).
One participant from the CNT group was excluded from the final analysis due to an insufficient number of artifact-free trials (less than 65%), leaving 28 for the CNT group, 27 for the SA group, and 26 for the PA group. We used the Structured Clinical Interview for DSM-IV-Patient Edition to exclude participants with current psychiatric disorders including major depressive disorder and a history of head trauma and neurological illnesses. All participants were right-handed and had normal or corrected-to-normal visual acuity. Each received a payment for participation and provided written informed consent prior to the experiment. The study protocol was approved by a local Institutional Review Board in accordance with the Helsinki Declaration as revised 1989.
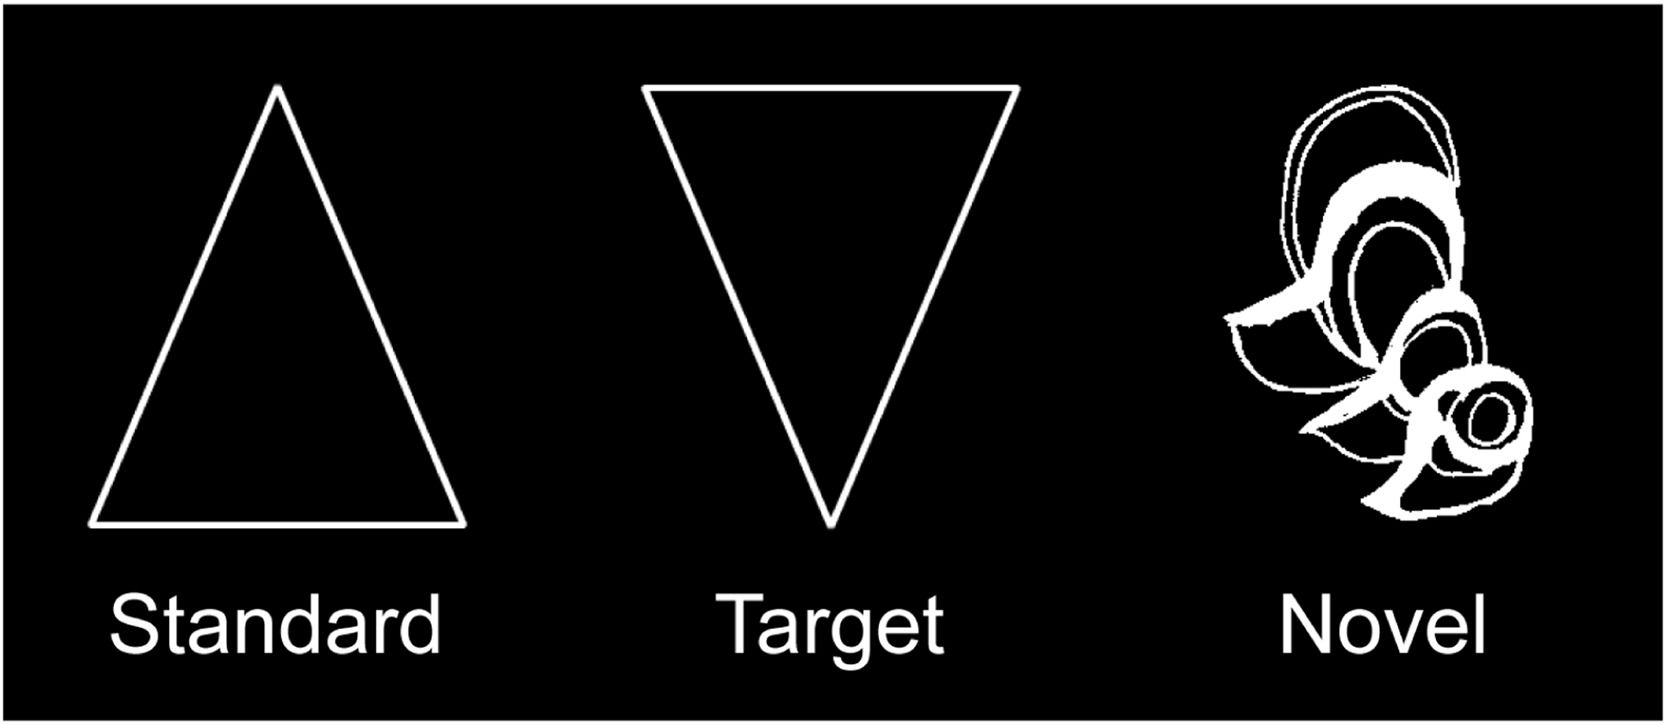
StimuliThe visual novelty oddball task was the same with our previous study (Zheng et al., 2010). As shown in Fig. 1, the standard (80%) and the target (10%) stimuli were a white triangle and an inverted triangle, respectively, whereas the novel stimuli (10%) consisted of 48 hard-to-categorize line drawings (i.e., impossible objects) from the collection of drawings that have been used in previous research (Kroll & Potter, 1984). Each novel stimulus was shown once during the experiment to keep its maximum novelty. All stimuli were presented within a white box located at the center of the screen. Participants viewed the box from a distance of 70 cm, at a visual angle of approximately 4.92 × 4.57°.
Procedure
The task included 480 trials divided into four blocks of 120 trials. Each block consisted of 96 standards, 12 targets and 12 novels, which were delivered pseudo-randomly with an additional constraint that no more than two target or novel stimuli were presented consecutively. On each trial, a stimulus was presented for 100 ms and was then followed by an intertrial interval jittered from 900 to 1100 ms. Participants were instructed to respond to the target stimuli by pressing a button with their index finger as rapidly and accurately as possible, ignoring both the standard and novel stimuli. Response fingers were reversed for half of the participants within each group. A practice block with standard and target stimuli only was provided before the experiment to ascertain that participants could discriminate targets from standards.
EEG recording and analysisEEG was recorded using a montage of 30 Ag/AgCl electrodes according to the 10/20 system. EEG signals were referenced to the left mastoid and rereferenced offline to the mean of the activity at the left and right mastoids. Horizontal electrooculogram (EOG) was recorded from a pair of electrodes placed lateral to the external canthi of each eye; vertical EOG from another pair of electrodes placed above and below the left eye. Both EEG and EOG signals were amplified via a Neuroscan NuAmps amplifier with a low-pass filter at 100 Hz in DC acquisition mode and digitized at a sampling rate of 500 Hz. Electrode impedance was kept below 5 KΩ throughout the experiment.
EEG data were preprocessed and analyzed using MATLAB 2020b and EEGLAB toolbox (Delorme & Makeig, 2004). EEG signals were linearly detrended and filtered with a high-pass at 0.1 Hz (roll-off 6 dB/octave). The filtered EEG data were segmented into epochs from −1500 to 2000 ms relative to stimulus onset, with the activity from −200 to 0 ms serving as the baseline. All epochs were screened for artifacts and then subjected into an infomax independent component analysis. Individual components were inspected, and blink components were removed. To remove additional artifacts, a semi-automated procedure was utilized to the time window of interest (−500 to 1000 ms) on all electrodes to remove epochs with a step more than 50 μV between sample points, a voltage difference exceeding 200 μV within an epoch, or a maximum voltage difference less than 0.5 μV within 100-ms intervals. The minimum number of artifact-free trials was 37 per condition. A preliminary analysis on the number of artifact-free trials revealed no significant effects involving group (ps > 0.05).
Based on visual inspection of grand-averaged ERP waveforms and topographic maps over the target and novelty conditions across groups, the N2 was scored as the mean voltage from 220 to 300 ms over frontal areas (F3/Fz/F4). The time window and electrode sites used to define the N2 are consistent with previous studies (Tarbi et al., 2011; Zheng et al., 2010). Because the N2 in response to novel and target stimuli might be overlapped by the N1/P2 potentials, difference waveforms (i.e., ΔN2) reflecting cognitive processing more purely were obtained by subtracting the standard ERPs from the novelty and the target ERPs, respectively, and then measured with the same parameters. A repeated-measures analysis of variance (ANOVA) was conducted for N2 data, with stimulus type (target, novelty) as a within-subjects factor and group (CNT, SA, PA) as a between-subjects factor. Greenhouse-Geisser epsilon correction was applied when the sphericity assumption was violated. Post-hoc comparisons were performed using the Bonferroni procedure.
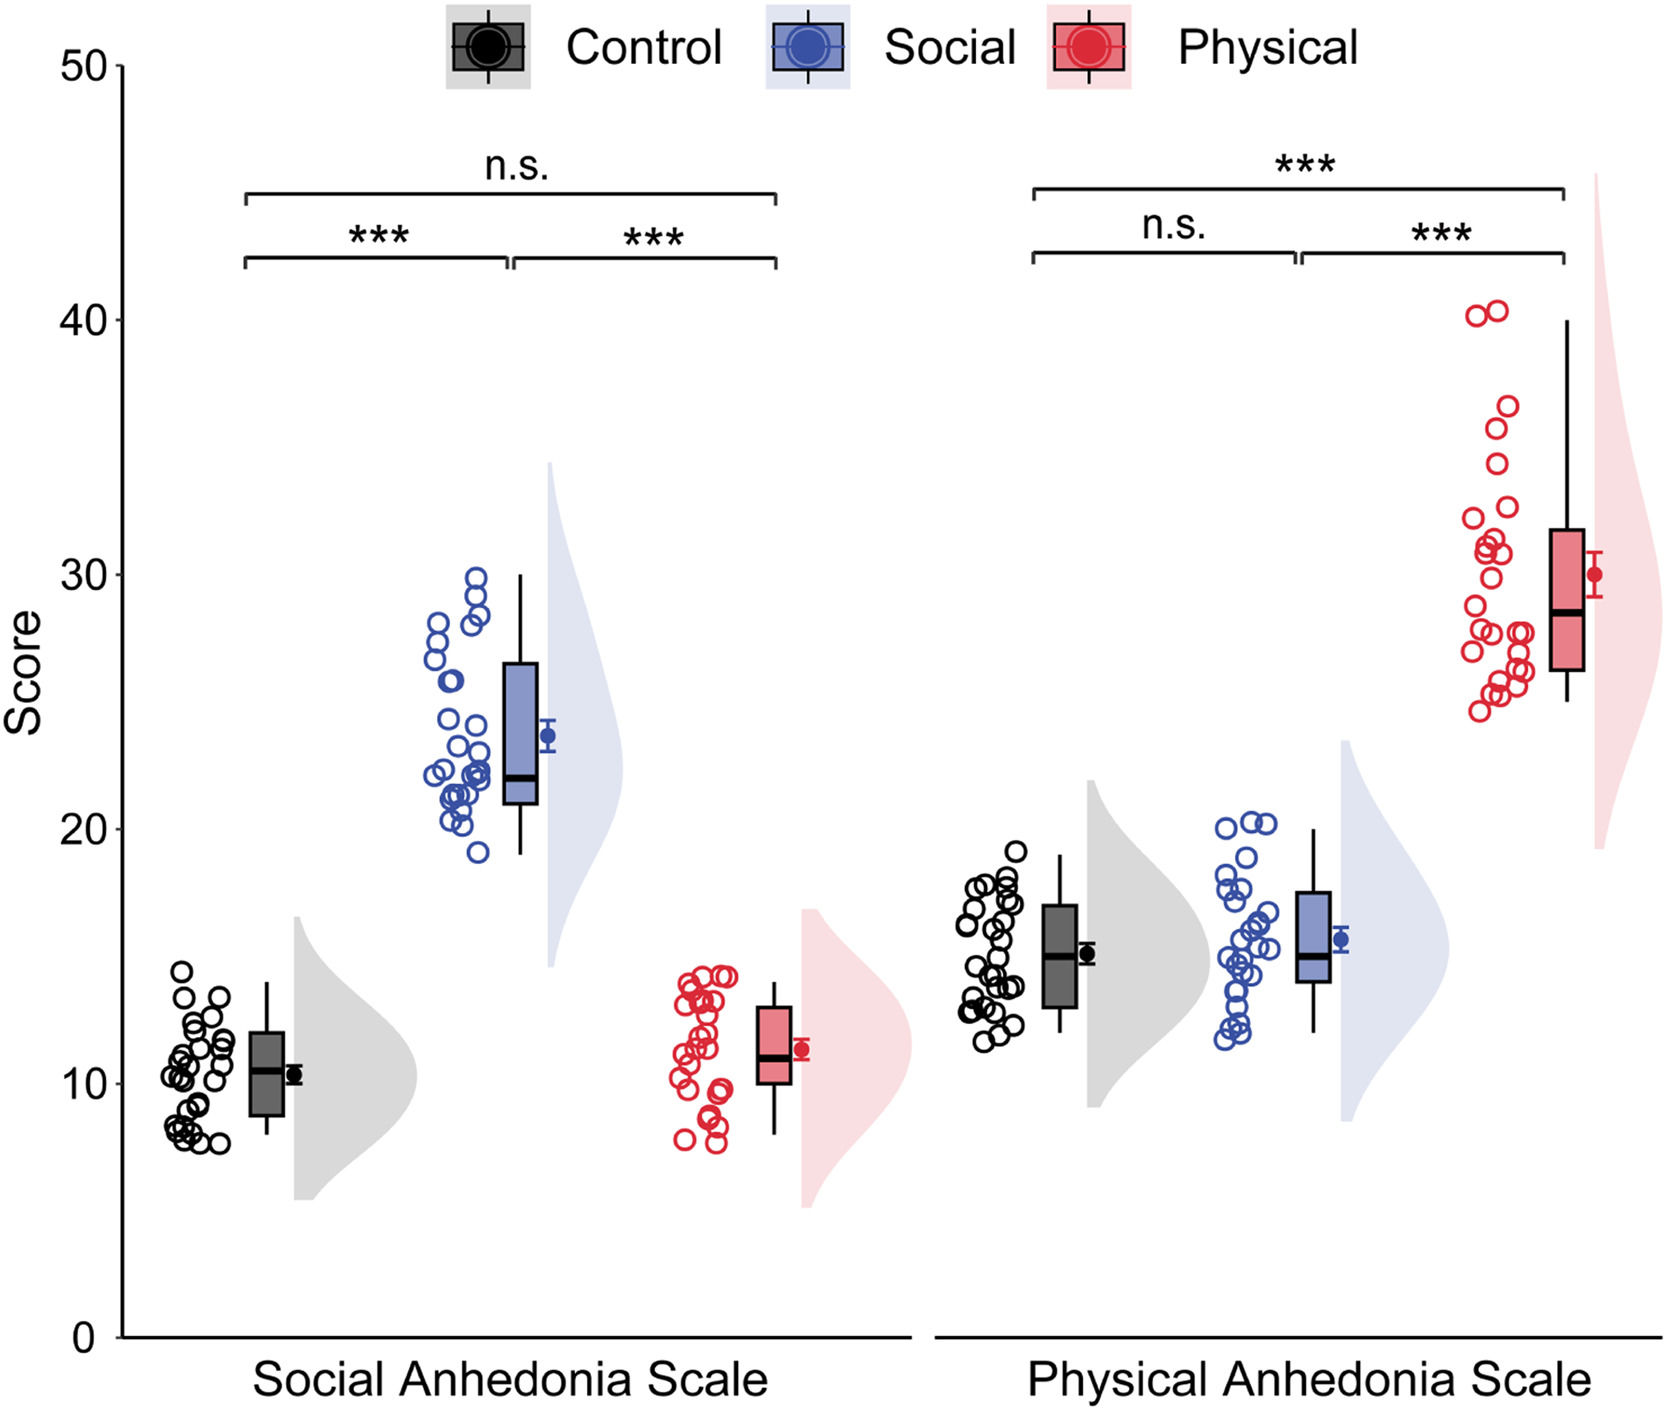
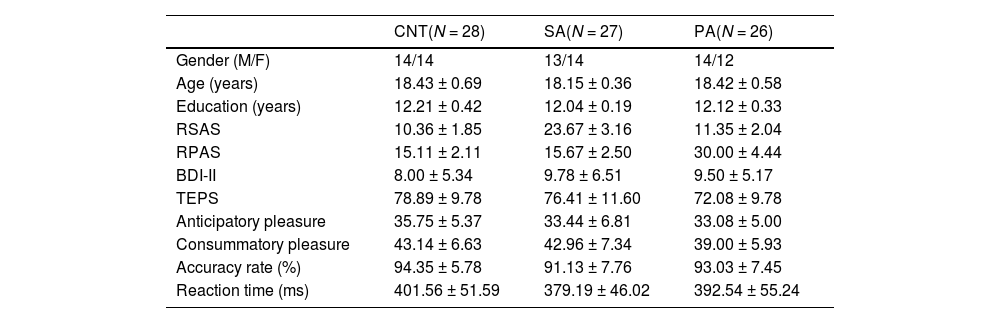
ResultsDemographic and behavioral dataTable 1 shows the demographic information and behavioral results for each group. The groups were matched on gender, age, and educational level (ps > 0.05). Groups showed similar behavioral performance for both accuracy rate, F(2, 78) = 1.45, p = .240, ηp² = 0.04, and reaction time, F(2, 78) = 1.33, p = .270, ηp² = 0.03. As shown in Fig. 2, the groups differed significantly on the RSAS scores, F(2, 78) = 254.50, p < .001, ηp² = 0.87. Bonferroni-corrected pairwise comparisons showed that the SA group had a significantly higher mean RSAS score than both the PA and CNT groups (ps < 0.001), with no difference between the latter two groups (p = .412). Similarly, the groups differed significantly on the RPAS scores, F(2, 78) = 190.14, p < .001, ηp² = 0.83. The PA group had a significantly higher mean RPAS score than other two groups (p < .001), with no differences between the SA and CNT groups (p > .9). The groups differed significantly on the consummatory dimension, F(2, 78) = 3.27, p = .043, ηp² = 0.08, but not the anticipatory dimension, F(2, 78) = 1.72, p = 0.186, ηp² = 0.04, of the TEPS. Bonferroni-corrected pairwise comparisons revealed that the PA group had a lower consummatory score than the CNT group at a trend level (p = .076), with no differences between other groups (ps > 0.10). Although depression often coincides with anhedonia, the groups displayed comparable BDI-II scores, F(2, 78) = 0.77, p = .465, ηp² = 0.02.
Demographic characteristics and behavioral data (M ± SD).
Note. CNT = heathy control; SA = social anhedonia; PA = physical anhedonia; RSAS = Revised Social Anhedonia Scale; RPAS = Revised Physical Anhedonia Scale; BDI-II = Beck Depression Inventory II; TEPS = Temporal Experience of Pleasure Scale.

Raincloud plots of social and physical anhedonia as a function of groups. The density plots depict the distributions, the boxplots represent the median and the 1st and 3rd quartiles, and the colored circles and dots indicate the mean for each participant and across participants in each group, respectively. Error bars represent the within-subject standard error of the mean. ⁎⁎⁎p〈 .001, n.s., p〉 .05. The p-values were corrected using the Bonferroni procedure.
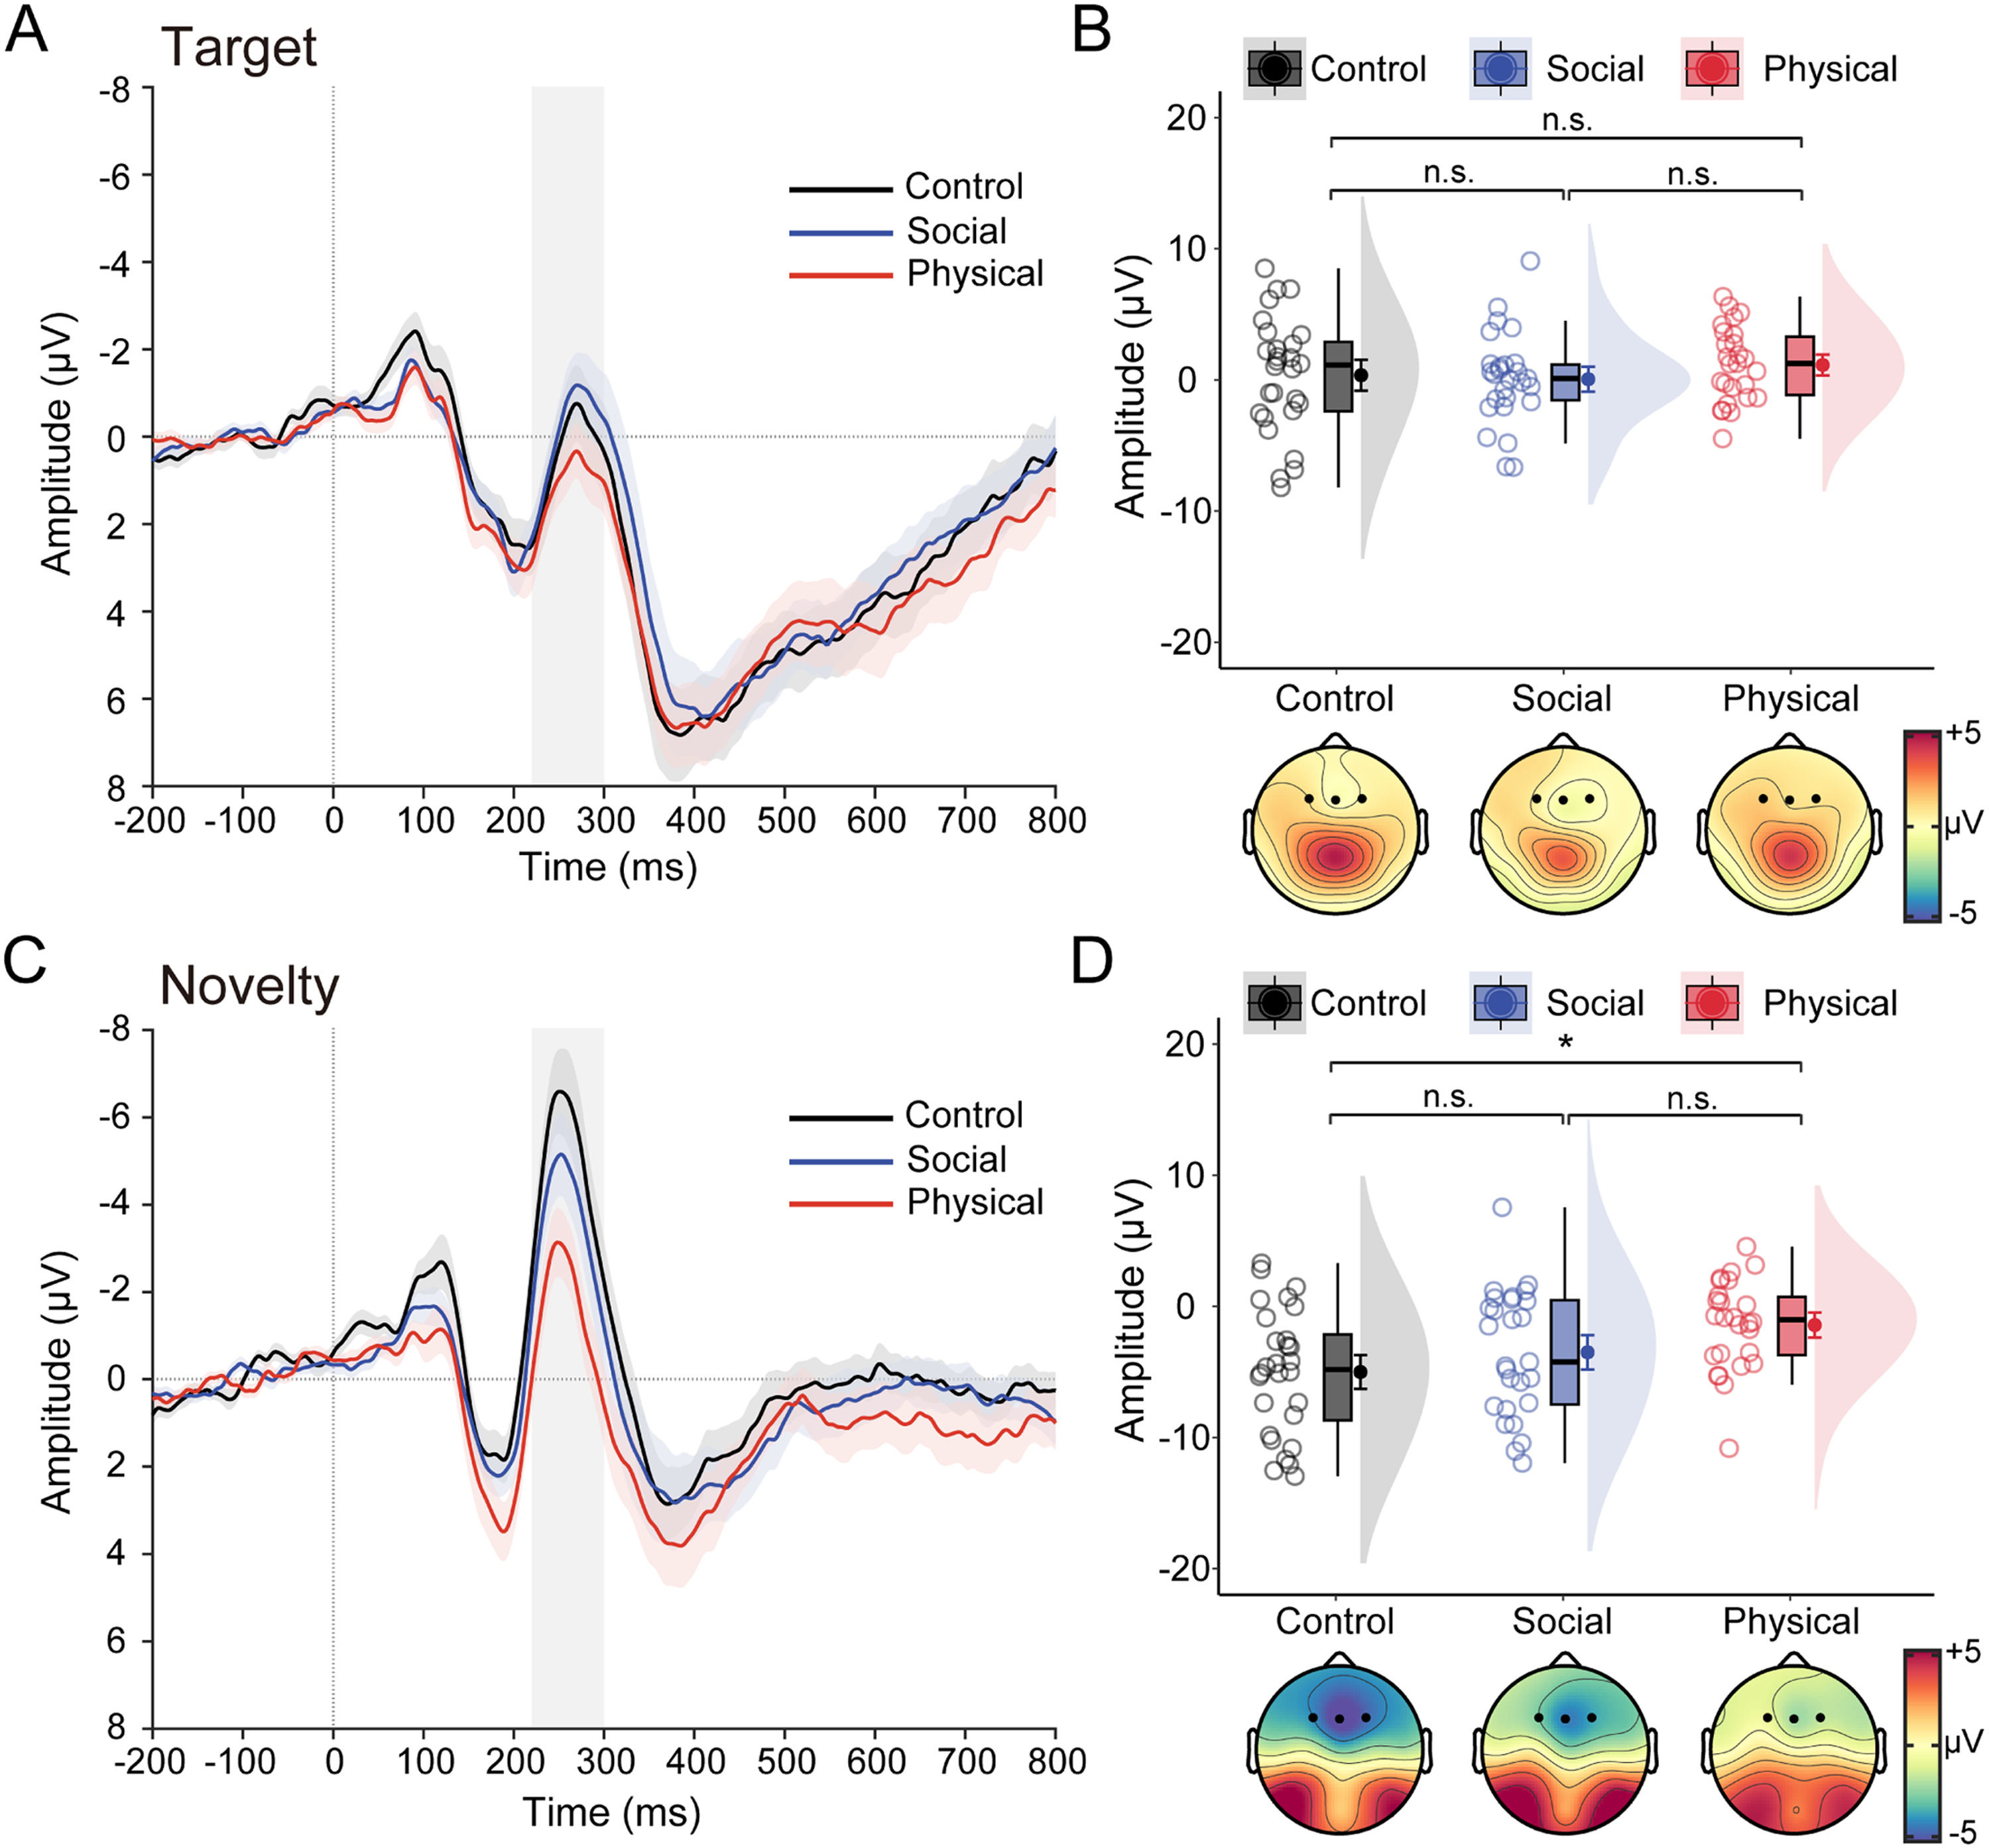
Fig. 3 illustrates the grand-averaged ERP waveforms and N2 data in response to target and novel stimuli as a function of group. The ANOVA performed on N2 data revealed a significant main effect of stimulus type, F(1, 78) = 84.09, p < .001, ηp2 = 0.52, with a more negative N2 for novel stimuli than target stimuli. Although the main group effect was marginally significant, F(2, 78) = 2.63, p = .079, ηp2 = 0.06, there was a significant interaction between stimulus type and group, F(2, 78) =3.88, p = 0.025, ηp2 = 0.09. Bonferroni-corrected pairwise comparisons showed the novelty N2 was significantly smaller for the PA group (−1.42 ± 3.44 μV) than for the CNT group (−5.00 ± 4.78 μV, p = .011), with no differences between the PA group and the SA group (−3.50 ± 4.81 μV, p = .272), and between the SA group and the CNT group (p = .628). In contrast, the target N2 was comparable between groups (0.36 ± 4.42 μV for the CNT group, 1.14 ± 2.85 μV for the PA group, and 0.06 ± 3.49 μV for the SA group; ps > 0.85). A similar pattern was found for the ΔN2 (see Table S1 in the Supplementary Materials).
 Grand-averaged ERP waveforms over frontal areas in response to target stimuli for healthy control, social anhedonia, physical anhedonia groups. (B) Raincloud plots of the mean amplitudes for the target N2 as a function of groups. (C–D) same as panels A–B, except that ERP waveforms represent an average in response to novel stimuli, and data points represent amplitude data for the novelty N2. For the ERP waveforms, colored shaded error bars indicate standard error of the mean across participants in each group, gray shaded vertical bars represent the time window used for N2 quantification (220–300 ms). Topographic maps show scalp distribution of the N2 as a function of groups. For the purpose of illustration, the averaged ERPs were filtered with a low-pass cutoff at 30 Hz. The density plots depict the distributions, the boxplots represent the median and the 1st and 3rd quartiles, and the colored circles and dots indicate the mean for each participant and across participants in each group, respectively. Error bars represent the within-subject standard error of the mean. *p〈 .05, n.s., p〉 .05. The p-values were corrected using the Bonferroni procedure.")
Task effects on the N2 data. (A) Grand-averaged ERP waveforms over frontal areas in response to target stimuli for healthy control, social anhedonia, physical anhedonia groups. (B) Raincloud plots of the mean amplitudes for the target N2 as a function of groups. (C–D) same as panels A–B, except that ERP waveforms represent an average in response to novel stimuli, and data points represent amplitude data for the novelty N2. For the ERP waveforms, colored shaded error bars indicate standard error of the mean across participants in each group, gray shaded vertical bars represent the time window used for N2 quantification (220–300 ms). Topographic maps show scalp distribution of the N2 as a function of groups. For the purpose of illustration, the averaged ERPs were filtered with a low-pass cutoff at 30 Hz. The density plots depict the distributions, the boxplots represent the median and the 1st and 3rd quartiles, and the colored circles and dots indicate the mean for each participant and across participants in each group, respectively. Error bars represent the within-subject standard error of the mean. *p〈 .05, n.s., p〉 .05. The p-values were corrected using the Bonferroni procedure.
Because anhedonia is usually accompanied by depression, the above ANOVA models were performed with the BDI-II score as a covariate (see Table S1 in the Supplementary Materials for detailed ANCOVA results). Results revealed that the main effect of stimulus type remained significant, and the main effect of group became significant. Importantly, the interaction of stimulus type and group remained significant. In addition, we observed a significant main effect of BDI, indicating that the N2 amplitude was more negative with increasing BDI scores. These control analyses indicated that the relationship between N2 and anhedonia was unaffected by depression in the current sample.
DiscussionIn this study, we examined electrophysiological correlates underlying mismatch detection in anhedonia using a non-clinical sample. Considering that physical and social anhedonia are typically correlated, we varied one type of anhedonia while stabilizing the other, resulting in a CNT group, an SA group, and a PA group. This manipulation allows us to dissociate the two subtypes of anhedonia at the electrophysiological level. We found that the PA group relative to the CNT group exhibited a reduced novelty N2. In contrast, the SA group as compared to the other two groups showed comparable N2 responses to both target and novel stimuli. Control analyses indicated that these patterns were unaffected by depression symptoms in the current sample. Our findings suggest a deficit in visual novelty detection that is selectively driven by physical anhedonia.
The novelty N2 in the visual modality is a reliable measure of mismatch detection between a stimulus and a perceptual template (Folstein & Van Petten, 2008). Previous research using similar novel stimuli has demonstrated that the novelty N2 reflects a relatively automatic process, as it is not influenced by task relevance (Chong et al., 2008) and direction of attention (Tarbi et al., 2011). In the current study, we found that the mismatch detection as indexed by the novelty N2 was significantly reduced in individuals with high physical anhedonia as compared to healthy controls. The finding cannot be explained in terms of response inhibition (i.e., making no responses to nontarget stimuli), as the novelty ΔN2, computed as the difference waveforms between the standard and the novelty ERPs, showed the same pattern as the novelty N2. One possible explanation for our finding is that anhedonia is associated with a deficit in the “general alerting system” (Suwazono et al., 2000). Specifically, when unfamiliar novel stimuli were inserted abruptly into the context of the standard/target (an upright vs an inverted triangle) discrimination, an orienting response would be elicited and further amplified by the unfamiliarity of the novel stimuli, that is, the deviation from participants’ long-term experience. Our finding is consistent with earlier studies reporting a orienting deficit in physical anhedonia as revealed by autonomic measures including electrodermal and cardiovascular responses (Simons, 1981) and a recent fMRI study finding that anhedonia was associated with threat-related neural networks during fear extinction including the bilateral amygdala, anterior insula, and dorsal anterior cingulate cortex (Young et al., 2021). Importantly, our finding goes beyond them by demonstrating that the orienting deficit occurs during the early detection stage as indexed by the novelty N2.
Our novelty N2 finding is inconsistent with previous studies reporting that individuals with high physical anhedonia exhibited an enhanced anterior N2 (Miller, 1986), which was driven by the N2b variation reflecting a deficit in voluntary allocation of attention but not by the MMN variation reflecting an automatic response to targets (Fernandes et al., 1999; Giese-Davis et al., 1993). Our results can be reconciled with these observations by considering the differences in the way in which mismatch or novelty is manipulated. In previous studies (Fernandes et al., 1999; Giese-Davis et al., 1993), mismatch has been manipulated as a change following homogeneous sequences of increasing length (e.g., the BBBBA), which is the context-based mismatch; that is, the deviation from a perceptual template based on shorter-term exposure to recurring standards. In contrast, novel stimuli in our study were highly unusual/unfamiliar line drawings (i.e., impossible objects), which is the stimulus-based mismatch, that is, the deviation from a perceptual template based on long-term experiences with ordinary objects. When these novel stimuli were inserted into the homogenous sequence of standards, both context-based and stimulus-based mismatch would be involved. Together with these previous studies, it is possible that anhedonia is driven by a deficit in the use of perceptual templates formed by short-term, or long-term experience, or both.
Previous studies have linked the attention-related N2 to anhedonia (Giese-Davis et al., 1993; Miller, 1986) but never compared between physical and social anhedonia. In the current study, we varied one type of anhedonia while stabilizing the other and found that the reduced novelty N2 was limited to participants high in physical anhedonia but not social anhedonia. To the best of our knowledge, our study is first to demonstrate that the attentional processing anomalies depend on the type of anhedonia. Our findings dovetail with the established cognitive and neural differences between physical anhedonia and social anhedonia (Gruzelier & Davis, 1995; Wang et al., 2014). For example, physical anhedonia is more associated with impairments in cognitive abilities (Kuha et al., 2011; Laurent et al., 2000), whereas social anhedonia is more related to deficits in processing of affective and social information (Moore et al., 2019; Nie et al., 2020; Zhang et al., 2020). Presumably, the absence of influence of social anhedonia on the novelty N2 is due to that the novel stimuli used in this study did not have any social significance. Nonetheless, it is necessary to take into account that anhedonia is not a unitary concept in future research.
There are several potential limitations to the current study. First, although we failed to find attentional deficits in social anhedonia, it is possible that individuals with social anhedonia will exhibit attentional impairments in the face of social stimuli. Second, we varied one type of anhedonia while stabilizing the other to decompose the construct of anhedonia. However, physical and social anhedonia are typically correlated with each other. Therefore, future research is needed to examine the joint influences of physical and social anhedonia on attention processing by including a double anhedonia group. Third, our sample is relatively health and young, and future research should extend our findings to more server clinical samples such as major depressive disorder and schizophrenia with negative symptoms.
In conclusion, our results indicate the abnormal novelty detection as indexed by the novelty N2 in anhedonia. This impairment is limited to physical instead of social anhedonia and is independent from depression symptoms. While emotional and motivational deficits are certainly important elements underlying anhedonia, our findings highlight that dysfunction in involuntary attention such as novelty detection may play a mediating role in the development, maintenance, and consequences of anhedonia-related psychopathology such as depression and schizophrenia.
This work was supported by the Educational Department Foundation of Liaoning Province in China (LR2020007) and the National Natural Science Foundation of China (31971027). The authors thank Mengling Du and Pengjie Lu for help with data collection and Menglin Wu for help with figure preparation. All authors have declared that no competing interests exist.
