


In the early days of the pandemic, clinical COVID-19 biomarkers were investigated to predict mortality.1 Yan et al., for instance, proposed a straightforward decision tree with three variables: Lactic Dehydrogenase (LDH), high-sensitivity C-Reactive Protein (hs-CRP), and lymphocyte percentage. They claimed to obtain more than 90% accuracy on a test set. Although it is an interesting approach, Yan et al. considered the problem a classification task (dead vs. alive), which may not be the proper way to deal with continuous time-to-event data.2–4 Moreover, machine-learning-based assessment is pruned to over-optimistic results using small sampling for training. In addition, it has been shown that their model has limited performance on external datasets.5–7 These two limitations are possibly due to data overfitting.
Therefore, the authors performed time-to-event analyses using the original dataset to find a proper predictive potential for the investigated biomarkers. The authors’ evaluation aimed to optimize the clinical variables previously modeled and discover other biomarkers with prognostic value. By opposing the original strategy, the authors also focused on identifying biomarkers for different sub-populations, according to patient aging and hospitalization time.
Original data is publicly available.1 The dataset comprised demographics data of age (varying 18–95, averaging 58.8 ± 16.5 years old) and sex (224 men, 151 women), along with the results of 74 blood tests in different hospitalization times. The variables obtained for each patient is listed as follows: 2019-ncov nucleic acid detection, activation of partial thromboplastin time, albumin, alkaline phosphatase, amino-terminal brain natriuretic peptide precursor, antithrombin, aspartate aminotransferase, basophil count, basophil percentage, calcium, corrected calcium, creatinine, d-d dimer, direct bilirubin, egfr, eosinophil count, eosinophils percentage, esr, ferritin, fibrin degradation products, fibrinogen, globulin, glucose, glutamic-pyruvic transaminase, hbsag, hco3-, hcv antibody quantification, hematocrit, hemoglobin, hiv antibody quantification, hypersensitive cardiac troponini, hypersensitive c-reactive protein, indirect bilirubin, interleukin 10, interleukin 1β, interleukin 2 receptor, interleukin 6, interleukin 8, international standard ratio, lactate dehydrogenase, lymphocyte count, lymphocyte percentage, mean corpuscular hemoglobin, mean corpuscular hemoglobin concentration, mean corpuscular volume, mean platelet volume, monocytes count, monocytes percentage, neutrophils count, neutrophils percentage, ph value, platelet count, platelet large cell ratio, plt distribution width, procalcitonin, prothrombin activity, prothrombin time, quantification of treponema pallidum antibodies, rbc distribution width sd, red blood cell count, red blood cell distribution width, serum chloride, serum potassium, serum sodium, thrombin time, thrombocytocrit, total bilirubin, total cholesterol, total protein, tumor necrosis factorα, urea, uric acid, white blood cell count, and γ-glutamyl transpeptidase.
The authors split the dataset into discovery and validation subsets to perform a robust assessment and validate the results. The thresholds identified in the discovery set were then applied in the validation set to confirm further performance. Patient risk groups were stratified according to the variables’ median.3,4 The log-rank test assessed the difference between Kaplan-Meier curves and Cox proportional hazards regression models. R v4.1.0 packages of survival v3.2.3 and survminer v0.4.7 performed statistical analyses, with p < 0.05 considered significant.
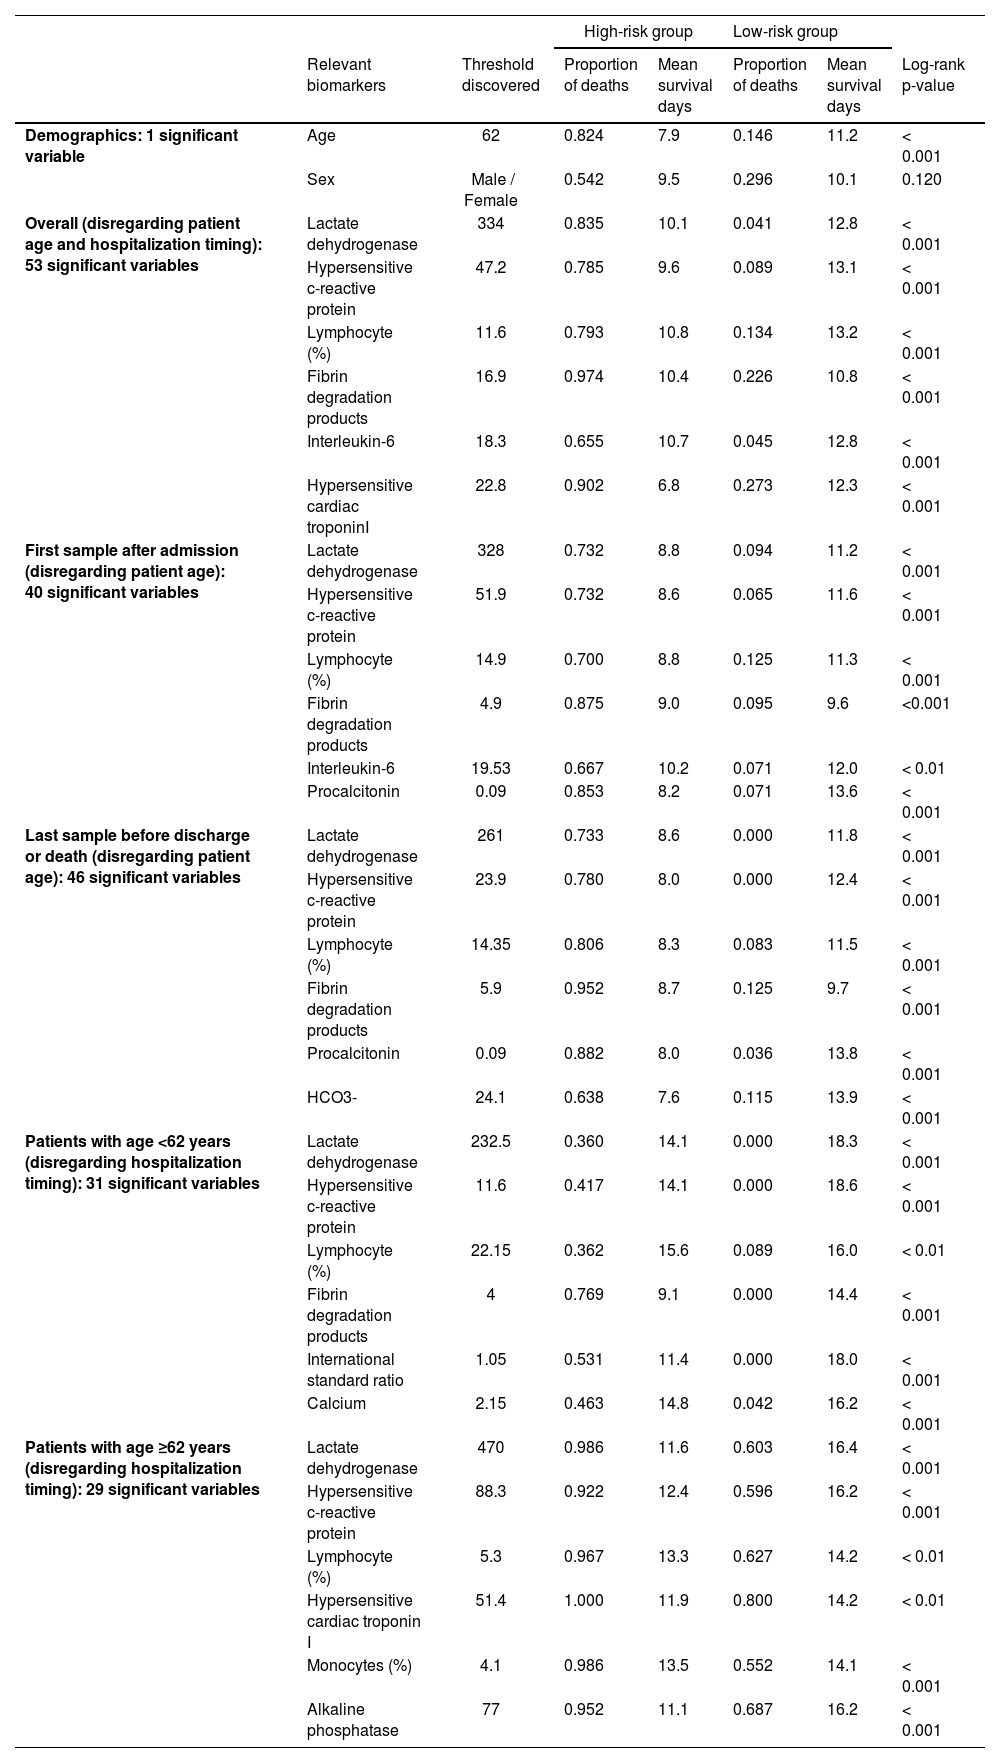
As expected, the older the patient is, the worst is the prognosis;8,9 the threshold of 62 years obtained significant difference on survival curves (Fig. 1a). The overall assessment disregarding patient age and hospitalization timing found predictive value in 53 variables, including LDH and hs-CRP (Fig. 1b–c). Moreover, other biomarkers yielded relevant information on COVID-19 prognostication (Table 1). For instance, high-risk groups stratified by fibrin degradation products presented a 97% likelihood of death and a Hazard Ratio (HR) of 4.26 (95% Confidence Interval [95% CI]: 1.88–9.64); and elevated Interleukin-6 (IL-6) associated with 65% likelihood of death and HR of 18.20 (95% CI: 2.42-136.54).
 age, (b) Lactic Dehydrogenase (LDH), (c) high-sensitivity C-Reactive Protein (hs-CRP), (d) LDH combined with hs-CRP.")
Discovered biomarkers according to the patient age and hospitalization time.
Furthermore, LDH and hs-CRP combined presented complementary predictive potential in multivariate assessment (Fig. 1d). With both biomarkers’ values elevated, patients showed a likelihood of death of 87%, the mean survival time of 9.5 days, and HRs of 8.19 (95% CI: 2.27–29.52) and 3.90 (95% CI: 1.41–10.72). Conversely, when either LDH or hs-CRP yielded low value, potentially indicating lower risk, the age determined the worse prognosis in the multivariate signature (p<0.001), resulting in a likelihood of death of 72% and HR of 7.01 (95% CI: 3.10–15.84) for the elderly patients.
Results confirmed poor short-term prognosis to abnormal levels of some indicators, such as LDH,1,9-11 CRP,1,8-11 lymphocytes,1,8-10 IL-6,12 and procalcitonin.11 These findings could provide insights into COVID-19 research, such as key levels of fibrin degradation products, which are directly associated with the Dimerized plasmin fragment D and could indicate active coagulation and thrombosis.9-11
Yan et al. had already mentioned that lymphocytes might serve as a potential therapeutic target.1 Still, the authors highlight the role of IL-6, a cytokine that induces inflammatory response and has prognostic value. Although IL-6 blockade is not the standard strategy for COVID-19 treatment, interleukin-6 remains the best available biomarker for severity assessment and still holds great potential for targeted therapy.12
In this work, the authors have identified relevant biomarkers that are fully available in medical practice and be a mainstay for the clinical evaluation of COVID-19. These biomarkers correlated with short-term outcomes and could support the management of the disease with early interventions, ultimately leading to better endpoints such as decreased deterioration and mortality. Future works include a prospective evaluation to increase robustness and the assessment across different geographic populations, as each region has its genomic specificity.