


Little is known about the materials used in the manufacture of red window glass in the 19th and the first decade of the 20th century. Here, we have studied fragments from eight Spanish glasses from the 19th and 20th centuries. The red glasses consist of a single layer of red glass on a colourless glass substrate. The chemical composition, oxidation state, nature of colourants and crystalline precipitates were determined by a selection of microanalytical techniques. In the study, we have found that the red colour of the glass is due to the presence of Cu0 nanoparticles, the red glass layer has lower calcium content than the substrate glasses, which we found favours copper being present in the glass predominantly in Cu+. They also contain tin and iron while lead, described in historical and modern documentation, was absent. Tin must have been added to the glass as a Sn2+ compound and acted as a reducing agent for copper. Iron is also a well-known reducing agent, but does not act as such in the red glasses studied here. However, it may have facilitated the reduction of copper to Cu0 by promoting its incorporation into the glass as Cu+ rather than Cu2+.
Poco se sabe sobre los materiales utilizados en la fabricación de vidrios rojos planos en el siglo xix y primera década del xx, por ello se han estudiado ocho fragmentos españoles de la época. Todos ellos están formados por una sola capa de vidrio rojo sobre un sustrato de vidrio incoloro. La composición química, el estado de oxidación, la naturaleza de los colorantes y los precipitados cristalinos se han determinado mediante una selección de técnicas microanalíticas. Hemos encontrado que la capa de vidrio rojo contiene nanopartículas de Cu0, y que tiene un menor contenido de calcio menor que el vidrio sustrato, lo cual favorece que el cobre esté en el vidrio predominantemente como Cu+. Tal y como está descrito en la documentación histórica y moderna contienen estaño y hierro, pero no se ha verificado la presencia de plomo. El estaño se agregó al vidrio como un compuesto Sn2+ y actuó como agente reductor del cobre. El hierro a pesar de ser un agente reductor, no actúa como tal en los vidrios rojos estudiados. Sin embargo, su presencia podría facilitar la reducción del cobre a Cu0 al promover su incorporación al vidrio como Cu+ en lugar de Cu2+.
Red copper glasses have been used in stained-glass windows in Europe since medieval times. The red colour is due to the presence of a low fraction (between 0.02% and 0.05% of the volume) of small metallic copper nanoparticles (below 50nm in size) [1–6]; larger precipitates give a livery red colour, and the absorption and scattering of light by the particles dramatically reduces the transparency of the glasses [7,8].
Due to the low solubility of metals in a silicate melt, copper is mainly incorporated in its oxidized forms Cu+ and Cu2+. Subsequently, copper must be reduced to the metallic state, as nanoparticles, while avoiding the precipitation of other copper compounds such as cuprite (Cu2O) or the development of large Cu0 particles (livery red). Different strategies have been used throughout history, but mostly reducing agents were added to the melt [1,2,6,9]. To avoid the excess opacity due to the scattering of copper nanoparticles, the red glass was applied as only one or few layers on a substrate colourless glass and blown together.
Between the 13th and the 16th centuries, red glass was produced mainly in workshops in central Europe, and they exported the red glass throughout Europe. Recent analytical studies of red window glass from the 12th to the 17th century, including striated and sandwich types, revealed that striated glass was obtained by superimposing layers of oxidised copper-rich glass and reduced iron-rich glass; the interdiffusion of iron and copper across the glass boundary resulted in the oxidation of iron and reduction of copper and precipitation of metallic copper nanoparticles [6]. In contrast, sulphur appears to be the key element responsible for the development of the red colour of sandwich glass [10]. The oxidation of S2− into S6+ induced the corresponding reduction of copper to the metallic state and precipitation of metallic copper nanoparticles.
The manufacture of red glass was kept secret until the 17th century, when the decline in coloured glass production and the fear of loss of knowledge led to a proliferation of various treatises. Neri wrote the first well-documented treatise on glass making, L’art vetraria (1612) [11] and later Kunckel's Ars Vitraria Experimentalis[12] and Pierre Le Vieil L’Art de la Peinture sur verre et de la Vitrerie[13], mainly based on Neri's work. The process of red glass production described involves mixing a crystal frit (soda rich mixed alkali glass) with copper and reducing agents. Two main recipes are described, one that incorporates tin and lead calx (an ash of molten lead and/or tin calcined at about 600°C), burned iron or iron treated with vinegar, aqua fortis and aqua regia and calcined cream of tartar (K2CO3·1.5H2O) to burned copper, and a second type in which sulphur is also added. Recently, ignoring some inconsistencies in the chemical composition of the glass, red glass has been successfully replicated following Kunkel's recipes [14], firing the batch mixtures up to 1100°C. A document written by Juan Danis in 1676, Tratado de la fábrica del vidrio[15], describes the need to reheat the glass after cooling in order to obtain the red colour.
Although the use of tin and lead calx is described already in these early treatises, their use has only been determined in the production of small volume objects between the 15th and the 18th centuries [16,17]. The colour of the glasses is red-brown and their composition is of soda-lime type, and contain iron (2–6% Fe2O3), lead (0.2–5.5% PbO) and tin (0.1–4.7% SnO2) and also often antimony (0.2–1.1% Sb2O3). However, most of them were used to decorate glass objects rather than to colour the whole object, and none of them is flat glass for window use.
An 18th century treatise [18] describing the production of stain glass from the cathedral of Toledo, the addition of some tin-lead calx (3.8%PbO+SnO) to the red glass is mentioned. Nevertheless, the analysis of a red fragment from the cathedral of Toledo did not found either lead or tin.
Modern descriptions indicate the preferable use of a lead potash frit although a soda-lime frit with some boron was also used. Copper oxide, tin oxide and/or antimony oxide [9] or tin metal and, in some cases magnetite, were added [1] to the glass frit and fired to the melting temperature, then cooled and reheated between 500°C and 650°C to develop the red colour. Higher temperatures or longer firings may result in the loss of the red colour.
Little or nothing is known about the materials used in the manufacture of red window glass of the 18th, 19th and early 20th centuries. The glasses consist of a single thin surface layer of red glass on a colourless glass substrate, a type commonly known as flashed glass. In this work, the chemical composition, oxidation state and nature of colourants and the crystalline precipitates were determined in a series of eight Spanish historical samples, by combining a selection of microanalytical techniques: laser ablation inductively coupled plasma mass spectroscopy (LA-ICP-MS), field emission scanning electron microscopy (FE-SEM), microprobe, ultraviolet and visible spectroscopy (UV–Vis) and micro X-ray diffraction (micro-XRD) and micro X-ray absorption spectroscopy (micro-XAS) with synchrotron light.
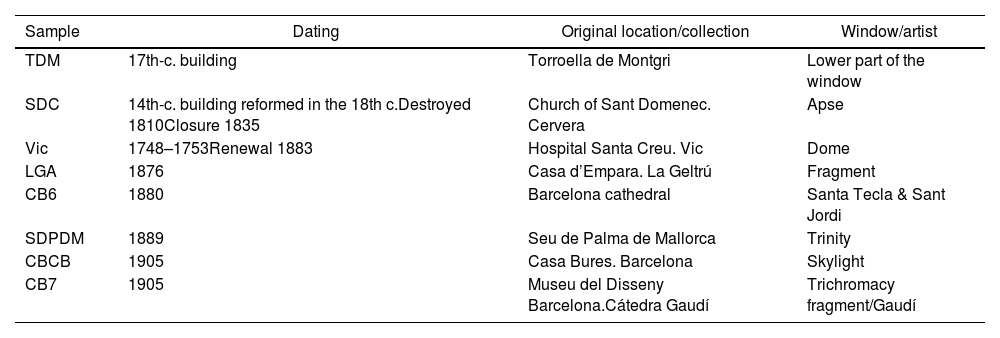
Materials and experimental methodsEight fragments of red glass were collected and analysed, details are shown in Table 1. The samples were selected from historic buildings, mainly from Catalonia, for which there is some documentation on the production and later restoration of the stained-glass windows.
Sample information. Dating of the buildings is indicated. However, after analysing the glass fragments TDM and SDC we have to date them in the 19th century (see text for more details).
| Sample | Dating | Original location/collection | Window/artist |
|---|---|---|---|
| TDM | 17th-c. building | Torroella de Montgri | Lower part of the window |
| SDC | 14th-c. building reformed in the 18th c.Destroyed 1810Closure 1835 | Church of Sant Domenec. Cervera | Apse |
| Vic | 1748–1753Renewal 1883 | Hospital Santa Creu. Vic | Dome |
| LGA | 1876 | Casa d’Empara. La Geltrú | Fragment |
| CB6 | 1880 | Barcelona cathedral | Santa Tecla & Sant Jordi |
| SDPDM | 1889 | Seu de Palma de Mallorca | Trinity |
| CBCB | 1905 | Casa Bures. Barcelona | Skylight |
| CB7 | 1905 | Museu del Disseny Barcelona.Cátedra Gaudí | Trichromacy fragment/Gaudí |
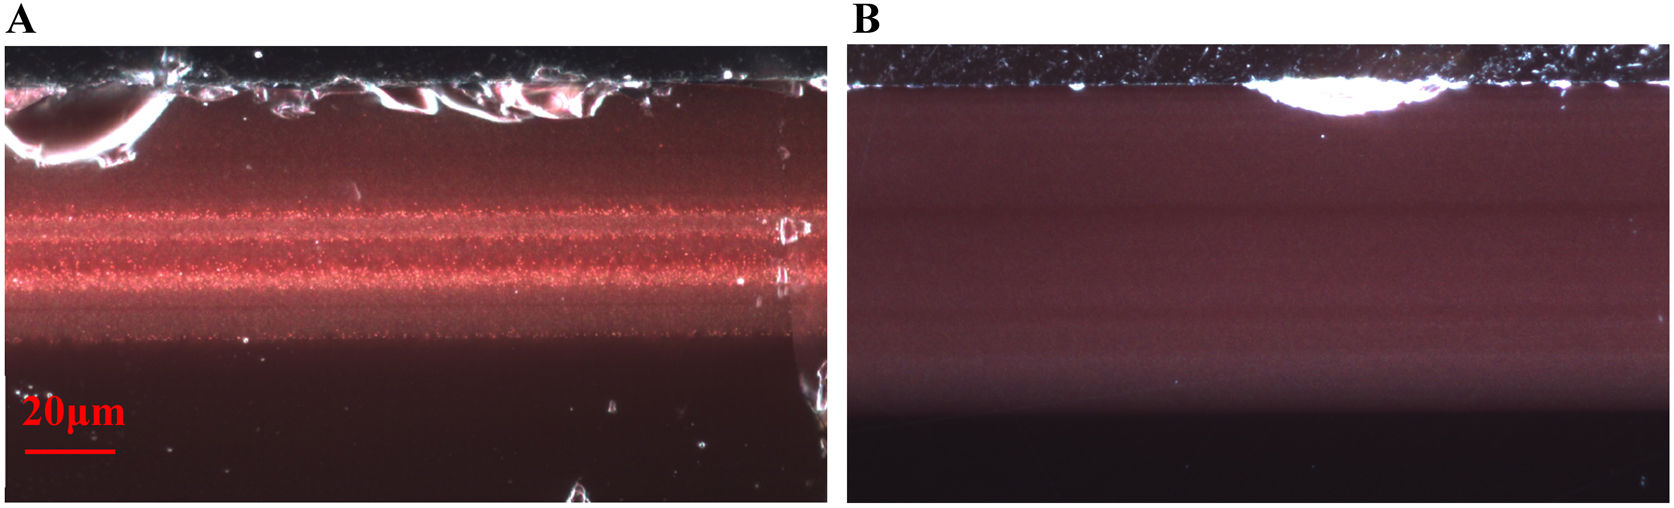
Cross sections of the samples were obtained by embedding fragments in epoxy resin and polishing blocks down to 1μm grade with a diamond paste. The polished sections were examined in reflected (Fig. 1) and transmitted light with an optical microscope (OM) Nikon Eclipse LV100D equipped with a camera Infinity 1.3C.
 TDM; (B) CB6 showing the presence of metallic copper nanoparticles.")
The cross sections were coated with a carbon layer (about 20nm thick) and were examined in a crossbeam workstation (Zeiss Neon 40) equipped with scanning electron microscopy (SEM) GEMINI (Shottky FE) column with attached EDS (Ultim EDS Detector, Oxford Instruments), operated at 20kV accelerating voltage with 1.1nm lateral resolution, 20nA current. Back Scattered Electron (BSE) images of the nanostructures were obtained at 20kV acceleration voltage. A Focus Ion Beam (FIB, Ga ions, acceleration voltage 30kV) was used to polish the surface and to obtain high resolution secondary electron images (5kV) of the nanoparticles when they were too small to be observed directly on the mechanically polished cross section.
The chemical composition of the glasses was measured by LA-ICP-MS. The instrumentation used consists of a Resonetics M50E, ablation device, equipped with an excimer (ArF) laser working at 193nm coupled with a Thermo Fisher Scientific ELEMENT XR mass spectrometer (details on the analytical methods are found in B. Gratuze [19]). The glasses were measured using an Electron Microprobe JEOL JXA-8230 from Scientific and Technological Centers from the University of Barcelona with five Wavelength-Dispersive X-ray Spectroscopy (WDS) spectrometers (probe current of 15nA and calibration was performed using mineral and glass standards), to determine some elements not measured by LA-ICP-MS such as sulphur.
The nature of the particles present in the red glasses was determined by synchrotron-based micro-XRD. The micro-XRD patterns were obtained from thin cross sections (about 200μm) cut from small fragments of the samples included in epoxy resin using a low speed diamond saw. Synchrotron micro-XRD patterns were collected in the Materials Science and Powder Diffraction beamline (MSPD BL04) [20], at the ALBA Synchrotron Light (Cerdanyola, Spain) in transmission geometry, using 0.4246Å wavelength (29.2keV), a 20μm×20μm spot size, and a CCD camera, SX165 (Rayonix, L.L.C., Evanston, IL) detector. The 2D images have been integrated using the d2Dplot program [21]. The XRD data has been identified using the Powder Diffraction File Database (PDF) from the International Centre for Diffraction Data (ICS) (ICCD, https://www.icdd.com).
Ultraviolet–Visible (UV–Vis) diffuse absorption measurements were obtained in transmission mode using a double beam spectrophotometer (Shimadzu 2700) recorded between 200nm and 800nm, and NIR transmittance measurements using a double beam spectrophotometer (Shimadzu 3600) recorded between 800nm and 3000nm.
Micro-XAS data of Fe, Cu at the K-edge and Sn at the L3-edge were acquired at the ID21 beamline, ESRF [22]. X-rays were produced with an undulator, and their energy was adjusted using a Si (111) double crystal monochromator. For the analysis of glass samples, the beam was focused to 0.3μm×0.9μm (v×h) using a Kirkpatrick Baez mirror system. The samples were mounted vertically, at an angle of 62° with respect to the incident beam. X-rays was detected using a single energy-dispersive silicon drift detector (SGX, 80mm2) at 28° of the sample surface. XRF maps were first acquired at 9.5keV, over 2D regions in order to locate elements (especially Cu, Fe and Sn) and identify regions of interest. The monochromator was calibrated using the first inflection point of the copper, iron and tin metal foils (maximum of the first derivative at 8979eV for Cu foil, 7112eV for Fe foil and 3929eV for Sn foil) using Athena software [23]. Spectra of some reference powders (Cu2S, CuO, Cu2O, Fe2O3, Fe3O4, SnO and SnO2) spread on a piece of tape and covered with an ultralene foil with an unfocussed beam (0.3mm×0.3mm) in transmission mode were also acquired.
The copper speciation was obtained from the analyses of the Cu K-edge XAS spectra. Copper is either dissolved in the glass in the form Cu+ and Cu2+, or precipitated as Cu0 nanoparticles EXAFS fitting was carried out with Artemis software. The spectrum is a linear combination of model compounds each weighted by each compound fraction with Artemis software [23]. Nevertheless, the lack of any longer-range order consistent with copper ions dissolved in the glass produces smooth EXAFS oscillations, making it difficult to fit more than the first shell. The first CuO and CuCu shells were fitted taking as model compounds those of Cu2O, CuO and metal Cu, each weighted by a compound fraction.
The pre-edge feature of the Fe K-edge absorption is particularly sensitive to the valence state and local geometry. The weighted peak position (centroid) is known to shift to higher energy as the ratio of ferric to ferrous iron increases [24] and the area gives an estimation of the coordination state. Based on the centroid, the oxidation state of iron in glasses can be calculated using the expression given in A. Fiege et al. [25]. The Fe K-edge XANES region has also been fitted using a Python code [26] developed following procedures described in literatures [24,27,28]. Considering that the data had standard resolution (ΔE=0.5eV), the fitting incorporated some restrictions, the peaks are set Gaussian, the width fixed to 2.1eV.
Tin speciation was obtained from the analysis of the Sn L-edge spectra to avoid the rather high energy required to collect the K-edge information (26,200eV). Moreover, the Sn L3-edge has been selected considering the low fluorescence yield of the L1 and L2-edges. A recent study [29] has shown that the L-edge is better than the K-edge for the determination of the oxidation state of tin in glasses. The absorption features of Sn L-edge absorption spectra of SnO, and SnO2 have been assigned to corresponding electronic structures [30]. The L3,2-edge white line corresponds to the transition from filled 2p3/2, 2p1/2 Sn states to empty 5d5/2, 5d3/2 Sn orbitals and the two fine structures appearing before the L3,2 white lines were assigned to the 2p3/2→5s1/2 transitions due to the s–p hybridization. The Sn L-edge spectra corresponding to Sn2+ and Sn4+ in glass are similar to those of crystalline SnO and SnO2, but show smoother and broader absorption peaks [29].
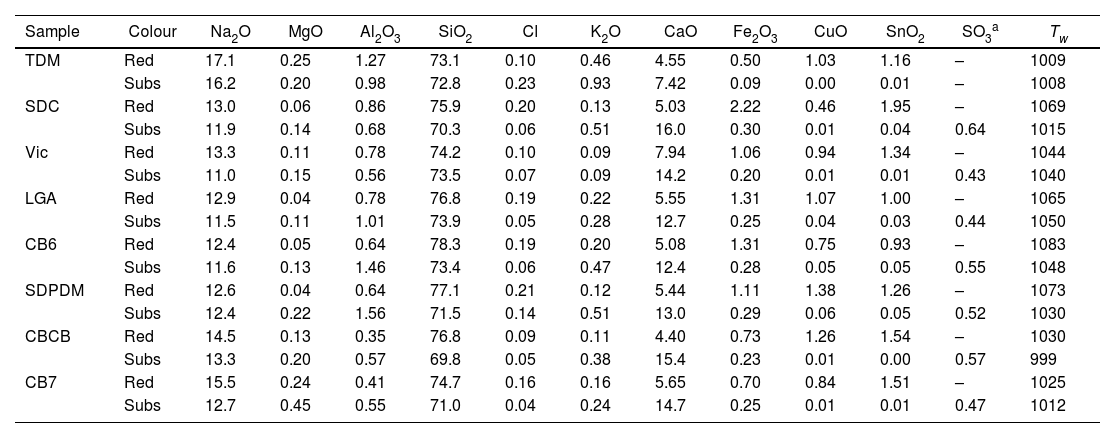
ResultsTable 2 shows the chemical composition of the glasses, red glass layer and colourless substrate glass. All the colourless substrate glasses are of the soda-lime type (10–15% Na2O and CaO); they contain only about 0.5% SO2, 0.1% Cl and 50ppm P, indicating the use of synthetic soda (Na2CO3) in their production, which replaced plant ashes as a source of sodium. Synthetic soda was invented by the French chemist Nicholas Leblanc in 1791, an innovative process for making soda ash from salt and calcium carbonate, which was first used in the glass industry in 1835 [31,32]. This process was highly polluting (it produced hydrochloric acid) and was later replaced by the Solvay process patented in 1861 by Ernest and Alfred Solvay, which used salt, calcium carbonate, ammonia and charcoal [33]. In addition, the substrate glasses TDM, SDC and Vic contain relatively high amounts of arsenic (between 0.1 and 0.2% As2O3). The use of As2O3 as a refining agent was discovered a few years after the invention of Leblanc's salts [34]. Arsenic oxide was replaced by saltpetre (KNO3) around 1870. Thermal decomposition of KNO3 at 400°C produces KNO2 and O2 (g) [35] which favours the release of bubbles. Consequently, SDC and Vic should be dated before 1870, LGA, CB6 and SDPDM after 1870. TDM contains many impurities, Mn, Zn, As, Sb, Ba, Pb, which seems to indicate a glass of low quality and probably an earlier date. Finally, CB7 and CBCB contain very few impurities, no more than a few dozen ppm of P, Cl, Mn, Zn, As, Sb, Ba, Pb. This is consistent with the dating of the glasses to the first decades of the 20th century. The working temperature (temperature required to blow the glass, Tw) of the 19th-century glasses is about 1050°C, while for the 20th-century glasses it is slightly lower, about 1010°C.
Major, minor and trace elements measured by LA-ICP-MS.
| Sample | Colour | Na2O | MgO | Al2O3 | SiO2 | Cl | K2O | CaO | Fe2O3 | CuO | SnO2 | SO3a | Tw |
|---|---|---|---|---|---|---|---|---|---|---|---|---|---|
| TDM | Red | 17.1 | 0.25 | 1.27 | 73.1 | 0.10 | 0.46 | 4.55 | 0.50 | 1.03 | 1.16 | – | 1009 |
| Subs | 16.2 | 0.20 | 0.98 | 72.8 | 0.23 | 0.93 | 7.42 | 0.09 | 0.00 | 0.01 | – | 1008 | |
| SDC | Red | 13.0 | 0.06 | 0.86 | 75.9 | 0.20 | 0.13 | 5.03 | 2.22 | 0.46 | 1.95 | – | 1069 |
| Subs | 11.9 | 0.14 | 0.68 | 70.3 | 0.06 | 0.51 | 16.0 | 0.30 | 0.01 | 0.04 | 0.64 | 1015 | |
| Vic | Red | 13.3 | 0.11 | 0.78 | 74.2 | 0.10 | 0.09 | 7.94 | 1.06 | 0.94 | 1.34 | – | 1044 |
| Subs | 11.0 | 0.15 | 0.56 | 73.5 | 0.07 | 0.09 | 14.2 | 0.20 | 0.01 | 0.01 | 0.43 | 1040 | |
| LGA | Red | 12.9 | 0.04 | 0.78 | 76.8 | 0.19 | 0.22 | 5.55 | 1.31 | 1.07 | 1.00 | – | 1065 |
| Subs | 11.5 | 0.11 | 1.01 | 73.9 | 0.05 | 0.28 | 12.7 | 0.25 | 0.04 | 0.03 | 0.44 | 1050 | |
| CB6 | Red | 12.4 | 0.05 | 0.64 | 78.3 | 0.19 | 0.20 | 5.08 | 1.31 | 0.75 | 0.93 | – | 1083 |
| Subs | 11.6 | 0.13 | 1.46 | 73.4 | 0.06 | 0.47 | 12.4 | 0.28 | 0.05 | 0.05 | 0.55 | 1048 | |
| SDPDM | Red | 12.6 | 0.04 | 0.64 | 77.1 | 0.21 | 0.12 | 5.44 | 1.11 | 1.38 | 1.26 | – | 1073 |
| Subs | 12.4 | 0.22 | 1.56 | 71.5 | 0.14 | 0.51 | 13.0 | 0.29 | 0.06 | 0.05 | 0.52 | 1030 | |
| CBCB | Red | 14.5 | 0.13 | 0.35 | 76.8 | 0.09 | 0.11 | 4.40 | 0.73 | 1.26 | 1.54 | – | 1030 |
| Subs | 13.3 | 0.20 | 0.57 | 69.8 | 0.05 | 0.38 | 15.4 | 0.23 | 0.01 | 0.00 | 0.57 | 999 | |
| CB7 | Red | 15.5 | 0.24 | 0.41 | 74.7 | 0.16 | 0.16 | 5.65 | 0.70 | 0.84 | 1.51 | – | 1025 |
| Subs | 12.7 | 0.45 | 0.55 | 71.0 | 0.04 | 0.24 | 14.7 | 0.25 | 0.01 | 0.01 | 0.47 | 1012 |
| Sample | Colour | Li | B | P | Ti | Mn | Zn | As | Rb | Sr | Zr | Sn | Sb | Ba | Pb |
|---|---|---|---|---|---|---|---|---|---|---|---|---|---|---|---|
| TDM | Red | 8 | 794 | 5 | 236 | 77 | 32 | 44 | 23 | 32 | 36 | 9140 | 14 | 68 | 705 |
| Subs | 12 | 100 | 41 | 189 | 689 | 849 | 1596 | 8 | 84 | 30 | 82 | 899 | 1179 | 3706 | |
| SDC | Red | 11 | 8 | 78 | 522 | 56 | 43 | 39 | 5 | 28 | 63 | 15358 | 7 | 83 | 101 |
| Subs | 9 | 25 | 56 | 378 | 66 | 8 | 189 | 4 | 68 | 54 | 299 | 4 | 59 | 36 | |
| Vic | Red | 12 | 24 | 128 | 452 | 43 | 48 | 36 | 5 | 39 | 27 | 10527 | 9 | 33 | 23 |
| Subs | 10 | 23 | 53 | 196 | 39 | 7 | 788 | 4 | 164 | 18 | 118 | 2 | 29 | 26 | |
| LGA | Red | 22 | 10 | 77 | 200 | 158 | 22 | 35 | 7 | 16 | 28 | 7838 | 6 | 40 | 60 |
| Subs | 11 | 10 | 32 | 198 | 168 | 8 | 8 | 8 | 48 | 28 | 273 | 1 | 79 | 11 | |
| CB6 | Red | 14 | 12 | 94 | 239 | 395 | 25 | 41 | 8 | 21 | 39 | 7301 | 11 | 81 | – |
| Subs | 10 | 6 | 50 | 179 | 82 | 9 | 15 | 12 | 61 | 28 | 372 | 1 | 104 | 8 | |
| SDPDM | Red | 20 | 7 | 39 | 182 | 230 | 41 | 28 | 4 | 16 | 17 | 9941 | 6 | 54 | 29 |
| Base | 14 | 7 | 52 | 188 | 989 | 9 | 8 | 12 | 98 | 29 | 398 | 7 | 459 | 61 | |
| CBCB | Red | 8 | 15 | – | 181 | 82 | 18 | 26 | 4 | 22 | 19 | 12125 | 2 | 35 | 104 |
| Subs | 11 | 23 | 52 | 206 | 32 | 10 | 2 | 6 | 136 | 21 | 21 | 0 | 40 | 31 | |
| CB7 | Red | 10 | 16 | 38 | 192 | 41 | 107 | 24 | 4 | 31 | 19 | 11870 | 2 | 30 | 34 |
| Subs | 10 | 25 | 35 | 187 | 48 | 10 | 8 | 5 | 83 | 18 | 97 | 0 | 33 | 10 |
Sulphur was measured by microprobe. Tw: the working temperature is the optimal temperature for blowing the glass has been calculated using the approximation given in [36].
All the glasses show a single layer of red glass on the surface, i.e. flashed glasses. There are some important differences between the chemical composition of the red glass layers and the corresponding substrate colourless glasses. The red glasses contain copper and tin (≈0.5–1.4% CuO, 1–2% SnO2), they also have a higher iron content (1–2% FeO in the 19th-century glasses and 0.7%FeO in the 20th-century glasses) and lower calcium content (5–7% CaO) than the corresponding substrate glasses (0.2% FeO and 12–15% CaO). Therefore, copper, tin and probably iron were added to obtain the red colour. The most important change is the addition of tin instead of sulphur (used before the 19th century) in the red glass, and also the addition of Fe (more in the 19th century than later in the 20th century red glasses). Both Sn2+ and Fe2+ are known reducing agents in glass, and may be involved in the reduction of copper to the metallic state.
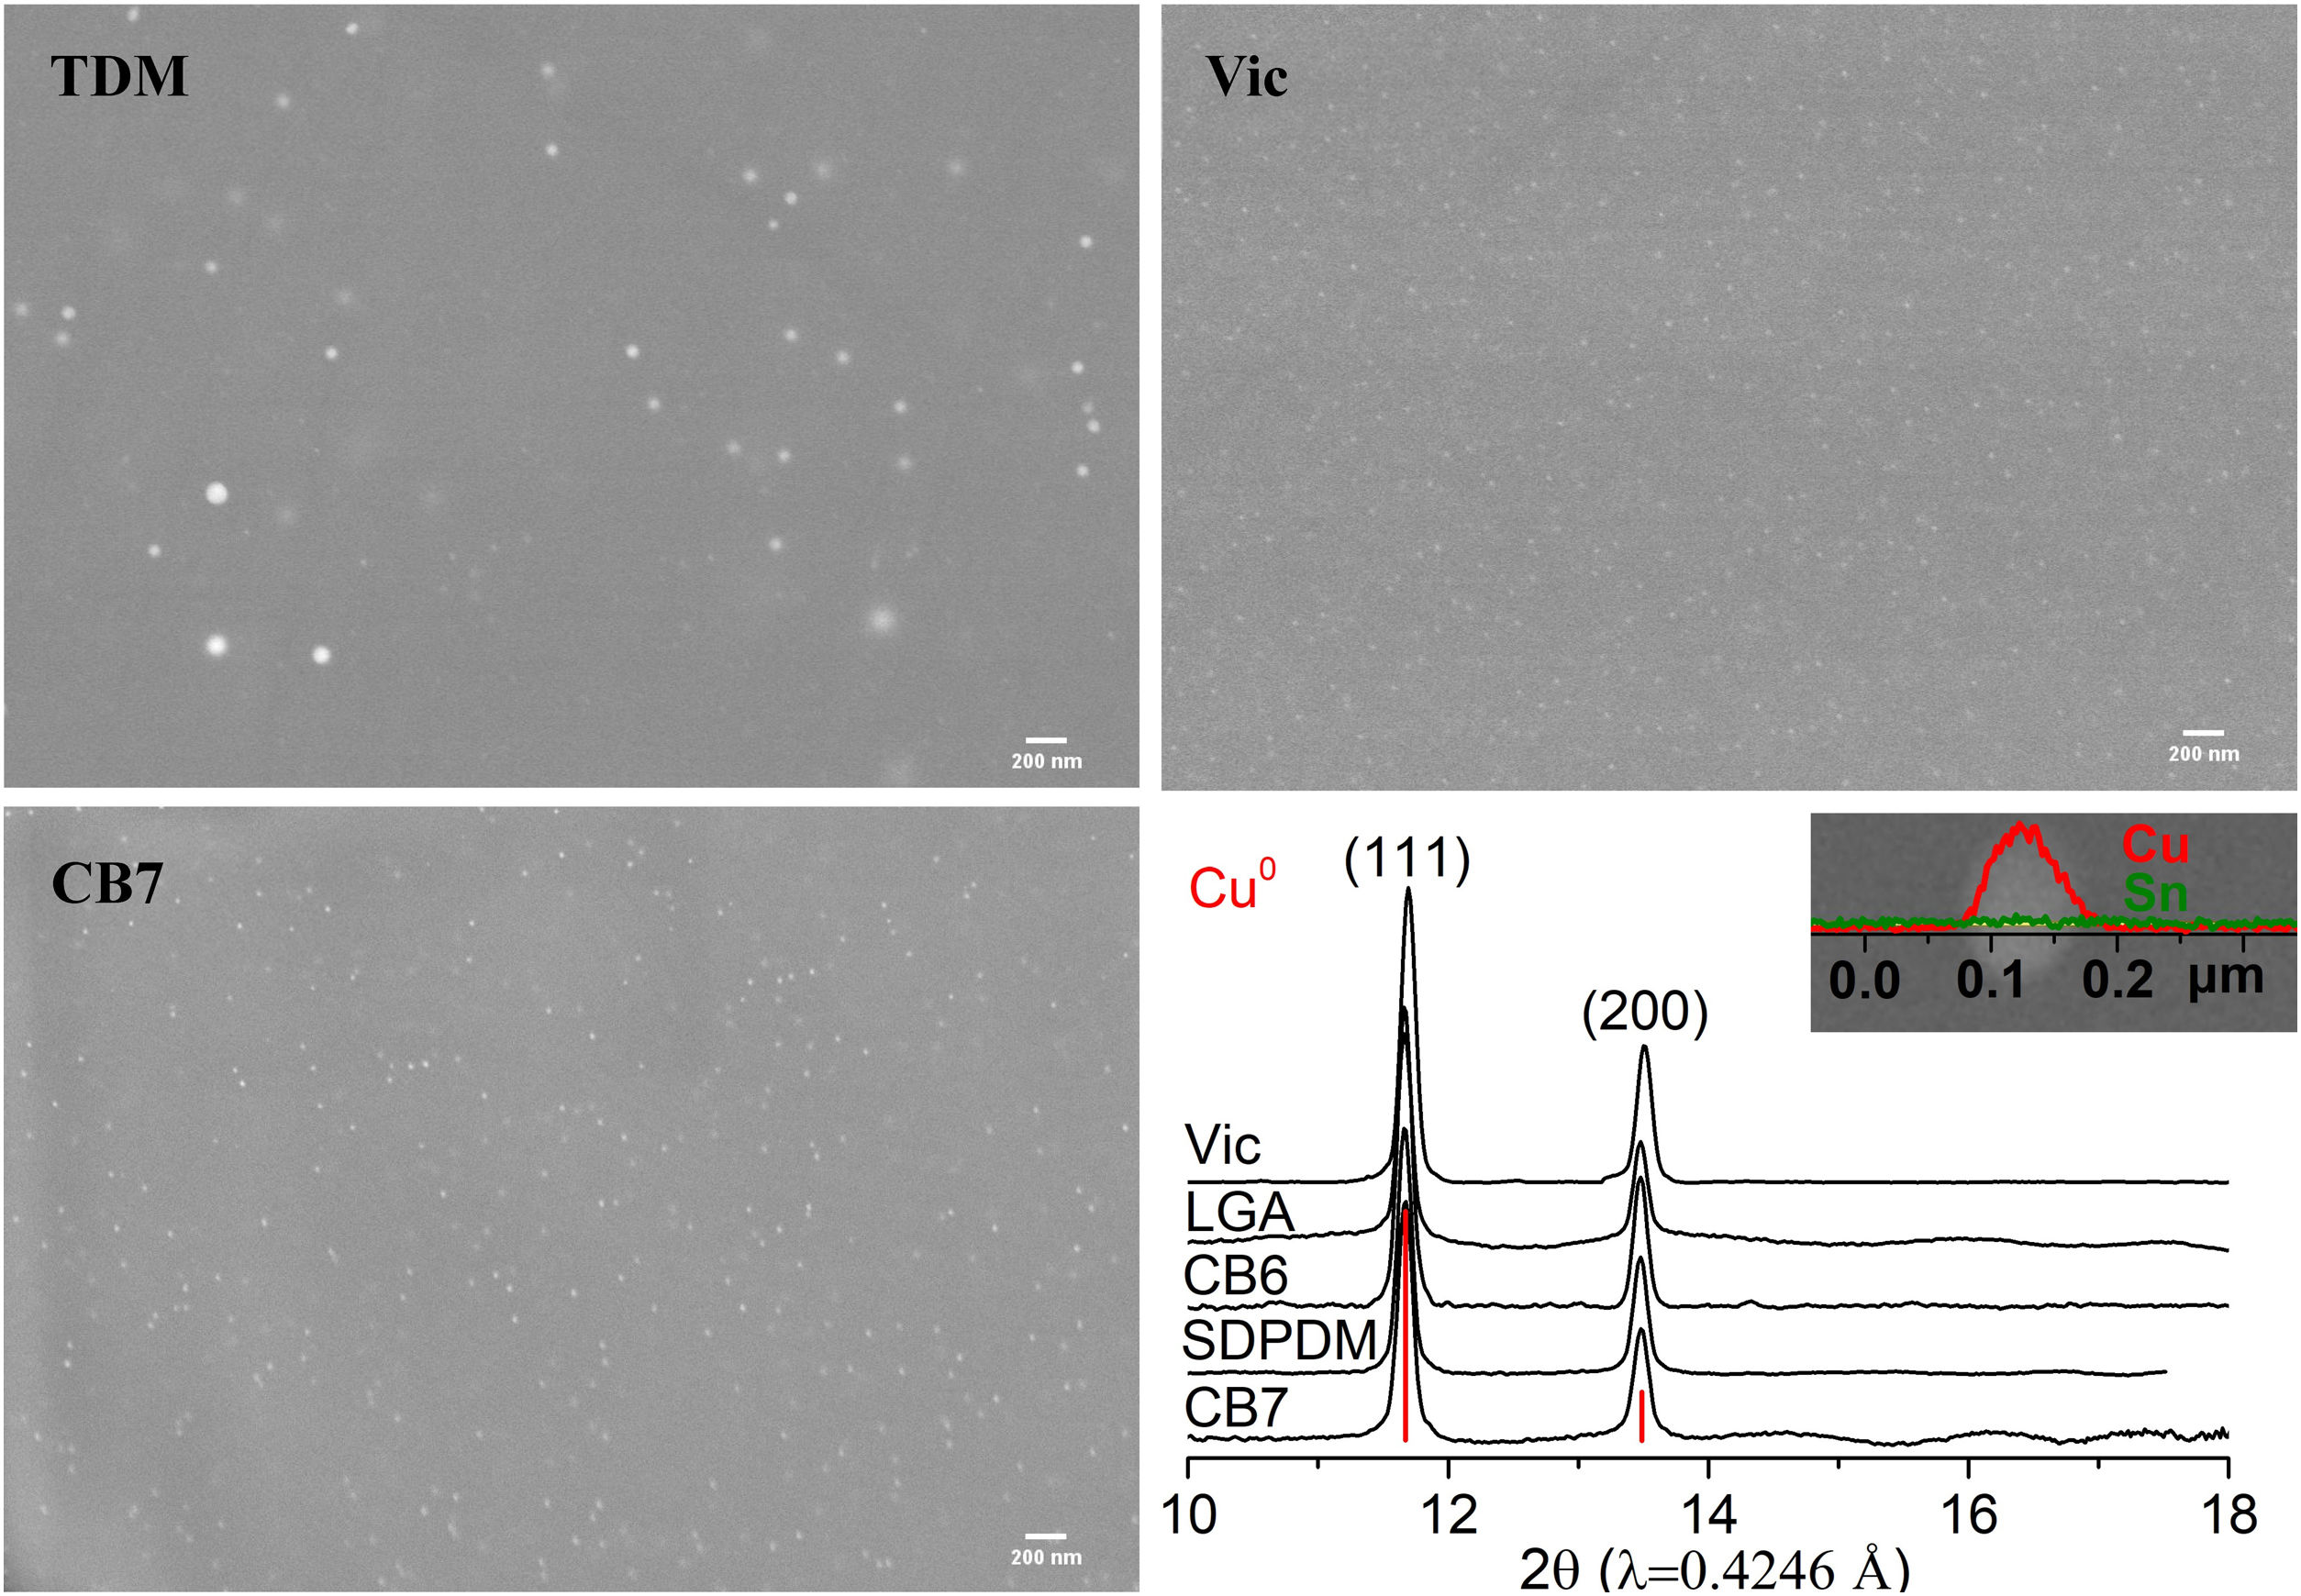
In all the cases, the red colour of the glasses is due to the presence of small copper nanoparticles of typical sizes between 20 and 50nm for all the red glass layers with the exception of TDM which has larger particles, between 50 and 150nm, as shown in Fig. 2. No other crystalline precipitate was found.
, micro-XRD patterns of the red glasses and line scan of a metallic copper nanoparticle of TDM.")
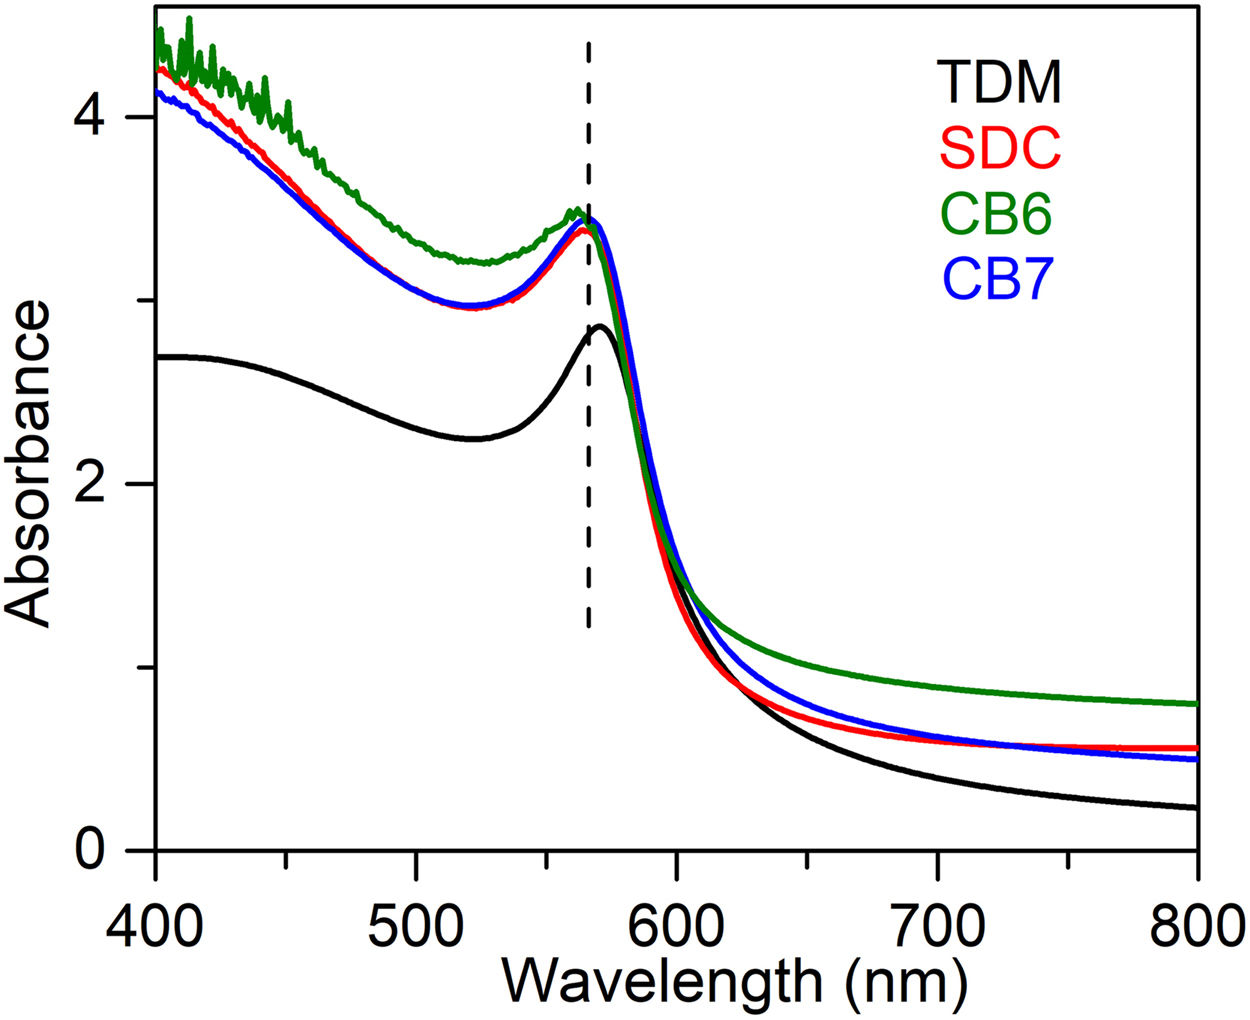
UV–Vis is particularly useful for the identification of the presence of colouring cations in the glass, as well as the presence of cuprite and metallic copper nanoparticles. The UV–Vis absorption spectra corresponding to the glasses are shown in Fig. 3. Metallic copper nanoparticles show a Surface Plasmon Resonance (SPR) extinction band around 560nm. The band is slightly red shifted (570nm) for TDM, due to the larger particle sizes of the metallic copper nanoparticles.
. The spectrum corresponding to TDM appears slightly red shifted due to the large particle size (50–150nm).")
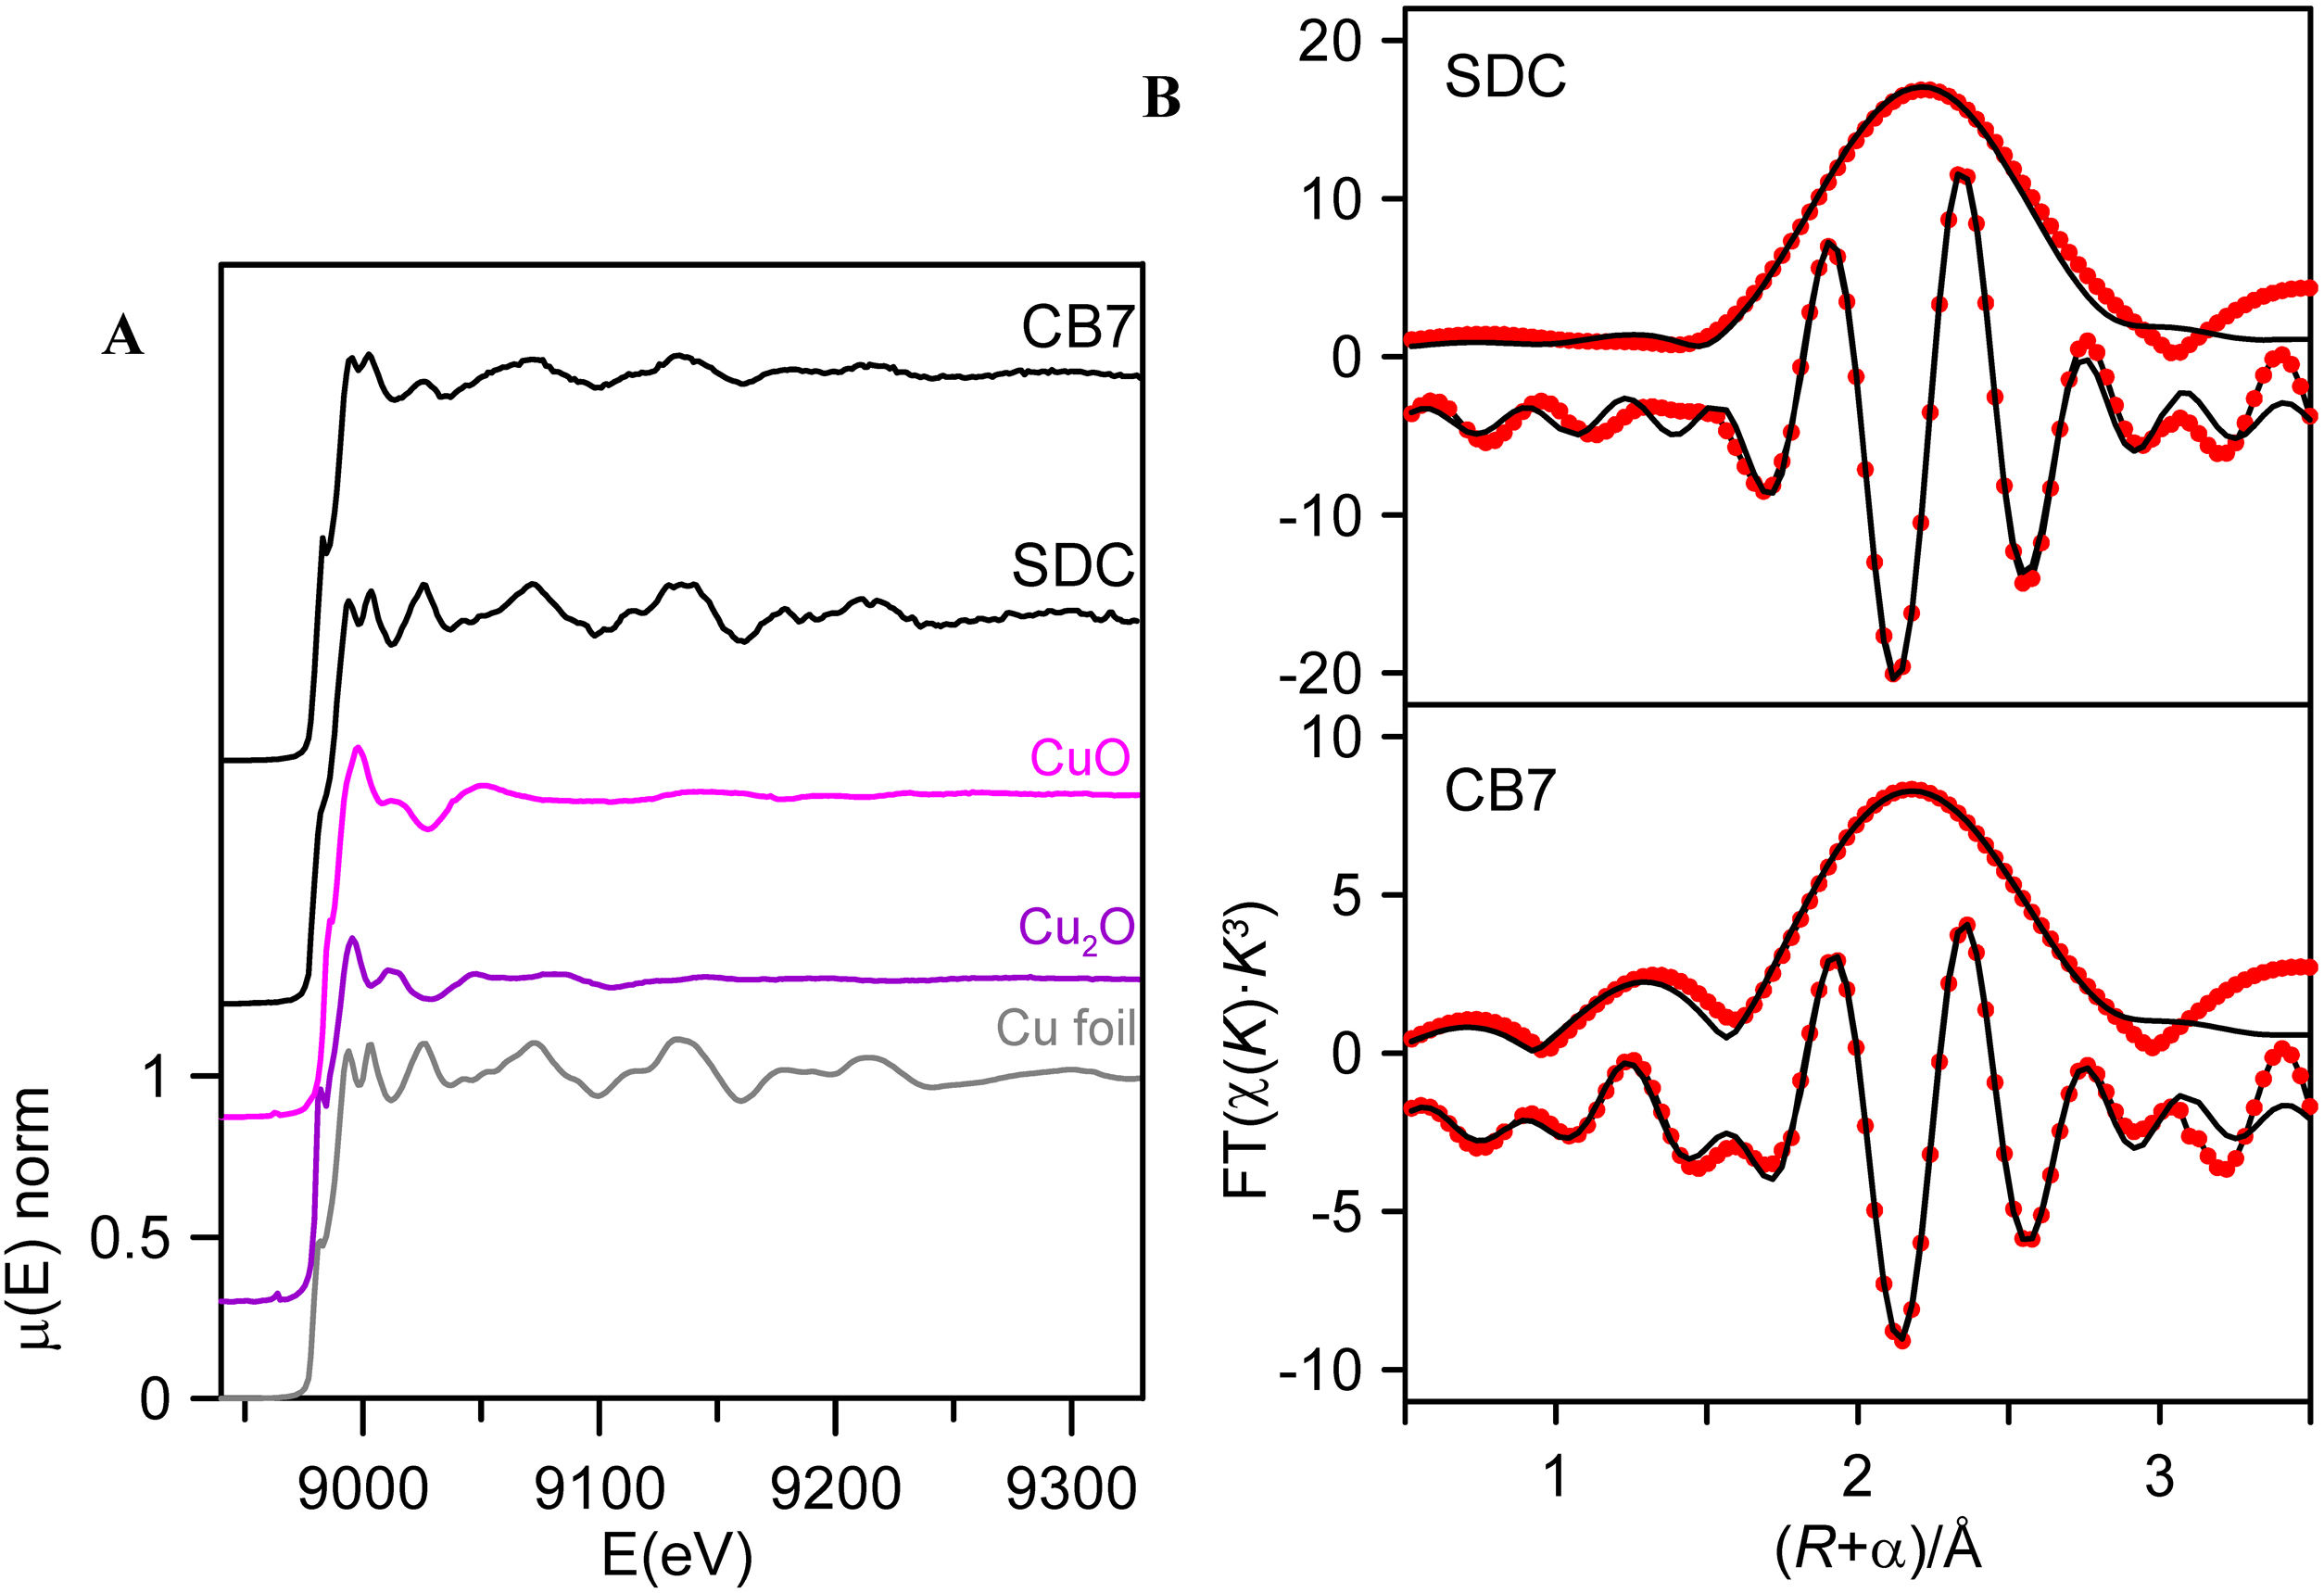
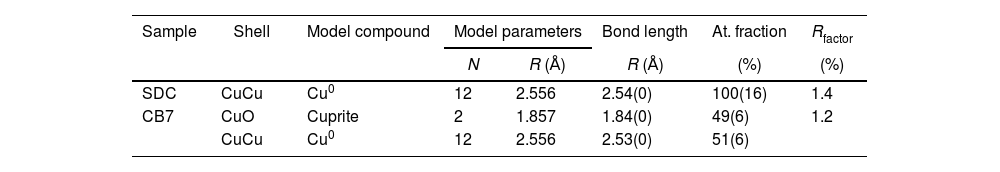
In order to see the role of iron and tin in the formation of the metallic copper nanoparticles, the absorption spectra at the Fe and Cu K-edge and Sn L3-edge were measured for some of the red and corresponding colourless substrate glasses, SDC from the 19th century and CB7 from the 20th century. The Cu K-edge XAFS taken from the red glasses and from the copper standards, Cu0, Cu2O and CuO are shown in Fig. 4A. In both spectra, the dominant contribution corresponds to metallic copper. Fig. 4B and Table 3 show the fit of the first shell data of the EXAFS region. Within the spectral resolution of XAS, SDC red glass is mostly metal while CB7 contains half of the copper as Cu0 and the other half as Cu+. Cu2+ is not found in the red glasses.
 Cu K-edge spectra of SDC, CB7 and Cu standards; (B) Cu K-edge EXAFS (dots) and curve fitting (line) for SDC and CB7 red glasses in R-space (FT magnitude and imaginary component). Data are k3-weighted and not phase-corrected.")
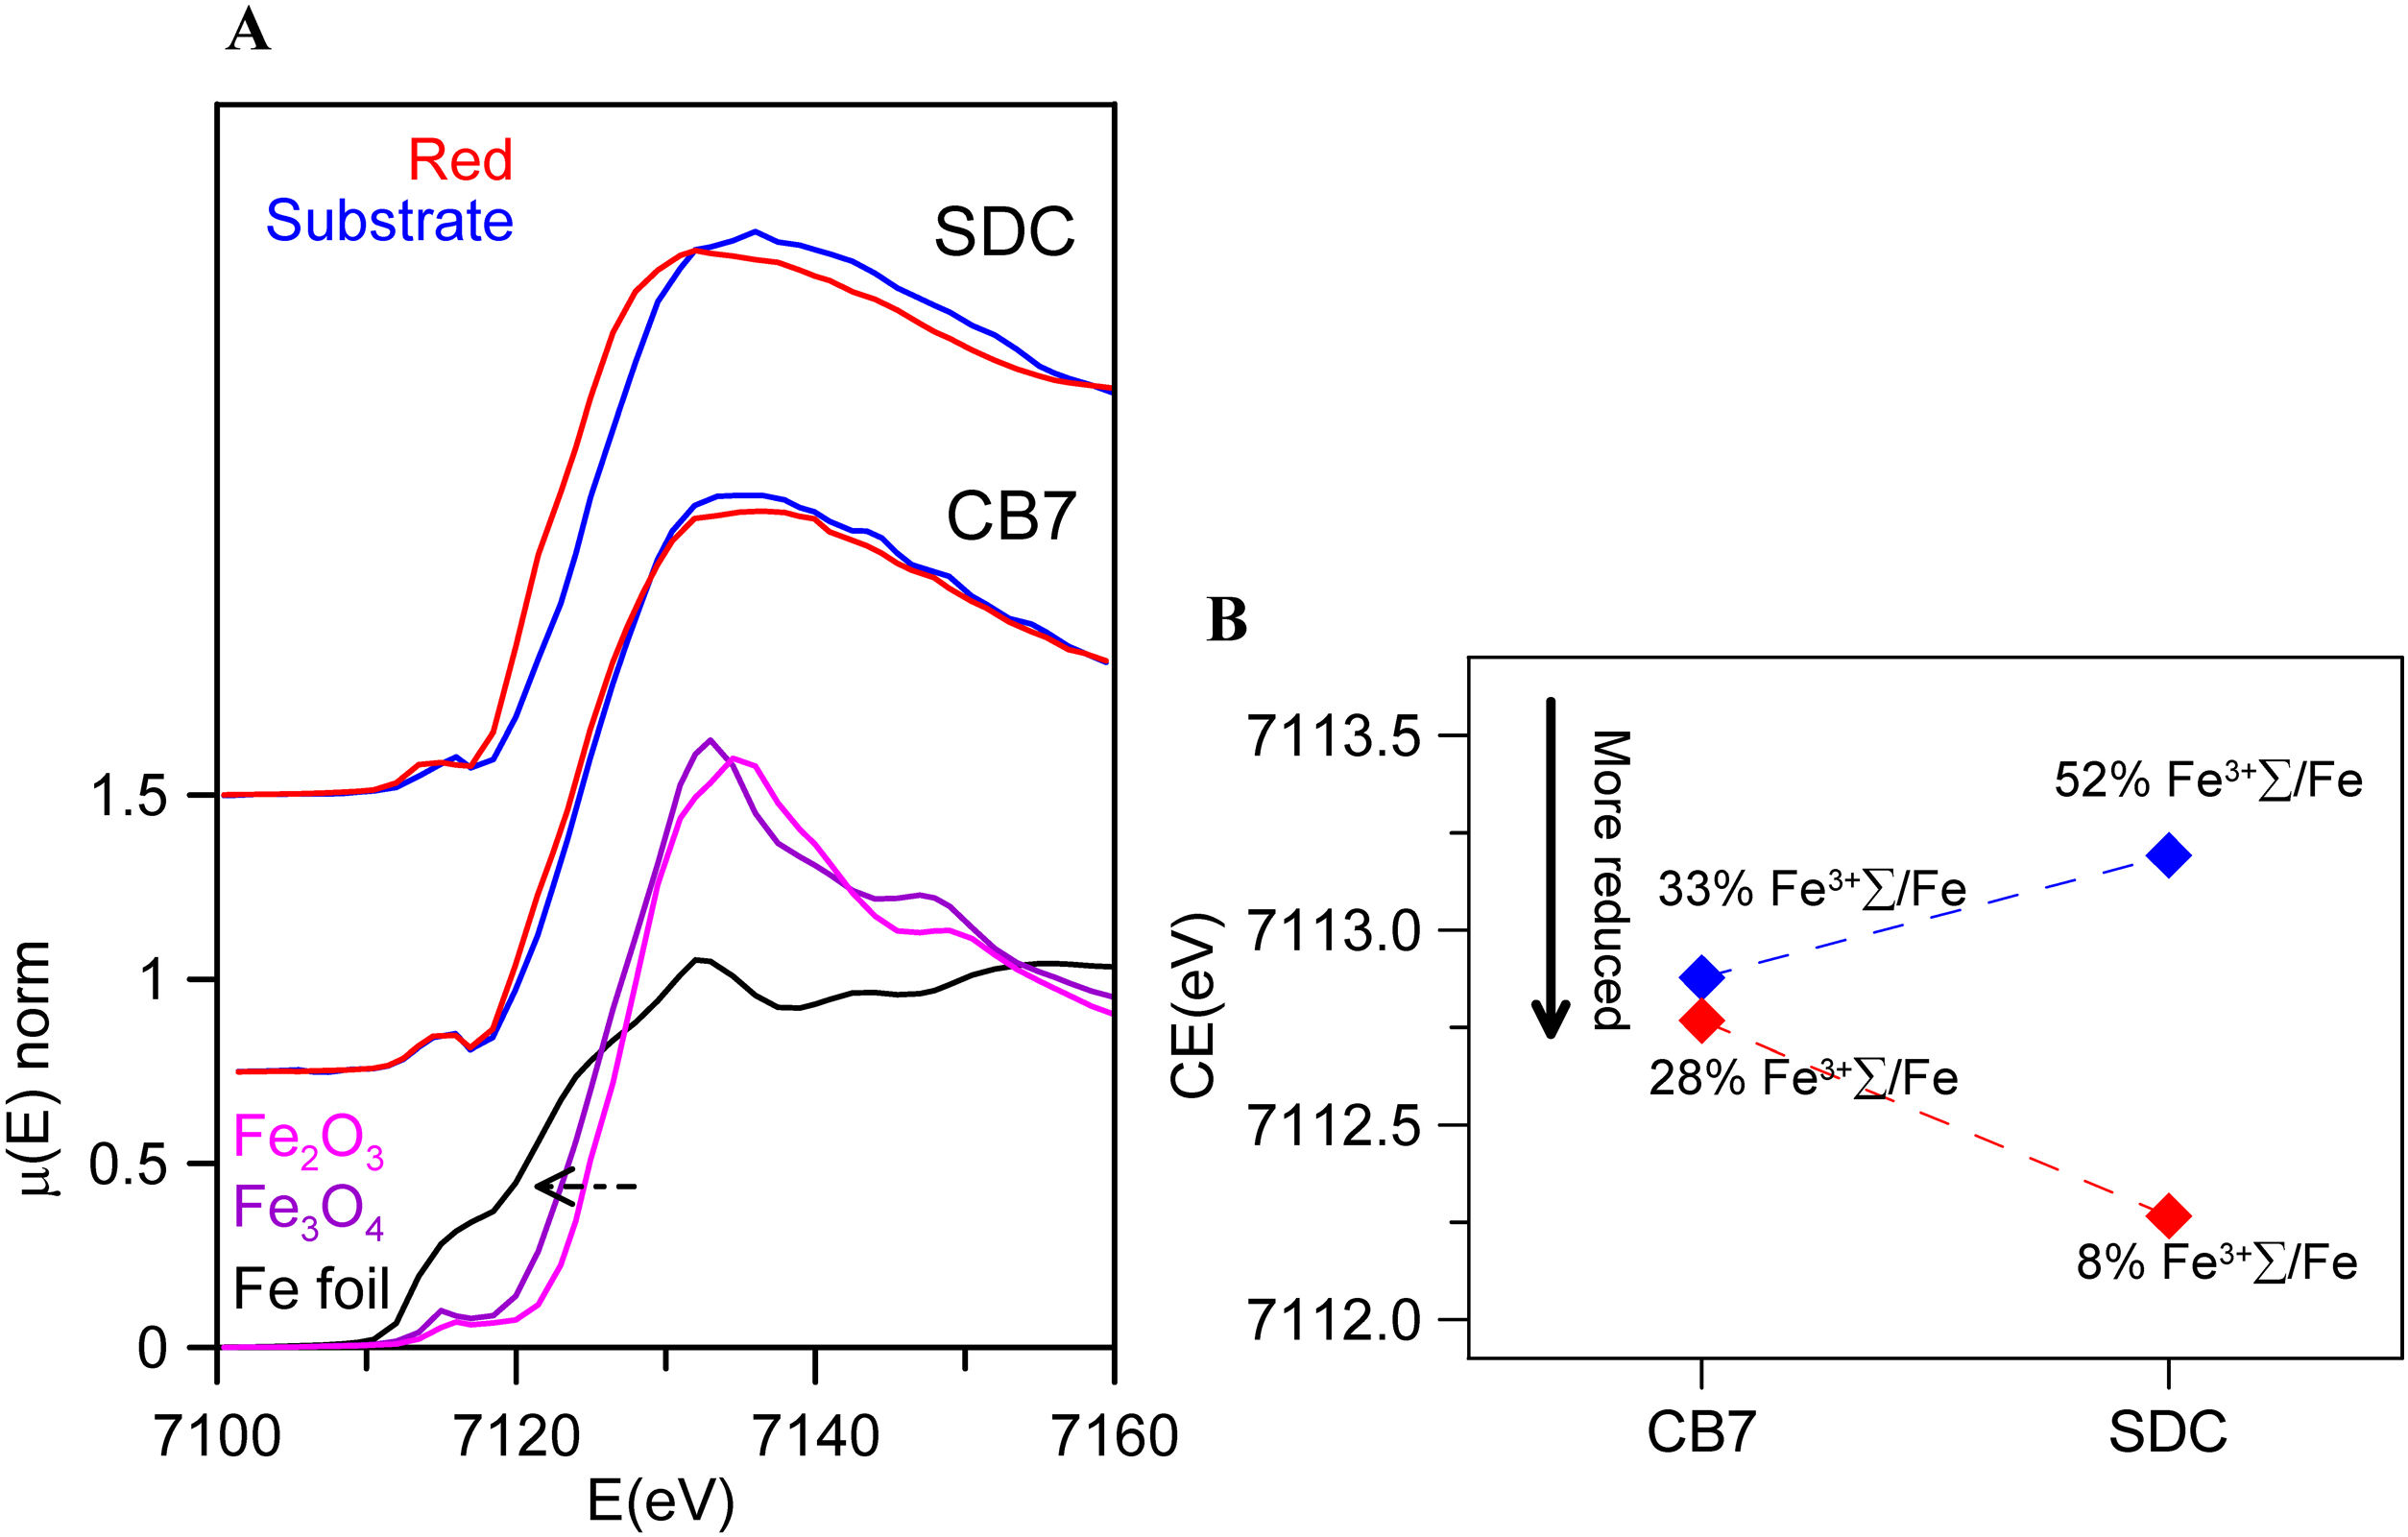
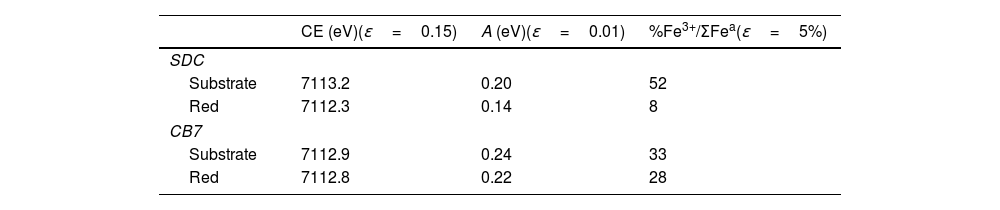
Fig. 5 and Table 4 show the Fe K-edge spectra and fitted data corresponding to the SDC and CB7 red glass layers and the substrate glasses. Iron is more reduced in the red glass than in the substrate glass and in the red glass layers iron is also more oxidized in CB7 than in SDC.
![(A) Fe K-edge spectra of CB7 and SDC colourless substrate glasses and red glass layers (the red line and dots correspond to the red layer and the blue line and dots to the substrate transparent glass) and Fe standards. The edge shifts to higher energy as the iron becomes more oxidized; (B) pre-edge center shift (CE) of the glasses. The CE increases as the iron becomes more oxidized. The Fe3+ fraction has been calculated using the expression in A. Fiege et al. [25].](https://static.elsevier.es/multimedia/03663175/0000006300000002/v1_202405090749/S0366317523000389/v1_202405090749/en/main.assets/gr5.jpeg?xkr=ue/ImdikoIMrsJoerZ+w997EogCnBdOOD93cPFbanNd3TCEZuNxhudow/+3Hrh9WJc+mtnYSSPL9K6mfMWVj1qZC/8yxK1I8+MyXLMVxkX3NRTFABU9nVSP51jr35OczLZ5U8XsYg5y/TF3C2pwt1loVIIlDLs/WIAVsVxOiP7nf6CJSm7EPUWAk6KNMjqpI6HLsDU8wIDGsEoO2Y09k50+TKSlHCVPTu4xOo1yF+3r1JaWRDd4znMAZvE/ajCHv1m34txyJXT5eM9hWxwDojZcPCVicim1cXeqHOPbGoMoyTXtp+Bnn7SAulqTCeW2u "(A) Fe K-edge spectra of CB7 and SDC colourless substrate glasses and red glass layers (the red line and dots correspond to the red layer and the blue line and dots to the substrate transparent glass) and Fe standards. The edge shifts to higher energy as the iron becomes more oxidized; (B) pre-edge center shift (CE) of the glasses. The CE increases as the iron becomes more oxidized. The Fe3+ fraction has been calculated using the expression in A. Fiege et al. [25].")
(A) Fe K-edge spectra of CB7 and SDC colourless substrate glasses and red glass layers (the red line and dots correspond to the red layer and the blue line and dots to the substrate transparent glass) and Fe standards. The edge shifts to higher energy as the iron becomes more oxidized; (B) pre-edge center shift (CE) of the glasses. The CE increases as the iron becomes more oxidized. The Fe3+ fraction has been calculated using the expression in A. Fiege et al. [25].
Fitted pre-edge peak center shift and Area of SDC and CB7 colourless substrate glasses and red glass layers, ɛ is the standard deviation of the fitted data.
| CE (eV)(ɛ=0.15) | A (eV)(ɛ=0.01) | %Fe3+/ΣFea(ɛ=5%) | |
|---|---|---|---|
| SDC | |||
| Substrate | 7113.2 | 0.20 | 52 |
| Red | 7112.3 | 0.14 | 8 |
| CB7 | |||
| Substrate | 7112.9 | 0.24 | 33 |
| Red | 7112.8 | 0.22 | 28 |
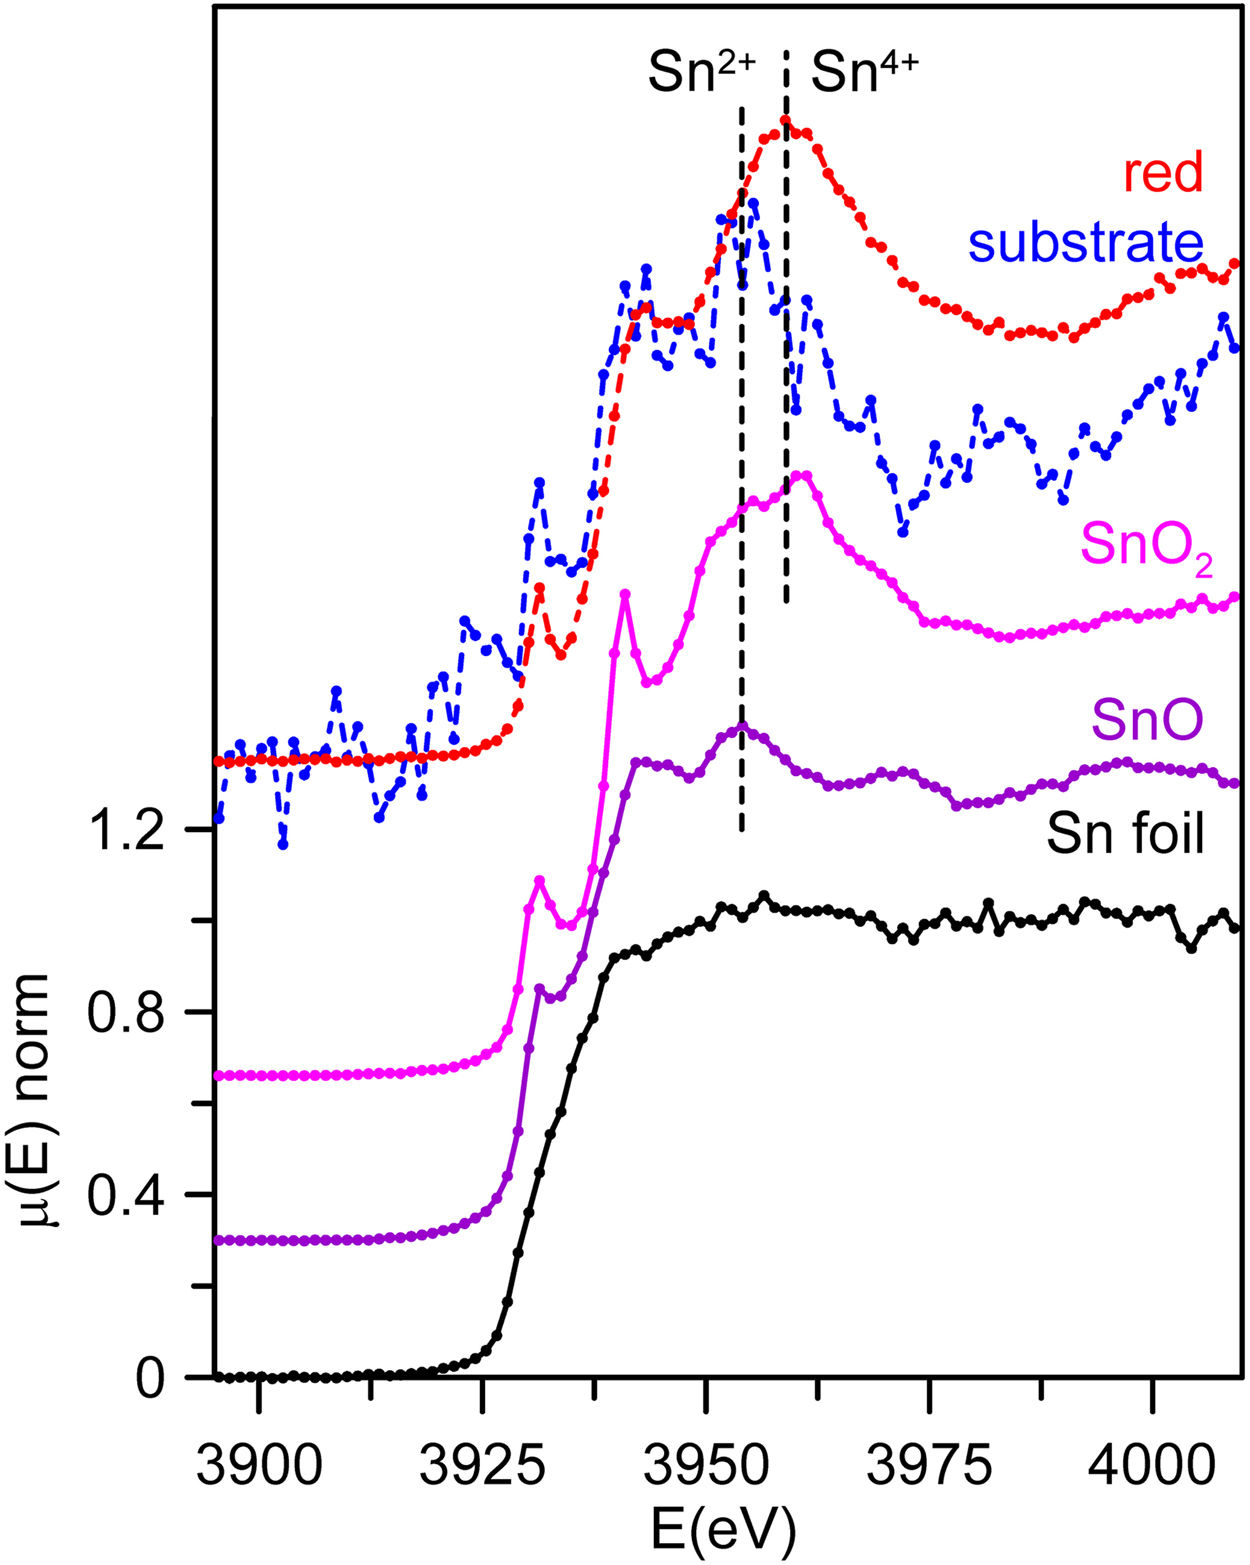
Finally, Sn L3-edge spectra from the substrate glass and red coloured layer were acquired from SDC and are shown in Fig. 6 together with the corresponding tin standards. The uncoloured substrate glasses contain only trace amounts of tin, 299ppm for SDC, this is the reason why the corresponding data is very noisy. The Sn L3-edge spectra corresponding to Sn2+ and Sn4+ in glass are similar to those of the crystalline oxides, SnO and SnO2, but with smoother and broader absorption peaks [29]. We can clearly see that Sn4+ predominates in the red glass layer while Sn2+ predominates in the colourless substrate glass.
Discussion
All the red flashed glasses from the 19th and 20th centuries are of the soda-lime type, and considering the low presence of ash components (P, S and Cl) manufactured from synthetic soda that was used in the glass industry since 1835 [31,32]. In addition, TDM, SDC and Vic glasses can be dated before 1870, while LGA, CB6 and SDPDM after 1870 (in good agreement with the official dating of the windows). Finally, CBCB and CB7 are dated to the very beginning of the 20th century, in 1905.
All the glasses have a single layer of red glass on the surface and are flashed glasses. The red glass layers contain copper and tin (≈0.5–1.4% CuO, 1–2% SnO2), they also contain higher iron (1–2% FeO in the 19th-century glasses and 0.7% FeO in the 20th-century glasses) and lower calcium (5–7% CaO) than the corresponding substrate glasses (0.2% FeO and 12–15% CaO).
In a previous study, we demonstrated that copper and iron are more oxidised in Ca-rich glasses fired under the same conditions, oxidizing and then reducing [26]. The Cu+/(Cu++Cu2+) was 70% in Ca-rich areas (about 23% CaO) and 90% in the Ca-poor areas (9% CaO) and the Fe2+/(Fe2++Fe3+) was 20% and 70%, respectively. In addition, a Mössbauer spectroscopy study of lime glasses [37] showed that the Fe3+ fraction increases with the CaO content of the glasses or the oxygen partial pressure of the firing. Therefore, decreasing the calcium content of red glasses favours both copper and iron to be present in a more reduced form.
The oxidation state of tin in soda-lime glasses has also been studied by Mössbauer spectroscopy [38]. A set of soda-lime glasses was produced by adding either a Sn4+ or a Sn2+ compound. Interestingly, when tin was added as Sn4+, tin was present as Sn4+ in the glass whereas if it was added as Sn2+, only half of the tin was still present as Sn2+ in the glass, the other half was already as Sn4+. No differences in the behaviour were found for tin contents ranging from 0.4 to 6% SnO2 or SnO.
Due to the extremely low solubility of metals in silicate glass, copper must be incorporated into the glass in its ionic form, Cu+ and/or Cu2+, which requires an oxidizing atmosphere during the firing. The process of red glass production described in the historical and modern documents involves mixing the glass with copper and reducing agents such as tin, lead, iron and/or calcined cream of tartar (K2CO3·1.5H2O) and firing at high temperatures [1,11,12,14]. According to historical treatises, the ingredients were pretreated (burned copper, vinegar, aqua fortis, or aqua regia treated iron, tin-lead ashes), while more recent descriptions indicated the addition of tin oxide, magnetite and in some cases directly as metal (Sn0) [1,9]. Our glasses do not contain lead, and only tin and iron were added as reducing agents.
Our data have shown that in the red glass, copper appears as Cu+ and Cu0 while tin is present mainly in its oxidized form Sn4+. Consequently, tin acted as a reducing agent, which requires tin to be incorporated into the glass as Sn2+. The addition of other reducing agents, such as K2CO3·1.5H2O to the glass melt, as described in historical and modern documents, would favour the incorporation of tin as Sn2+ into the glass. It has been found [38] that when tin is added in the form of SnO, only half of the tin remains in the glass as Sn2+, so that a tin to copper ratio of 2:1 is required to reduce all the copper. Therefore, the relative amount of the different ions involved must be taken into account. Table 5 shows the atomic concentration of tin, iron and copper in the red glasses. In CB7 with a Sn:Cu=1:1, only half of the copper is reduced to the metallic state, while in SDC with Sn:Cu=2:1, all copper is reduced to the metallic state. To obtain a red glass, it is therefore necessary to use a Sn2+ compound or metallic tin, or to add some reducing agents such as K2CO3·1.5H2O to the melt, as described in the documentation. Once tin is oxidised to Sn4+, it is quite soluble in alkaline glasses [5] and remains dissolved in the red glass. The predominance of Sn2+ in the substrate glass indicates reducing conditions during production, which is probably also aided by the low tin content (200–300ppm).
Iron in SDC is mainly present in its reduced form (about 90% Fe2+) and cannot have acted as a reducing agent for copper. Consequently, the role of iron is less clear. However, since iron in a calcium poor soda-lime glass tends to be present in its more reduced state Fe2+, copper may be more likely present in the glass as Cu+ rather than Cu2+, as we have seen occurring [26]. Iron may then have an indirect role in the production of red glass by preventing the presence of copper as Cu2+, thus facilitating the reduction of copper to the metallic state. In addition, we have observed that the iron content of red glasses decreases slightly in the 20th century.
The 19th century marks an important change in the production technology of copper red glasses. This coincides with scientific advances in glass production such as the use of synthetic soda, the use of As2O3 and later of KNO3 as refining agents.
ConclusionsLittle or nothing is known about the materials used in the manufacture of red window glass in the 18th and 19th centuries and the first decade of the 20th century. A selection of seven copper red glasses was studied, all of them consisting of a single thin surface layer of red glass on a colourless glass substrate, a type commonly known as flashed glass. The chemical composition of the substrate colourless glasses indicated that they were all obtained from synthetic soda which was not used before 1835; the presence/absence of arsenic added to the glass as a fining agent, allowed dating three of them before 1870 and three after 1870, the other two were produced in 1905. The red colour of the glass is due to the presence of metallic copper nanoparticles (size 20–50nm). Contrary to the red copper glasses produced between the 13th and 17th centuries, the composition of red glass layers is different from those of the substrate glasses. The red glass shows low-calcium content (about 5% CaO) which causes both copper and iron to be present in the glass predominantly in their reduced form, Cu+ and Fe2+. Red glasses contained copper, tin and iron while lead, described in historical and modern documentation was absent.
Our data has shown that tin is present mainly in its oxidized form Sn4+, in the red glass, while copper is present as Cu+ and metallic copper; the more the copper is reduced, the more the iron in the glass is reduced. Consequently, tin acted as a reducing agent, which requires tin to be incorporated into the glass as Sn2+. The addition of other reducing agents such as K2CO3·1.5H2O, as described in historical and modern documents, would promote the incorporation of tin as Sn2+ into the glass. The role of iron is less clear, but since iron is also preferentially incorporated in a low-calcium glass as Fe2+, it may prevent the incorporation of copper as Cu2+, facilitating the reduction of copper to the metallic state.
FundingThis work received financial support from MINECO (Spain) (grant PID2019-105823RB-I00), the Generalitat de Catalunya (grant 2021 SGR 00343) and structural analysis of historical materials, 2025 https://doi.org/10.15151/ESRF-ES-879445008.
Conflict of interestWe have no conflict of interest.
The XAS experiments were performed at ID21 Beamline at ESRF with the collaboration of ESRF Staff, through the proposal HG-172. Micro-XRD experiments were performed at BL04 (MSPD) Beamline at ALBA synchrotron facility with the collaboration of Alba Staff.

