


According to the World Health Organization [1], liver cancer is one of the top three causes of cancer-related deaths in 46 countries and one of the top five causes in 90 countries. It is projected that by 2040, the number of new liver cancer cases will increase by 55.0% compared to 2020, with an estimated 1.4 million new diagnoses in 2040. It is also estimated that there will be 1.3 million deaths from liver cancer in 2040, representing a 56.4% increase compared to 2020. Asia is the continent with the highest incidence of liver cancer, accounting for 72.5% of the global incidence, while China is the country with the highest burden of liver cancer, accounting for 45.3% of the global new liver cancer cases. In China, there were 410,038 new liver cancer cases in 2020, with a crude incidence rate of 28.3/100,000 and a population-standardized incidence rate of 18.2/100,000. In China, there were 391,152 liver cancer-related deaths in 2020, with a crude case fatality rate of 27.0 per 100,000 and a global population-standardized case fatality rate of 17.2 per 100,000. Chinese liver cancer deaths account for approximately 47.1% of all liver cancer deaths worldwide [2]. In China, liver cancer is the leading cause of death for people under the age of 65 and the leading cause of death due to malignant tumors. Males in China have a higher incidence and mortality rate of liver cancer than females, and rural areas have a higher incidence and mortality rate than urban areas [3,4]. In China, the 5-year survival rate for liver cancer was 12.1% from 2012 to 2015 [5].
Due to the need for rapid proliferation and the relative lack of external blood supply in liver cancer tissue, liver cancer cells are frequently in a metabolic stress state characterized by relative hypoxia and insufficient nutrient supply. To adapt to this living environment, liver cancer cells will now undergo a series of metabolic reprogramming processes. In addition to activating glycolysis, reprogramming of lipid metabolism is an important mechanism by which liver cancer cells respond to metabolic stress [6]. As a component of cell membranes, a source of energy, and a signaling molecule, fat inevitably plays a significant role in cancer [7–11]. Under normal physiological conditions, the liver regulates fat homeostasis and the metabolism of lipoproteins. Damage to liver cells impairs this function, resulting in alterations in lipid metabolism, which play a crucial role in the development of liver cancer. Different from normal tissue cells, the reprogramming of lipid metabolism in liver cancer cells is primarily manifested in lipid metabolism processes such as FA synthesis (FAS) and FA oxidation (FAO). Under stress, the survival and proliferation of liver cancer cells are highly dependent on the regulation of FAS and FAO [12,13].
Through the gene set associated with FA metabolism, the purpose of this study is to investigate the association between the level of FA metabolism and the clinical indicators and prognosis of HCC. In addition, the relationship between FA metabolism, liver cancer immunotherapy, and the immune microenvironment was investigated. By combining single-cell datasets with bulk datasets, we have gained a deeper understanding of the impact of FA metabolism on HCC.
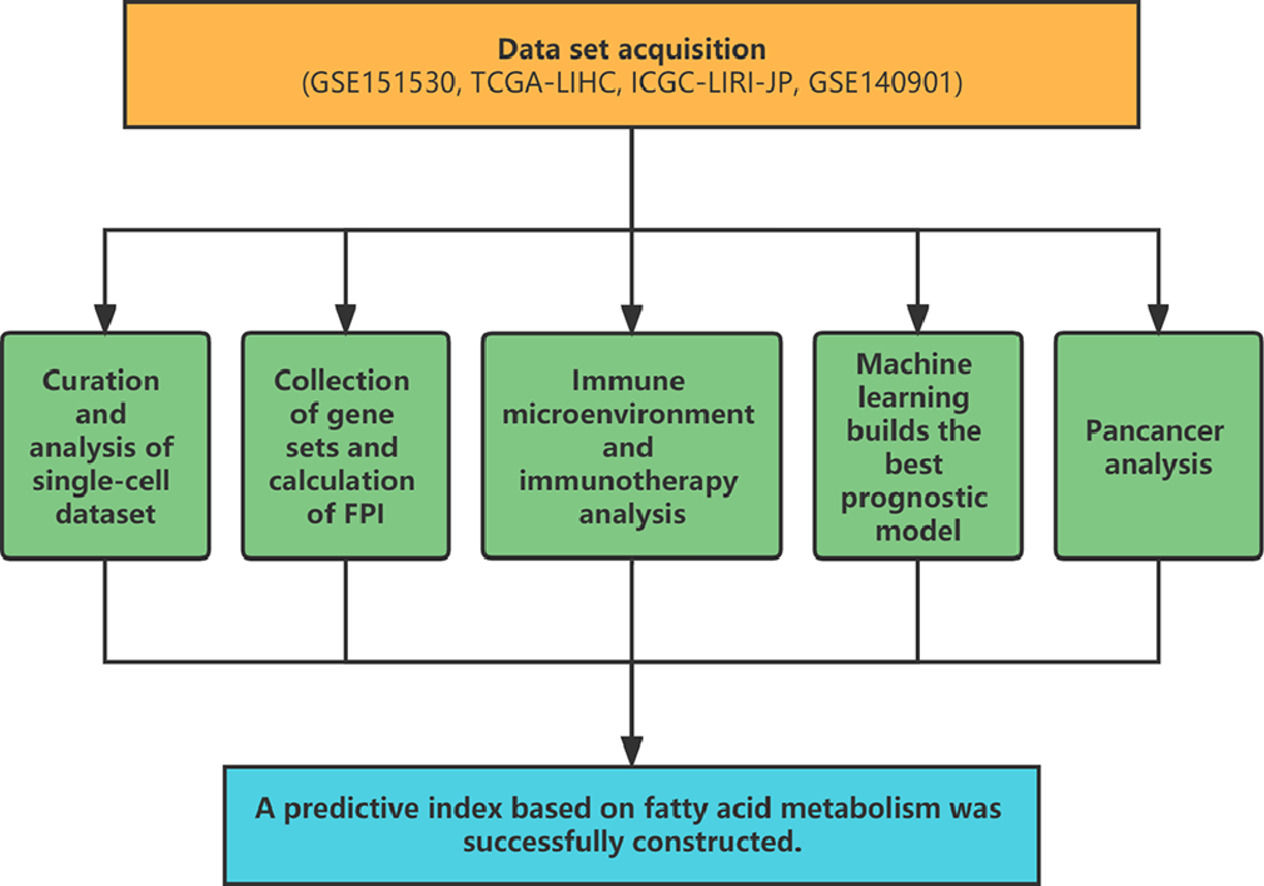
2Material and Methods2.1Data set acquisitionThe single-cell data set GSE151530 was downloaded from the GEO database, which contained a total of 46 samples of HCC and intrahepatic cholangiocarcinoma, and 16 biopsy samples before and after treatment were collected from seven patients. The expression matrix, corresponding clinical information, and mutation data of HCC samples were extracted from the TCGA database, and the LIRI-JP cohort containing the transcriptomic data of 231 HCC patients was extracted from the ICGC database. GEO database GSE140901 contains 24 HCC samples treated with PD-1/PD-L1 immunotherapy.
2.2Curation and analysis of single-cell datasetAfter integrating the expression matrix data in GSE151530, filter and standardize, then annotate and visualize the dimensionally reduced cluster using SingleR [14] and Celltype [15]. Utilize AUCell [16]to compute and display the FA metabolism score for each group based on the gene set. ClusterProfiler [17] was utilized to conduct a GSEA analysis of differential genes between various FA metabolism groups. SCEVAN [18] can distinguish between non-malignant and malignant cells of the tumor microenvironment and characterize the clonal structure of these malignant cells. CellChat [19]was utilized to evaluate changes in intercellular communication strength and quantity.
2.3Collection of gene sets and calculation of FPIThe gene set associated with FA metabolism was retrieved from the msigdb database (https://www.gsea-msigdb.org/gsea/msigdb/). The gene set associated with immunotherapy-related pathways was obtained from Zu's article [20], while the gene set related to cell death was obtained from published articles and the msigdb database. Using GSVA [21] to evaluate the enrichment score of positive regulation or negative regulation of FA metabolism in the FA-related metabolic gene set, the difference between the positive regulation score and the negative regulation score is the FPI, which is used to evaluate the difference in FA metabolism intensity between samples.
2.4Immune microenvironment and immunotherapy analysisWe use GSVA to calculate ImmuneScore, StromalScore, ESTIMATEScore, and TumorPurity, the PCA method to calculate the quantitative calculation of DNA-methylated lymphocytes (MeTIL) [22], ssGSEA is used to assess the infiltration of immune cells in the immune microenvironment of each sample, and a heat map is used to display the results. After purifying the expression profiles with ISOpureR [23], pRRophetic [24] was used to predict the drug sensitivity of cancer samples based on the cell line expression profiles of CCLE (https://sites.broadinstitute.org/ccle) and the drug sensitivity data obtained from PRISM and CTRP.
2.5Machine learning builds the best prognostic modelBy combining RSF, Enet, StepCox, CoxBoost, plsRcox, superpc, GBM, survivalsvm, Ridge, and Lasso, ten algorithms with variable screening and prognostic model construction, we use TCGA-LIHC as the training set, ICGC-LIRI And GSE14520 is the validation set, use one algorithm for variable selection under the cross-validation framework and use another algorithm to build the prognosis model, and calculate the consistency index (C-index) of the used model combination on the external data set, and finally visualize the evaluation results of the model through the heat map, and calculate the correlation between the prediction model and the FPI in each data set.
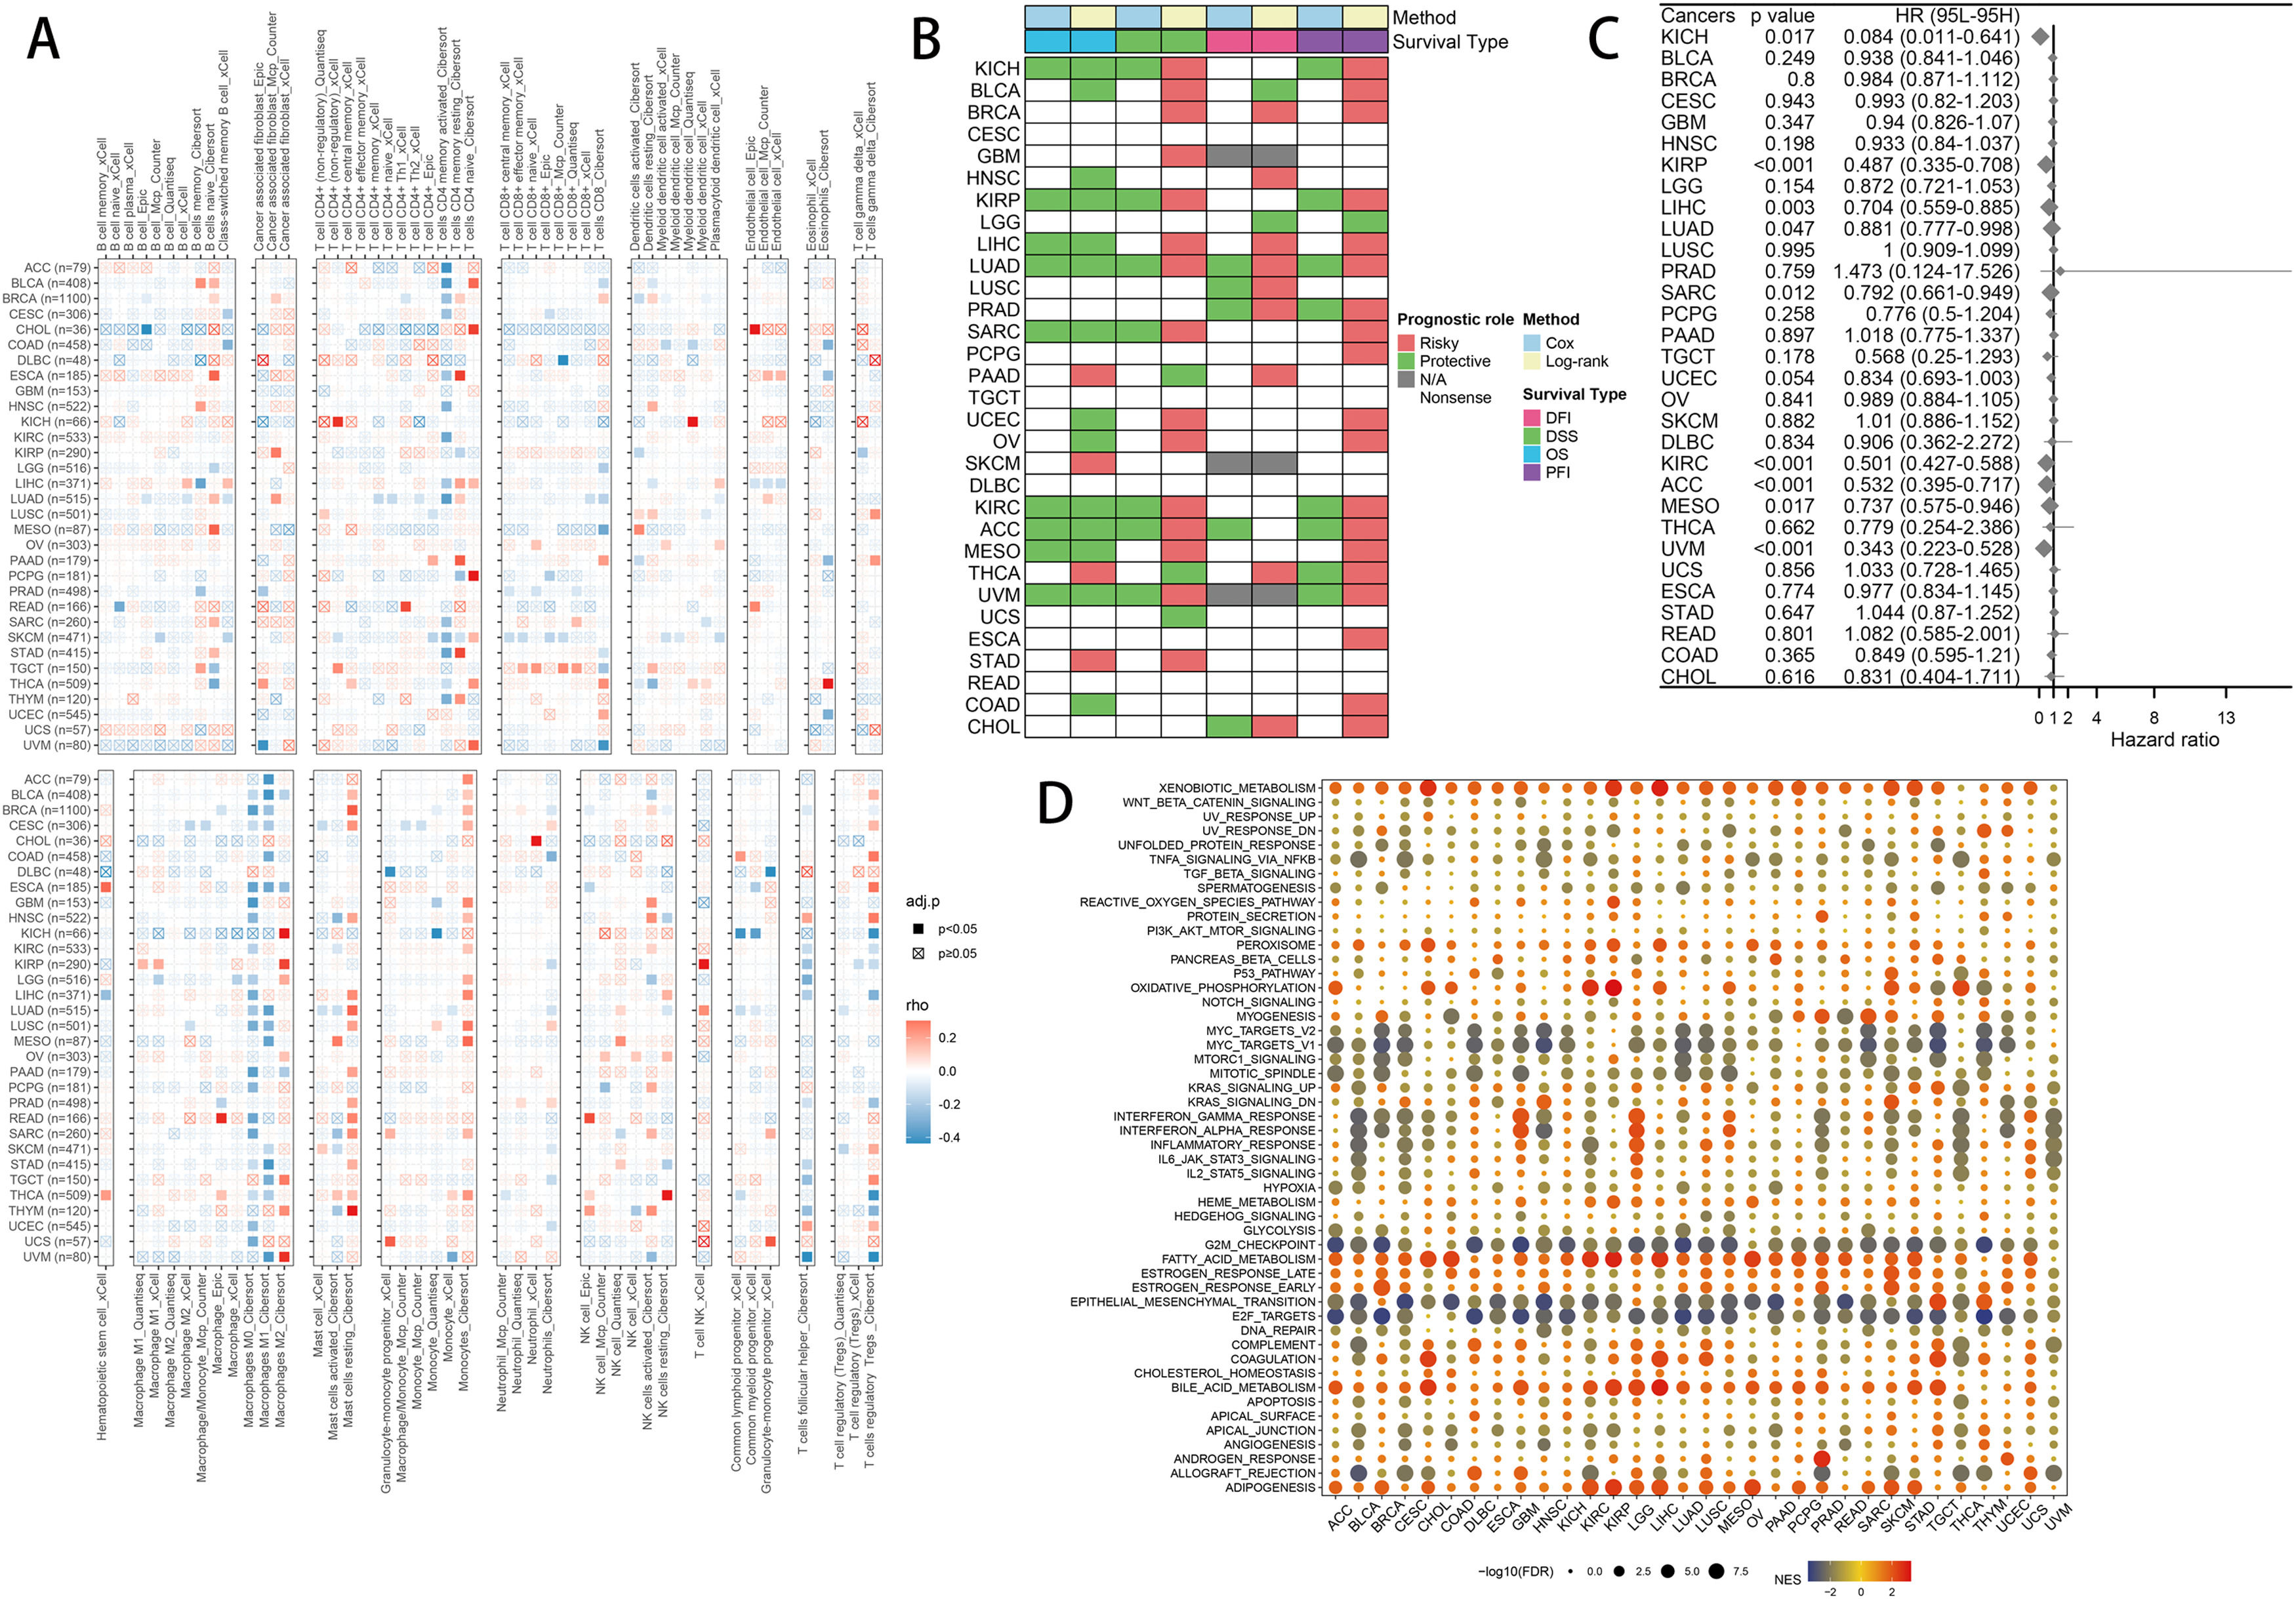
2.6Pancancer analysisImmune infiltration: Using Mcp Counter, Quantiseq, xCell, EPIC, and Cibersort, we compute the immune cell infiltration information of each tumor and visualize the relationship with FPI using a heat map. We calculated the relationship between FPI and DFI, DSS, OS, and PFI in pan-cancer using KM analysis, and the impact of FPI on OS in pan-cancer was determined using the univariate COX model. Functional enrichment: The samples were grouped according to the level of FPI, and then we performed differential expression analysis among the groups, and further used the results for GSEA enrichment analysis, which can infer the different roles of FPI in different tumors.
2.7Statistical analysisAll bioinformatics analyzes were performed using R software (v4.1.3). Correlations were analyzed using Fisher's exact test (for categorical data) and Pearson's correlation coefficient (for continuous variables). Statistical significance was defined when the P value was less than 0.05 (P < 0.05).
2.8Ethical statementsSince the data involved in this article are all from public databases, there are no potential ethical issues with this article.
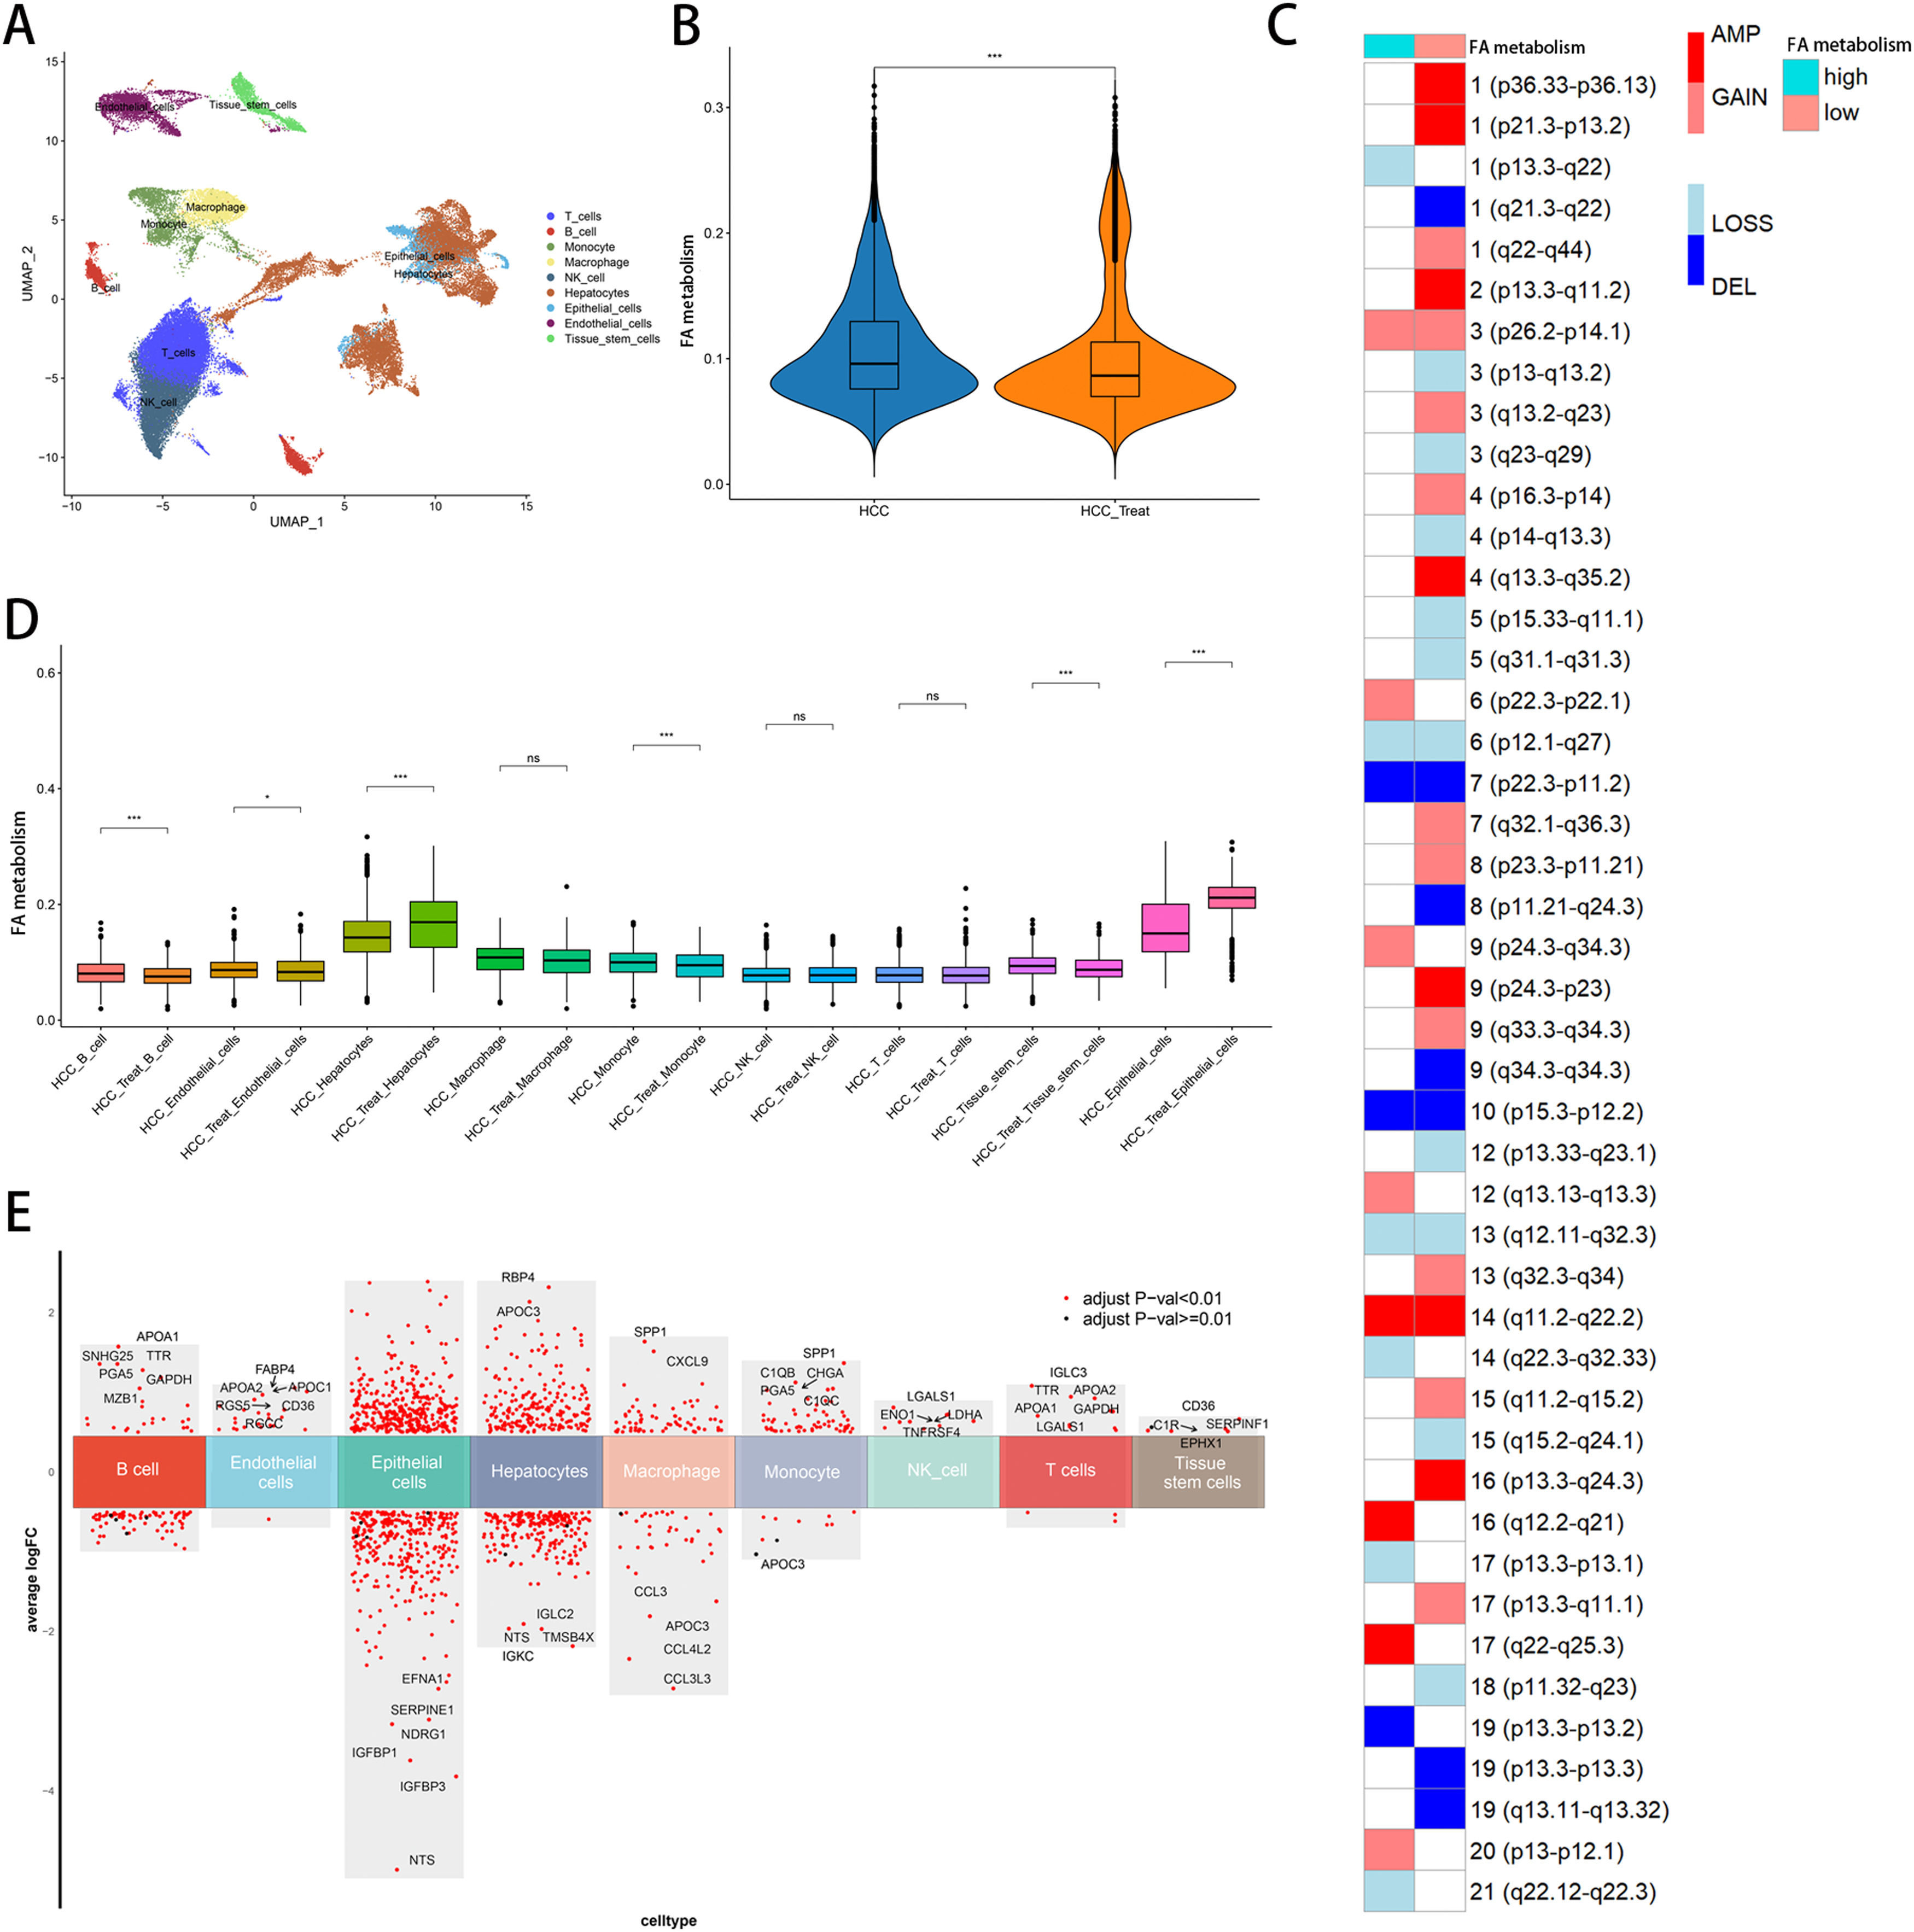
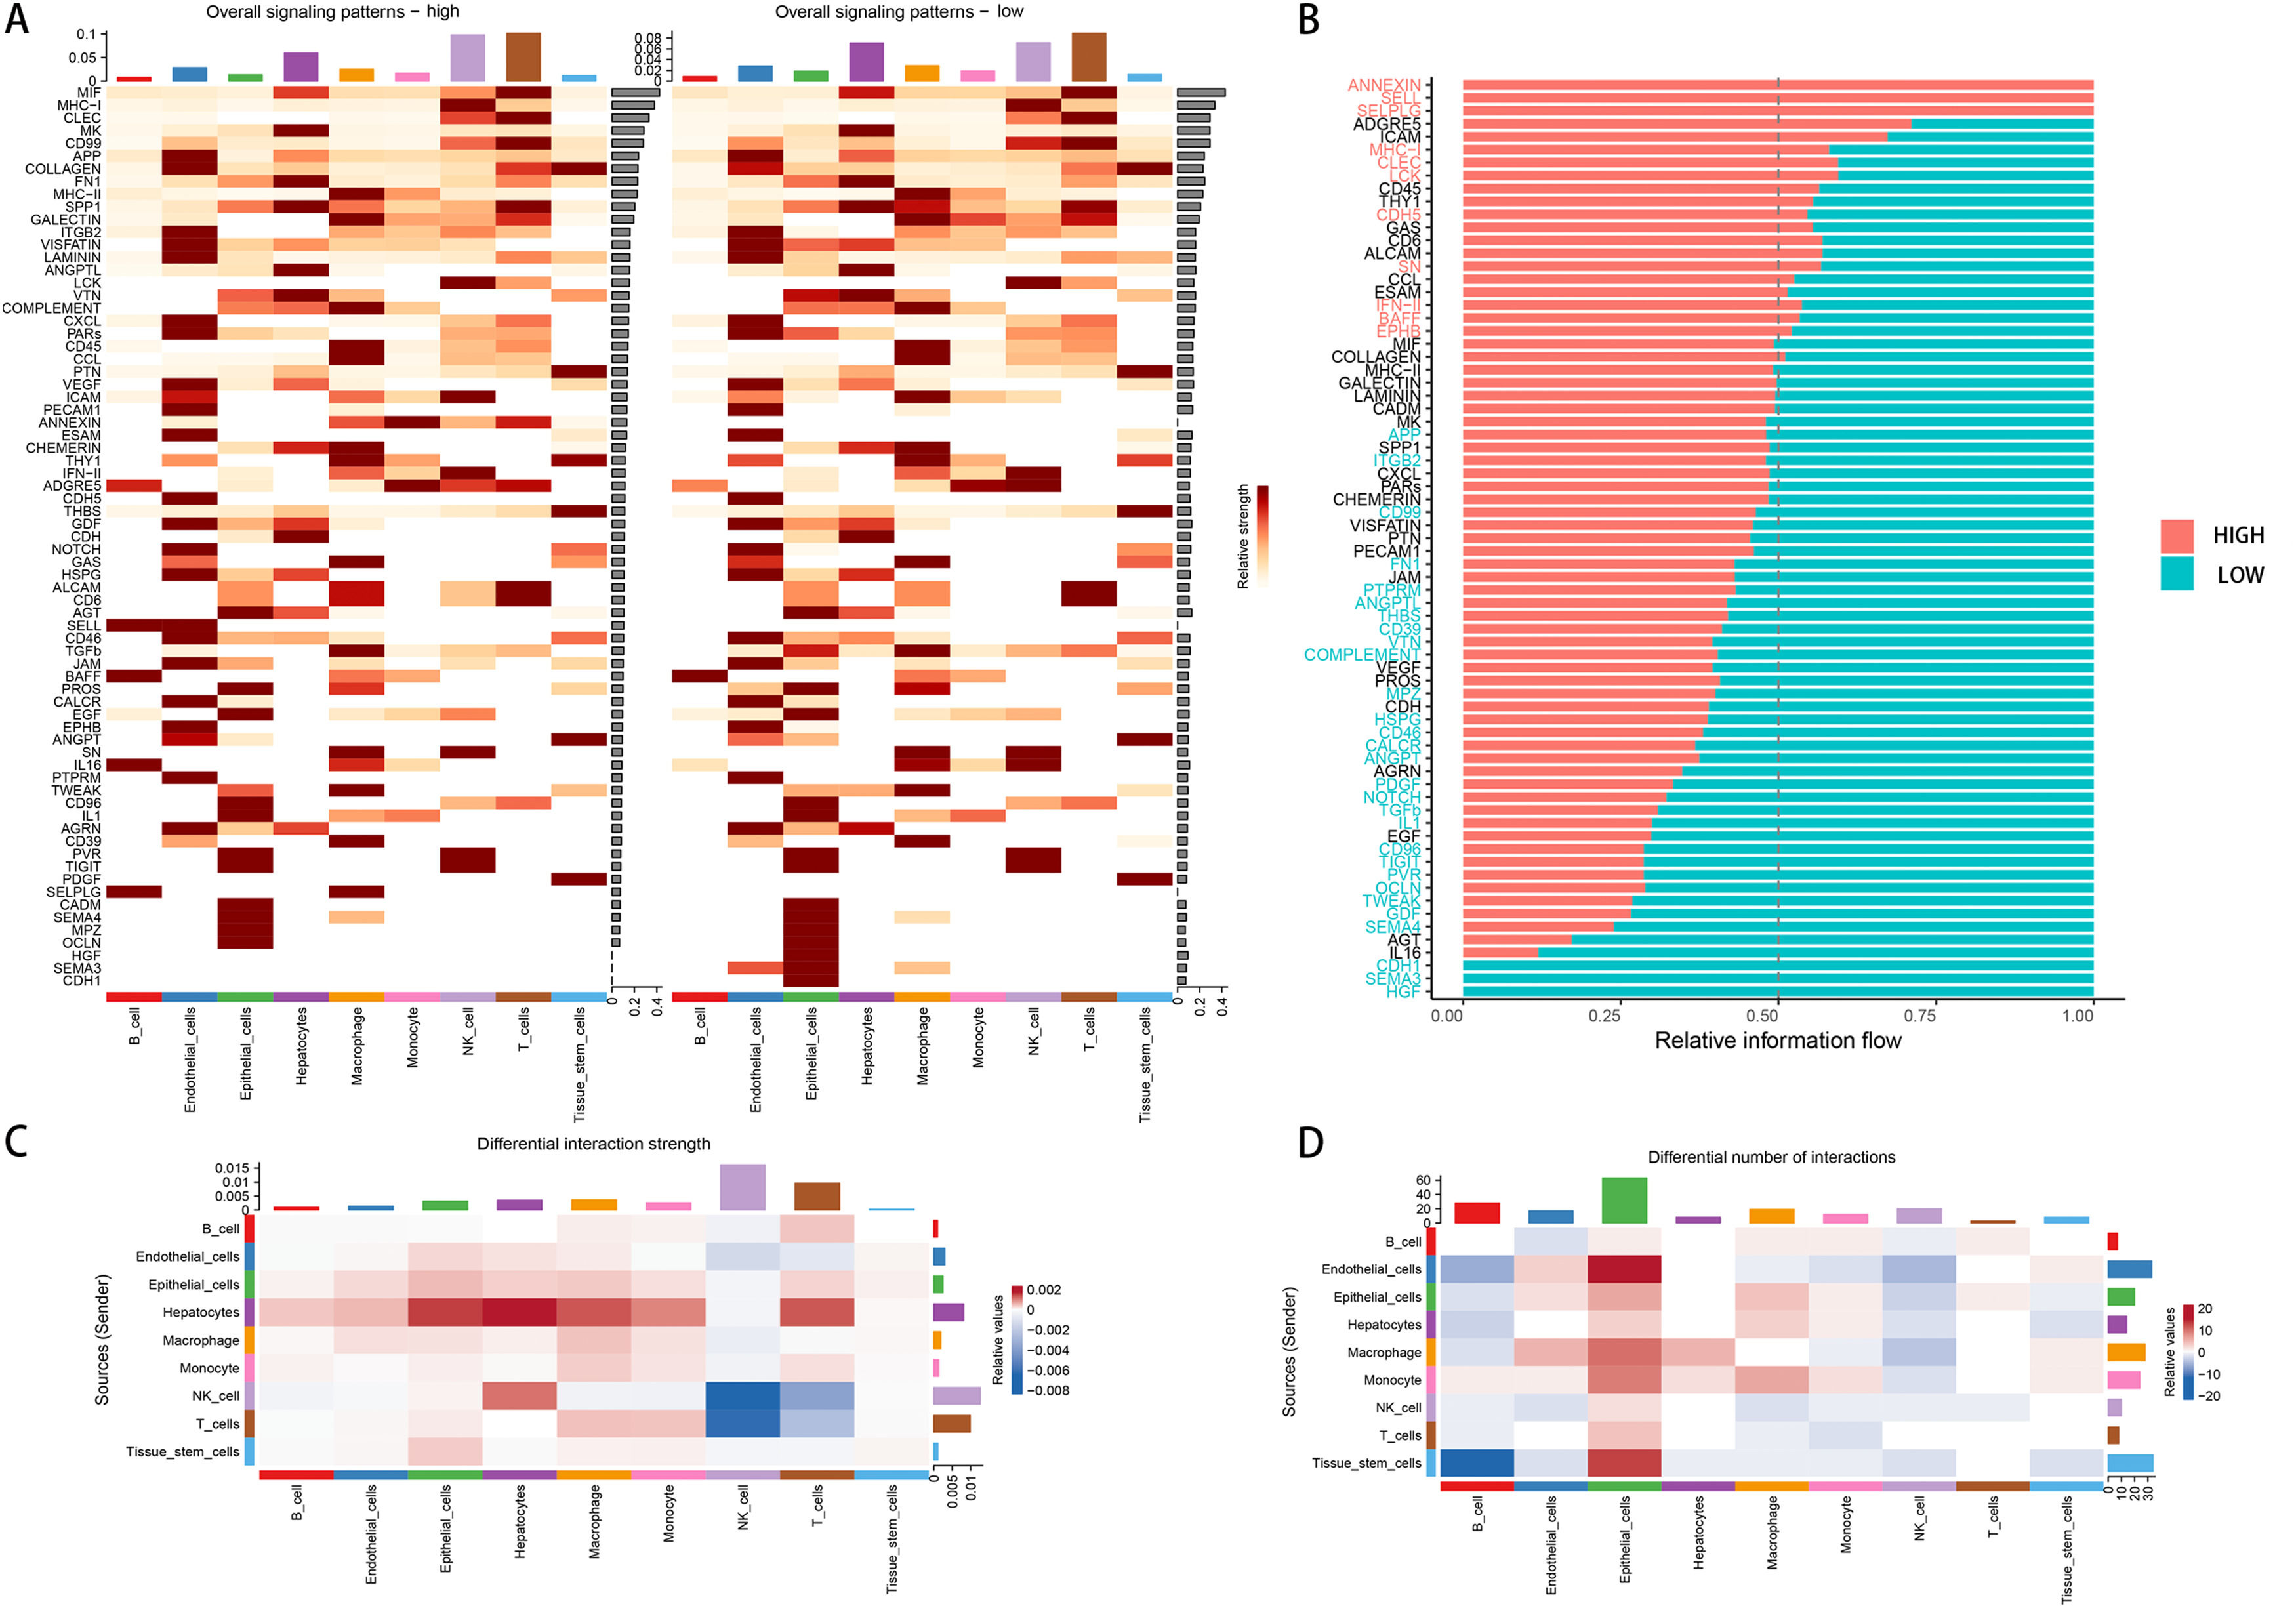
3Results3.1Single-cell analysisIn the single-cell data set GSE151530, we identified nine different cell types based on the expression of different surface markers in different clusters, namely T cell, B cell, monocyte, macrophage, NK cell, hepatocyte, endothelial cell, epithelial cell, and tissue stem cell (Fig. 1A). The lower level of FA metabolism in the treated HCC sample (HCC_Treat) (Fig. 1B) suggests that the treatment process of HCC is also a process of escaping from the disorder of FA metabolism. The FA metabolism levels of B cell, endothelial cell, monocyte, and tissue stem cell FA metabolism levels decreased significantly after treatment, while hepatocyte and epithelial cell FA metabolism levels increased significantly after treatment (Fig. 1 D). Regardless of whether received treatment, HCC samples with a low FA metabolism had a higher level of malignancy and a higher probability of gene copy number variation (Fig. 1C). By analyzing the difference between cells with different levels of FA metabolism (Fig. 1E) and performing GSEA functional enrichment analysis, we discovered that T cells were not enriched into meaningful pathways, endothelial cells and tissue stem cells could only enrich individual pathways, and FA metabolism has a greater effect on the life activities of epithelial cell, B cell, and hepatocyte cells (Supplementary Figure 1). We also discovered that differences in FA metabolism influence intercellular communication between different cells, affecting not only the level of intercellular signaling factors but also the intensity and quantity of intercellular communication (Fig. 2A-D).
 Annotation of cells. (B) FA metabolism levels in samples before and after treatment. (C) Malignancy levels of different FA metabolism groups. (D) FA metabolism levels of different cells before and after treatment. (E) Differential genes between cells of different FA metabolism.(FA: fatty acids).")
Single-Cell Analysis. (A) Annotation of cells. (B) FA metabolism levels in samples before and after treatment. (C) Malignancy levels of different FA metabolism groups. (D) FA metabolism levels of different cells before and after treatment. (E) Differential genes between cells of different FA metabolism.(FA: fatty acids).
 Overall signaling patterns under different FA metabolism levels. (B) Changes of signaling molecules at different levels of FA metabolism. Changes in the strength (C) and number (D) of cellular communication at different levels of FA metabolism.")
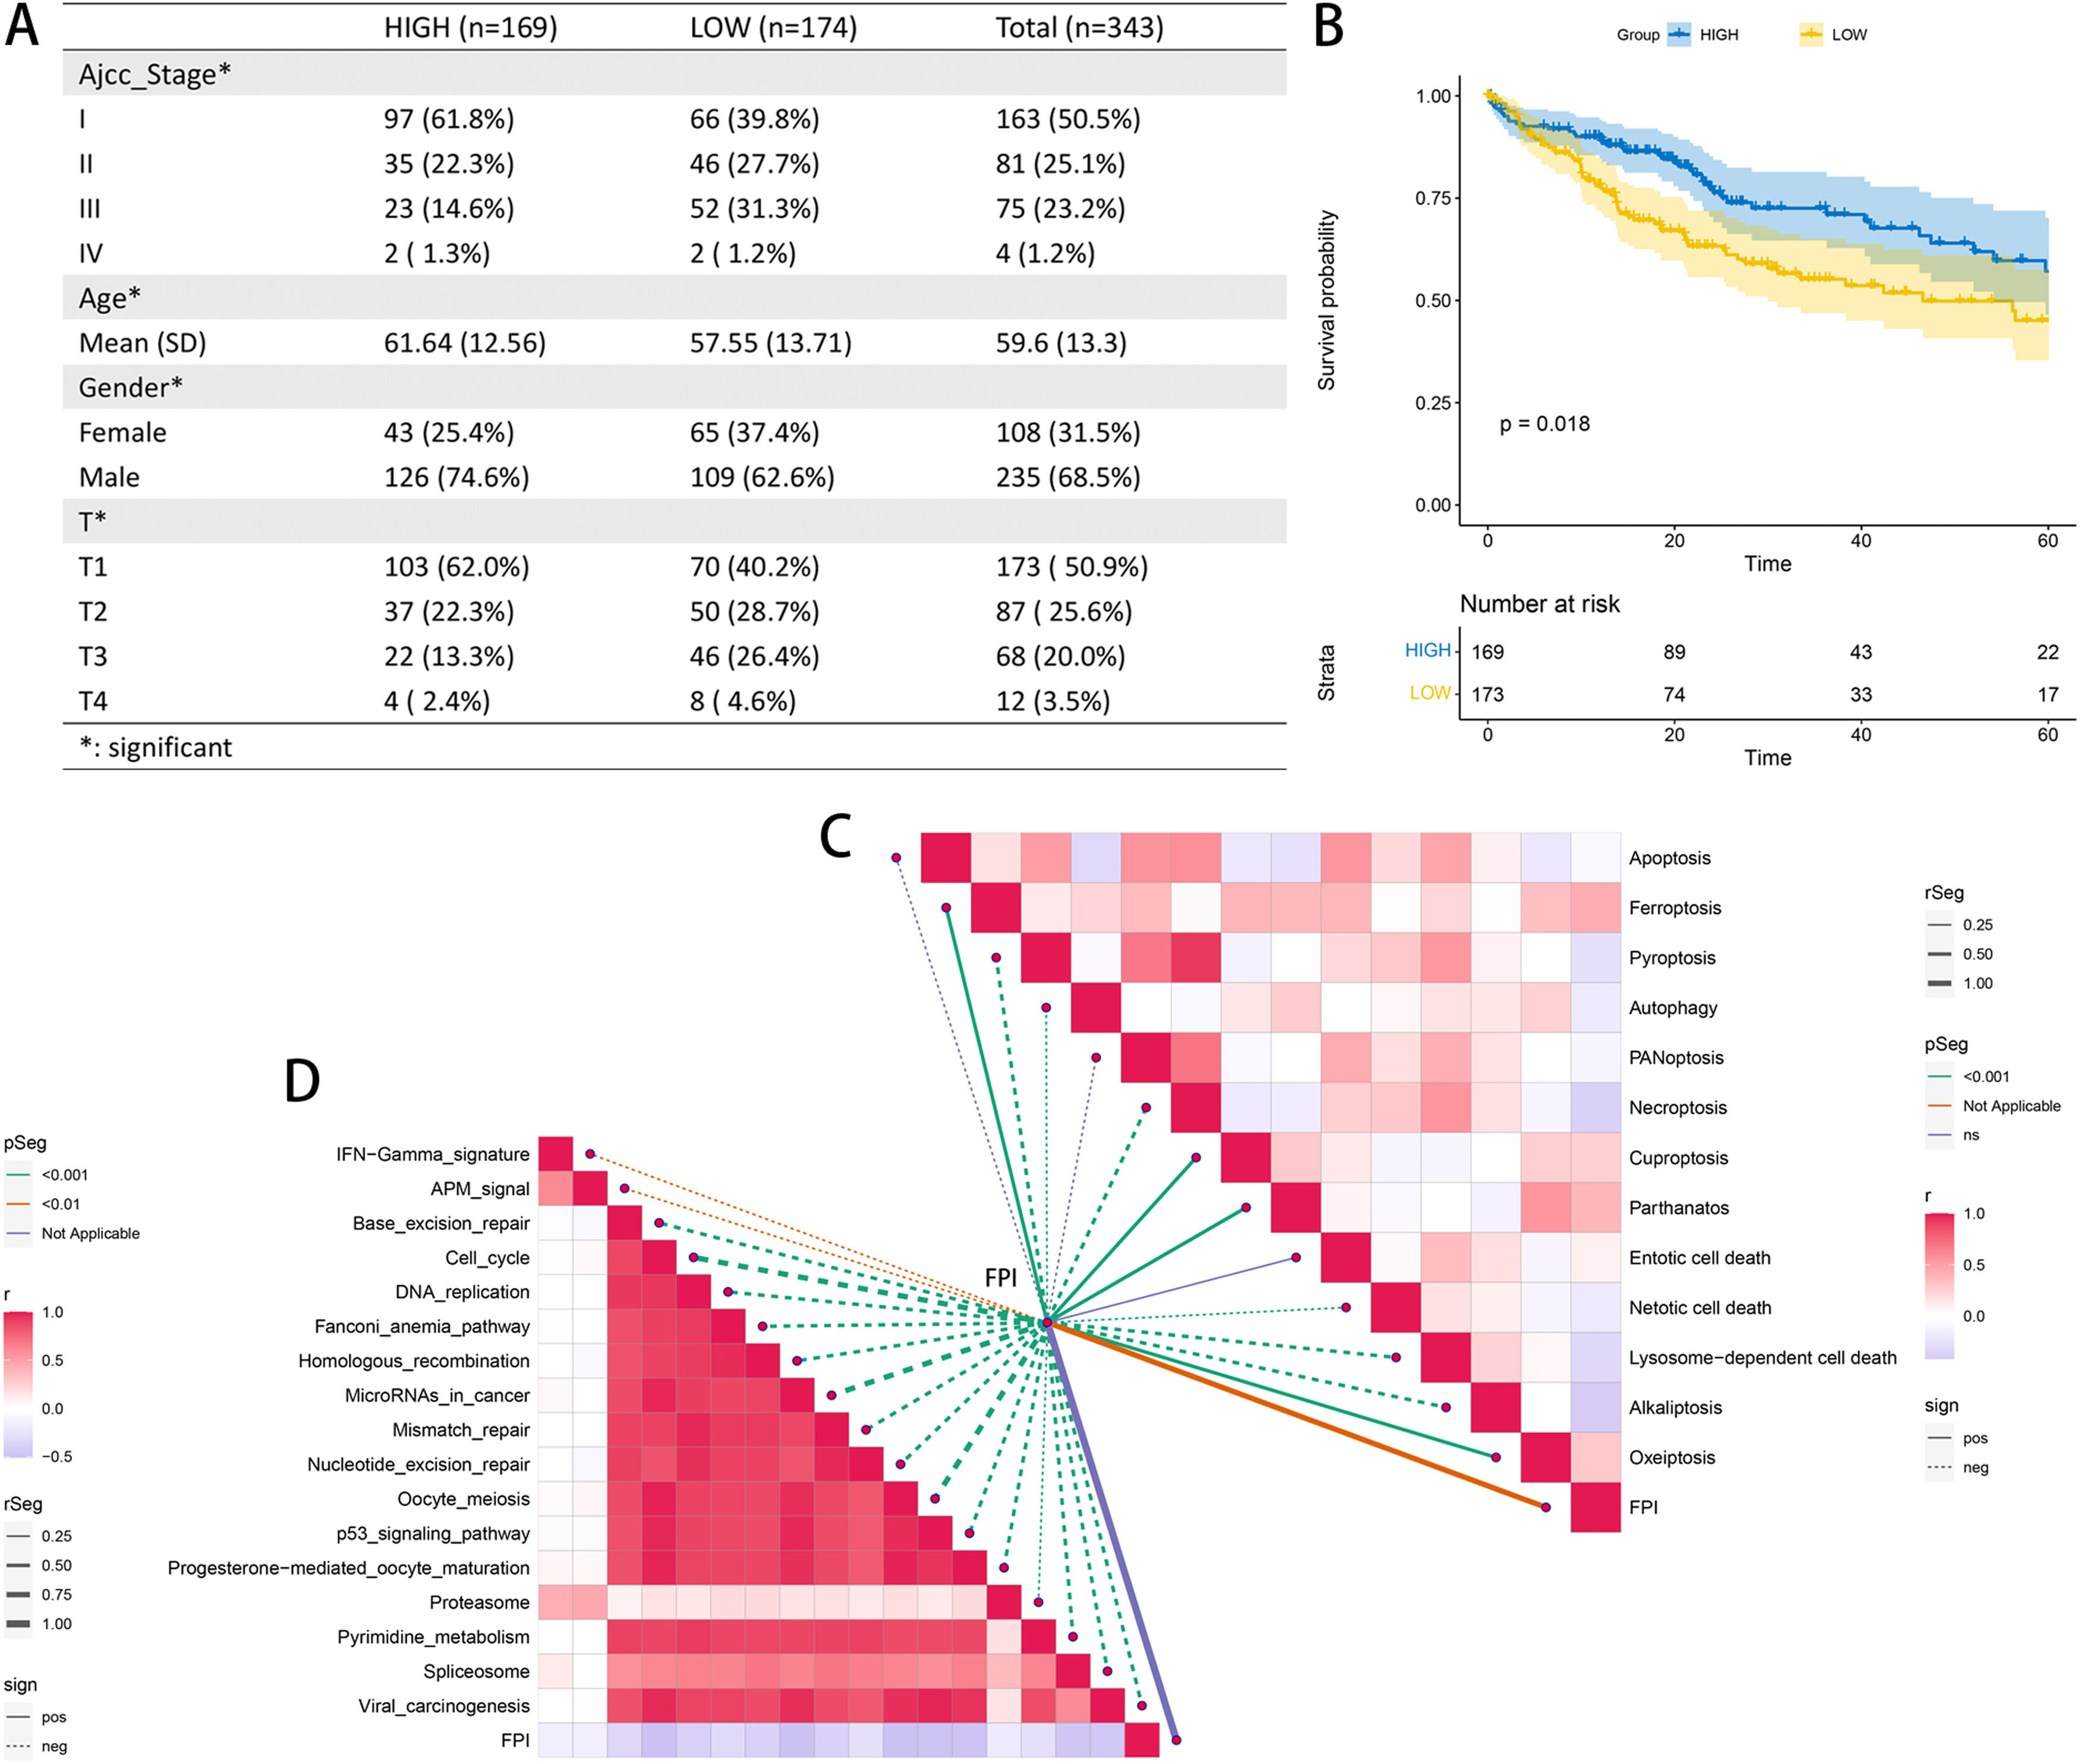
The samples in the TCGA-LIHC cohort with an FPI greater than 0 were classified as belonging to the high FA metabolism group, while the remaining samples were classified as belonging to the low FA metabolism group. Through additional analysis of the clinicopathological data, we determined that patients in the group with a high FA metabolism had a greater prevalence of cancer. The low proportion of pathological stages (AJCC-stage and T stage), the age of diagnosis is also significantly older than the low FA metabolism group (Fig. 3A), KM survival analysis also confirmed that patients with high FA metabolism level have a better prognosis (Fig. 3B), and the KM survival analysis for each subgroup also supports this trend, especially in younger than 60 years old or higher AJCC stage, or higher T stage, or Asian patients and male patients (Supplementary Figure 2). Concurrently, we also analyzed the relationship between FPI and 13 cell death methods and the immunotherapy-related pathways. We discovered that although FPI is weakly associated with the majority of cell death mechanisms, it has a significant negative correlation with nearly all immunotherapy-regulated pathways.
3.3Effects of FPI on the immune microenvironment. Prognostic analysis of patients with different FPI levels (B). Correlation analysis between FPI and various cell death modes (C). Correlation analysis between FPI and potential pathways of immunotherapy (D).")
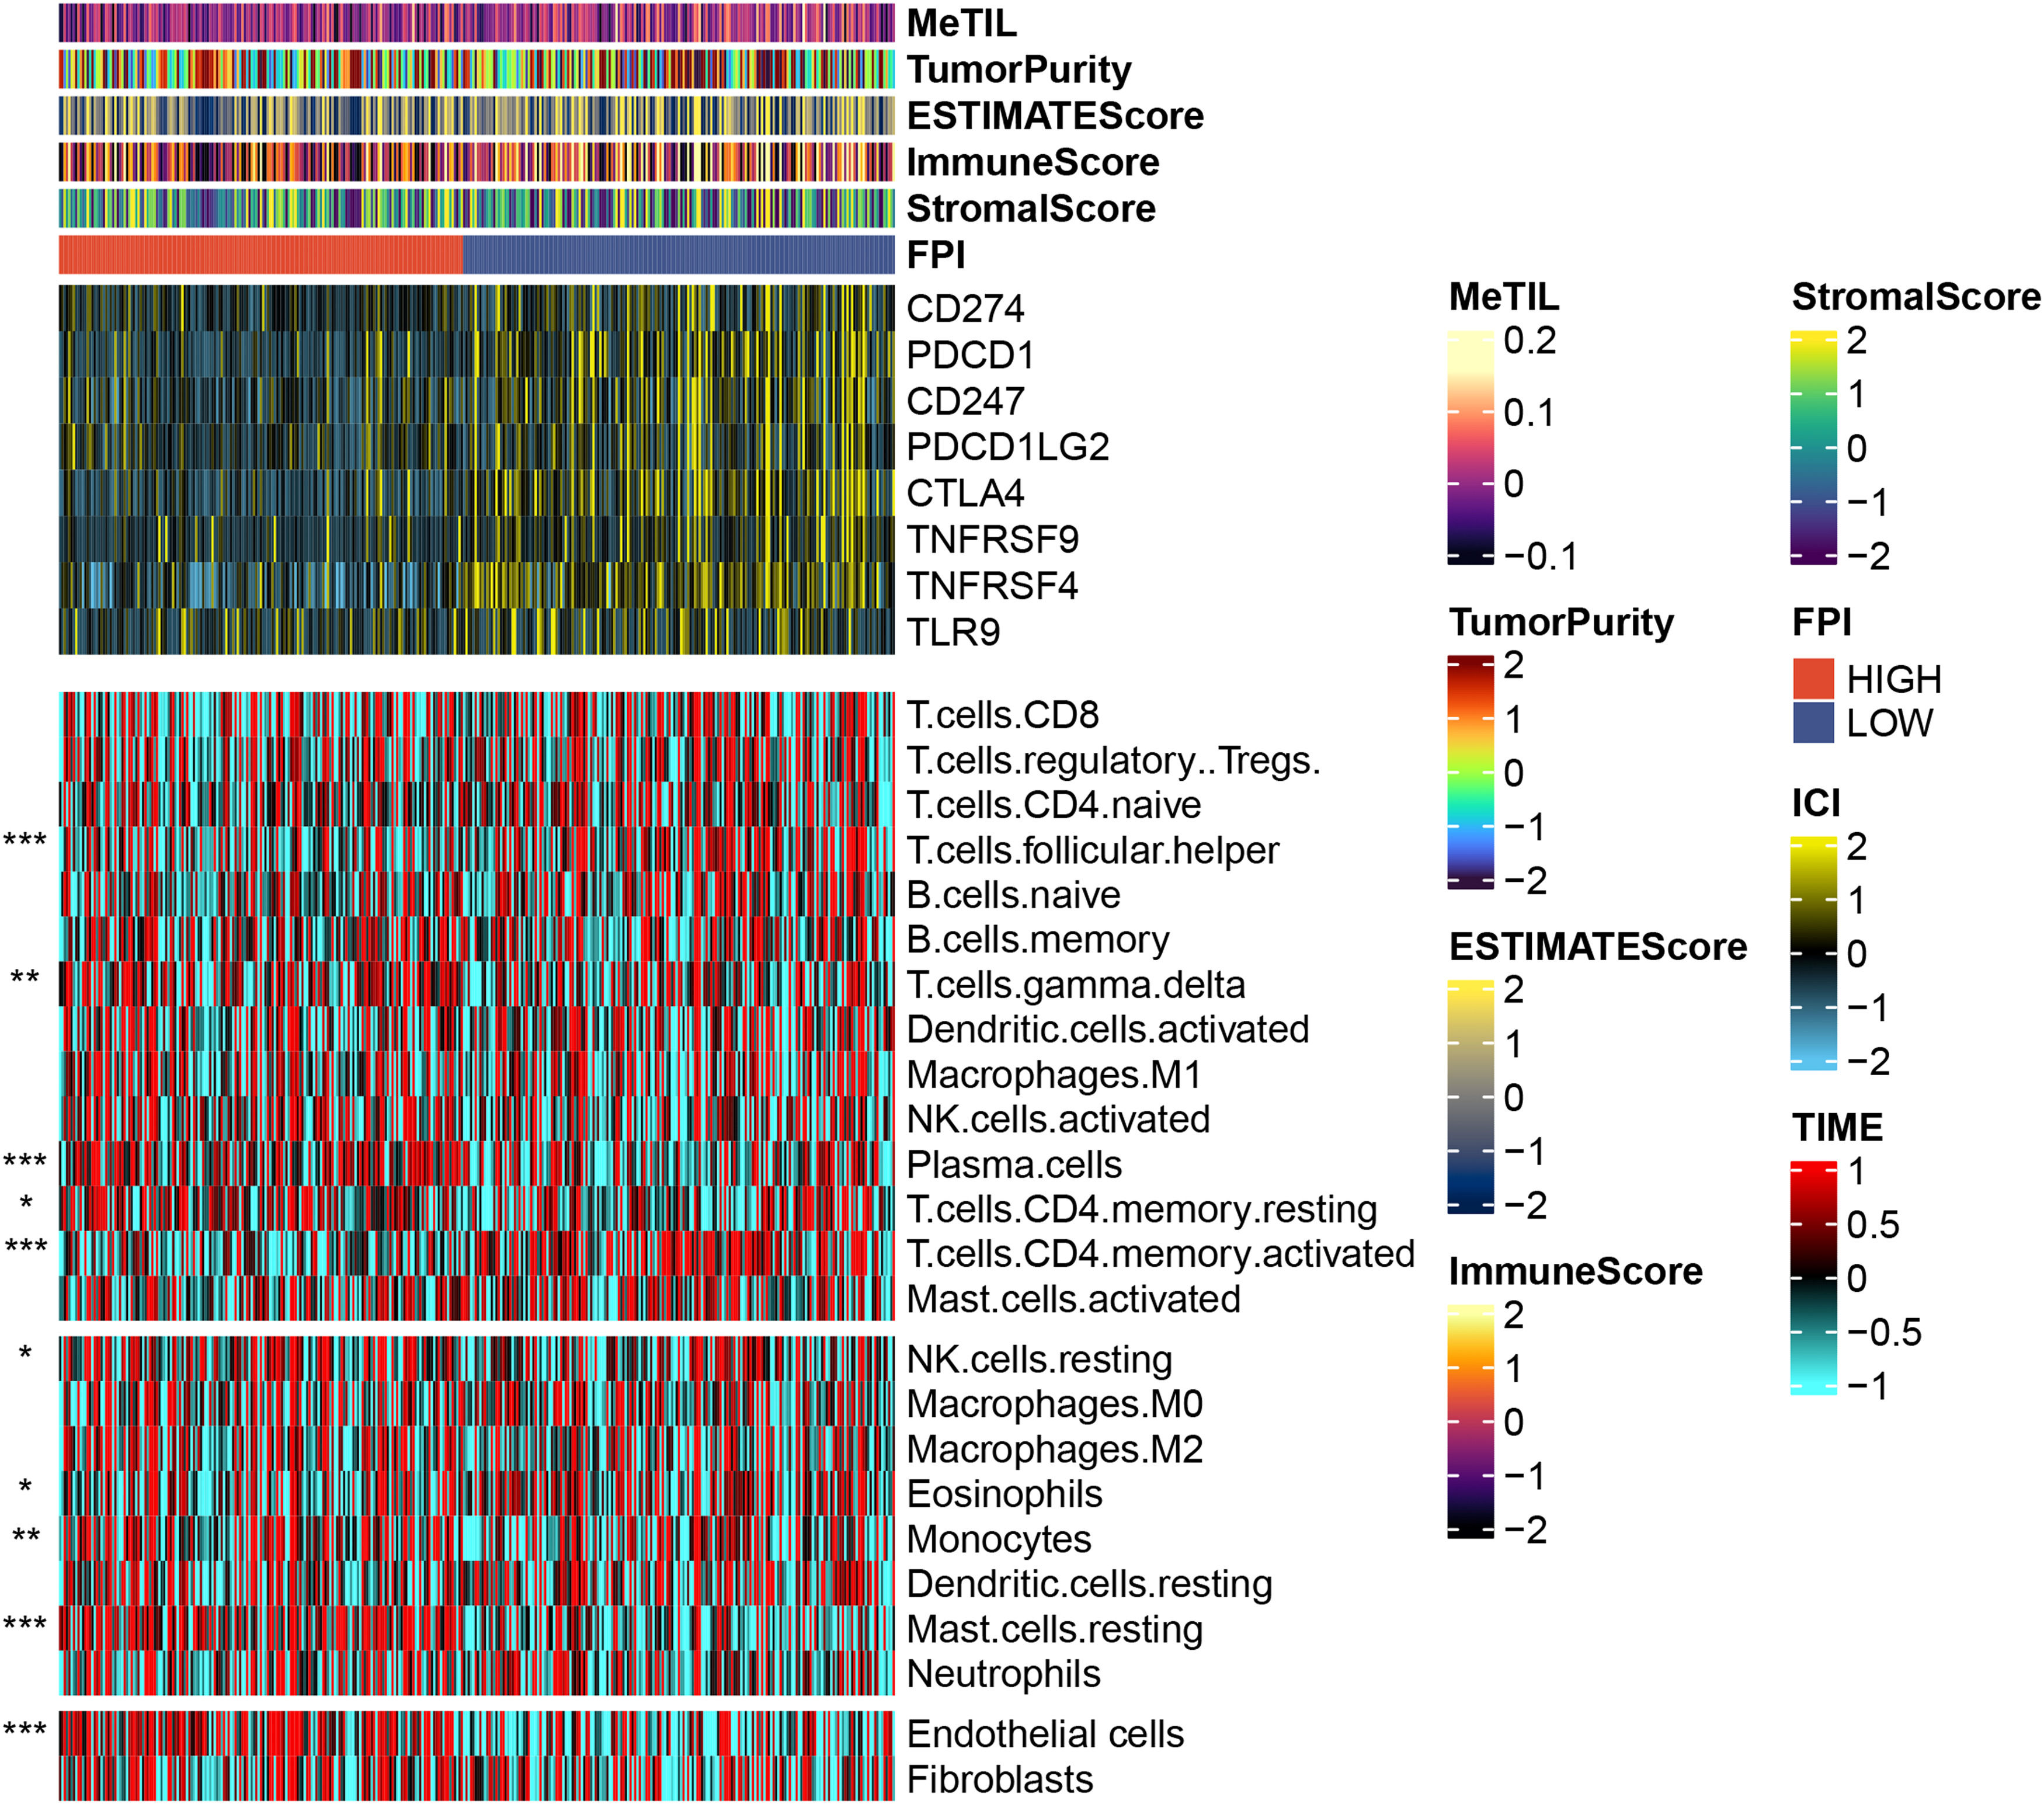
Through the analysis of the tumor immune microenvironment, we also found that although FPI is weakly correlated with some common tumor scoring systems, samples with low FA metabolism levels have higher expression on some common immune checkpoints, such as CD274, PDCD1, CTLA4, TNFRSF4, etc., echoing the previous conclusion that low FA metabolism level is associated with increased malignancy and a poor prognosis. The level of FA metabolism was negatively correlated with T cell focal helper, T cells CD4 memory activated, and Eosinophils, but clearly positively correlated with T cell gamma delta, Plasma cells, T cells CD4 memory resting, NK cells resting, Monocytes, Mast cells resting, and Endothelial cells (Fig. 4).
3.4Drug sensitivity and immunotherapy responsiveness
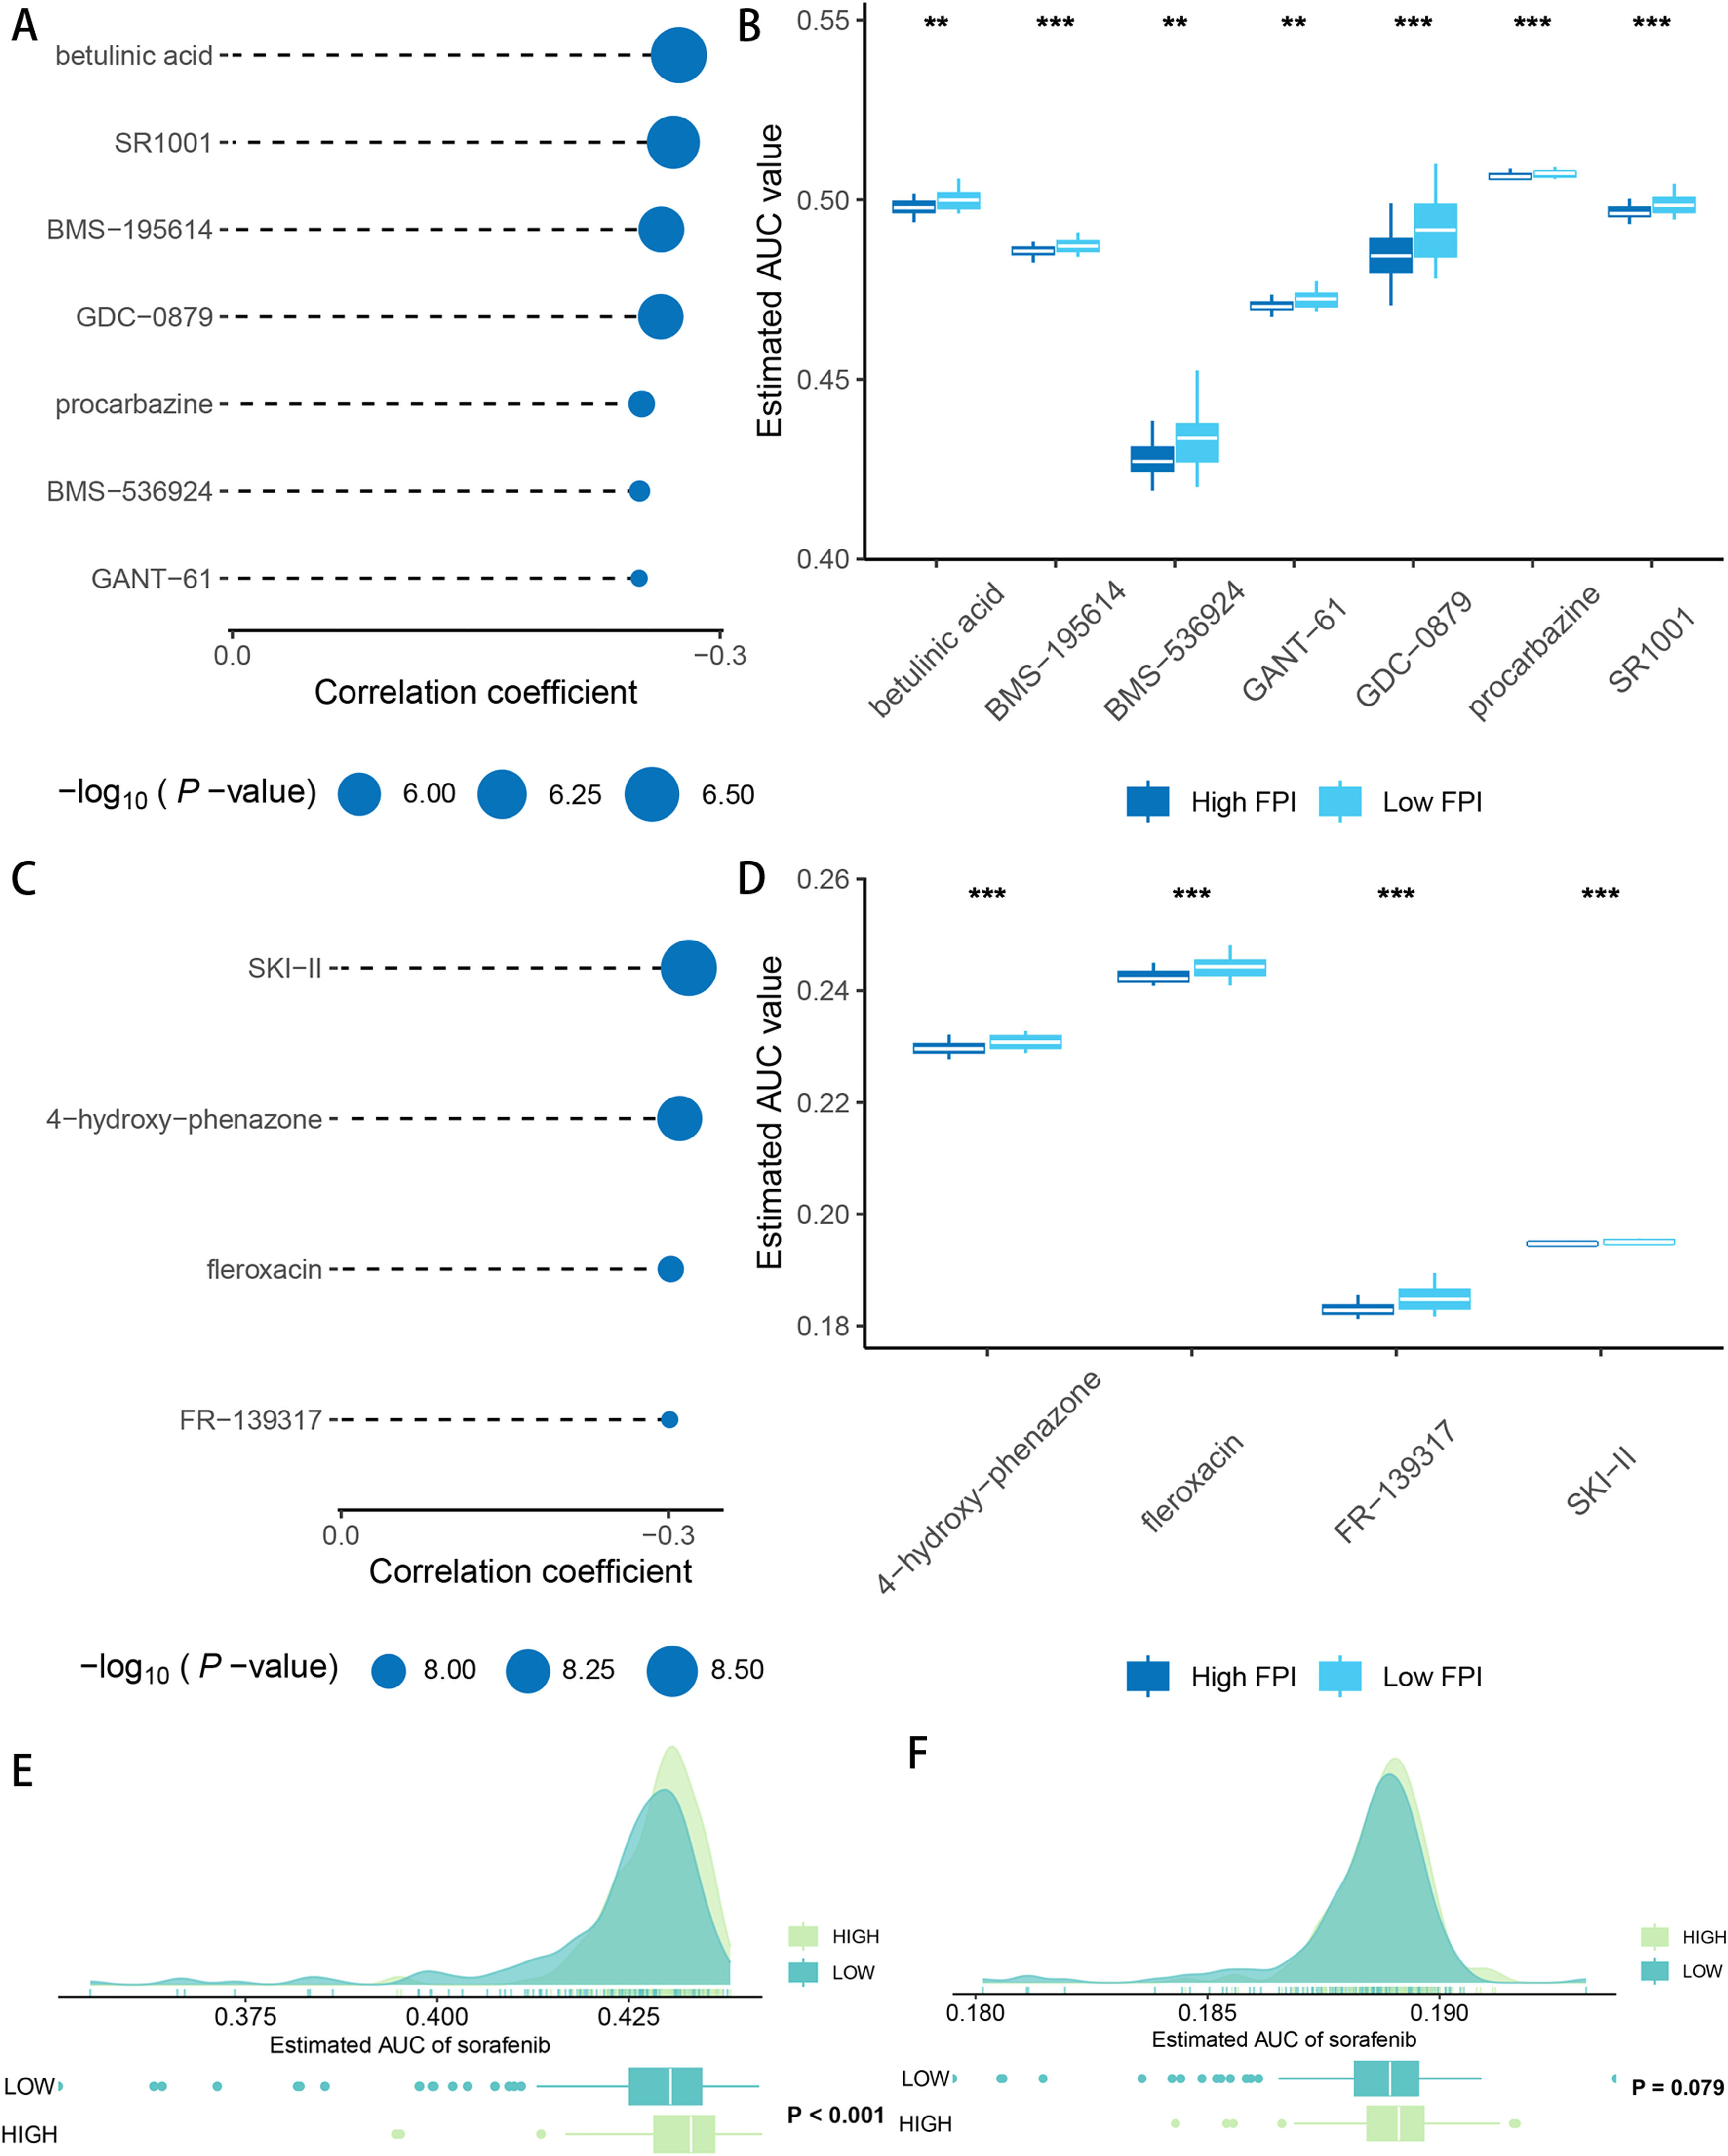
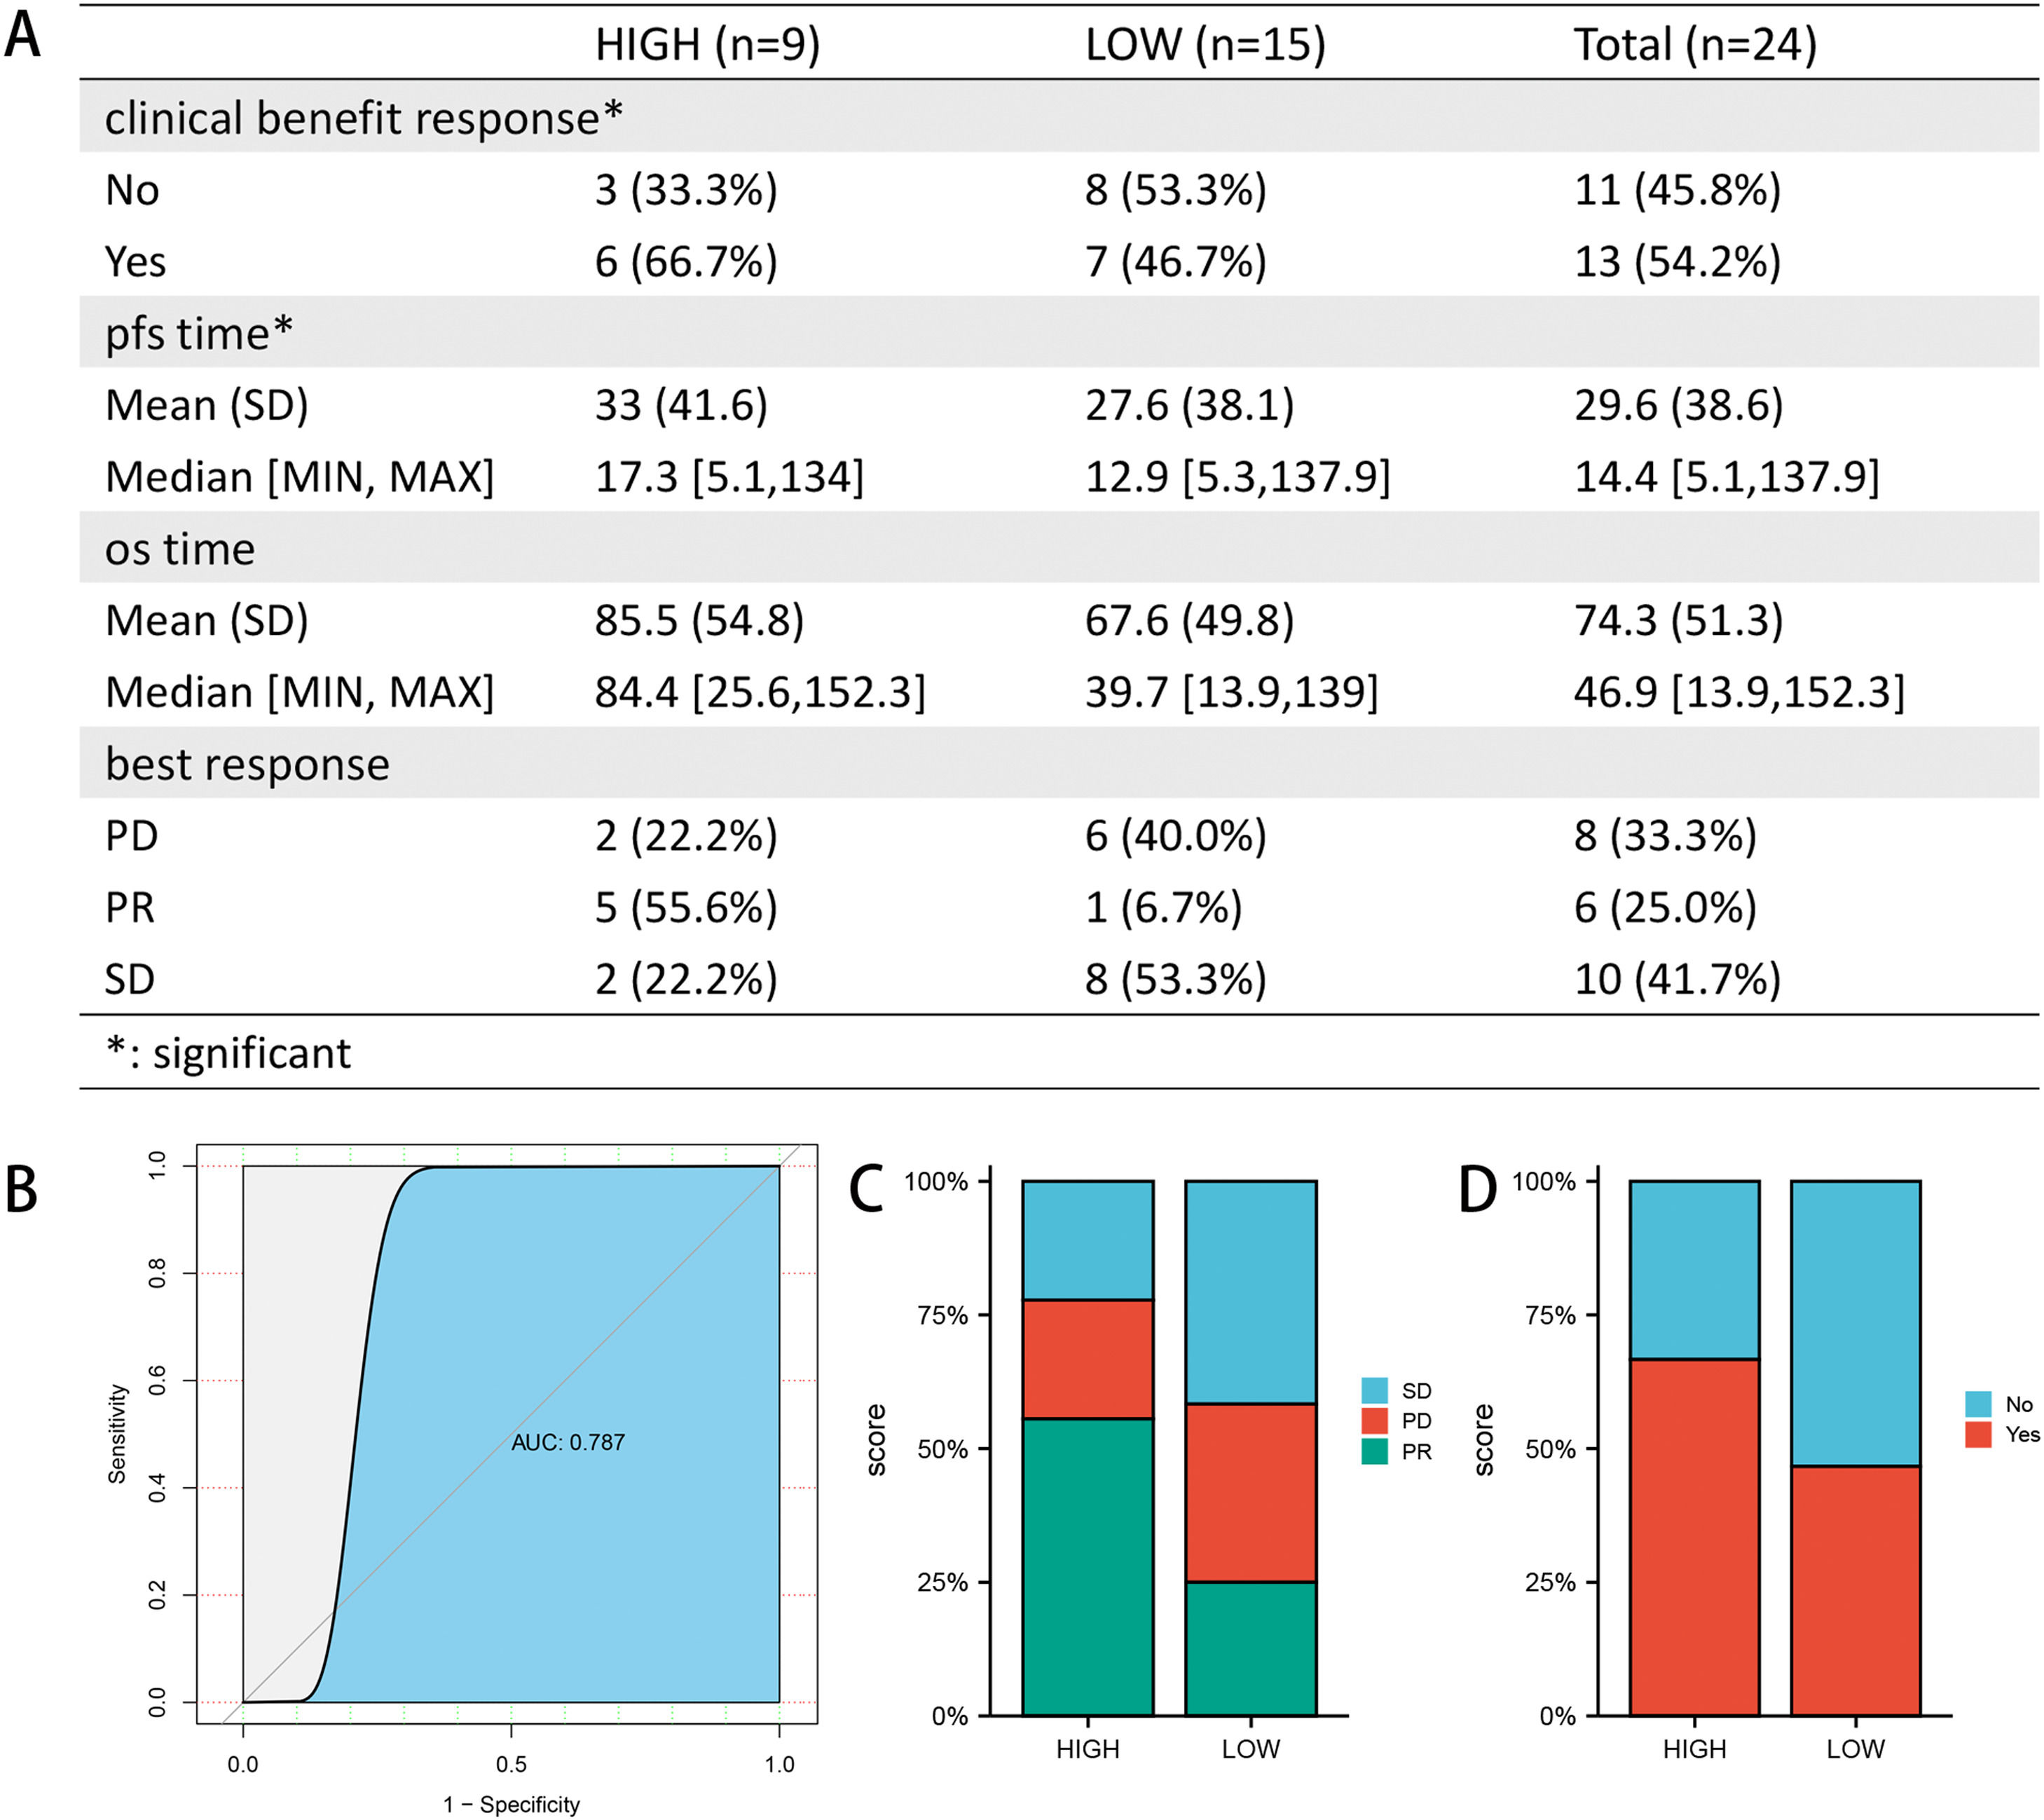
After drug sensitivity prediction on the purified expression matrix, we determined that the drugs with significant differences in sensitivity between the two groups at different levels of FA metabolism were betulinic acid, SR1001, BMS-195,614, GDC-0879, procarbazine, BMS-536,924, GANT-61 (CTRP database) (Fig. 5A, B), whereas data from PRISM indicated that the drugs with higher sensitivity differences were SKI-II, 4‑hydroxy-phenazone, fleroxacin, FR-139,317 (Fig. 5C, D). We also investigated the relationship between FA metabolism and sorafenib sensitivity and found that the group of individuals with a high FA metabolizer rate had a higher sensitivity in both databases (Fig. 5E, F). To further investigate the association between FPI and immunotherapy responsiveness, we analyzed GSE140901 and discovered that the high FA metabolism group had a better clinical benefit response and best response. Similarly, the PFS time and OS time of the low FA metabolism group were significantly shorter than those of the high FA metabolism group (Fig. 6).
. Sensitivity analysis of sorafenib in HCC patients under different FPI groups (E: CTRP database; F: PRISM database).(FPI: fatty acid prediction index).")
. ROC curves were used to examine the predictive power of FPI for PR (B). Composition of best response (C) and clinical benefit response (D) of different FPI groups. SD, stable disease; PD, progressive disease; PR, partial response.")
Association of FPI with immunotherapy responsiveness and prognosis (A). ROC curves were used to examine the predictive power of FPI for PR (B). Composition of best response (C) and clinical benefit response (D) of different FPI groups. SD, stable disease; PD, progressive disease; PR, partial response.
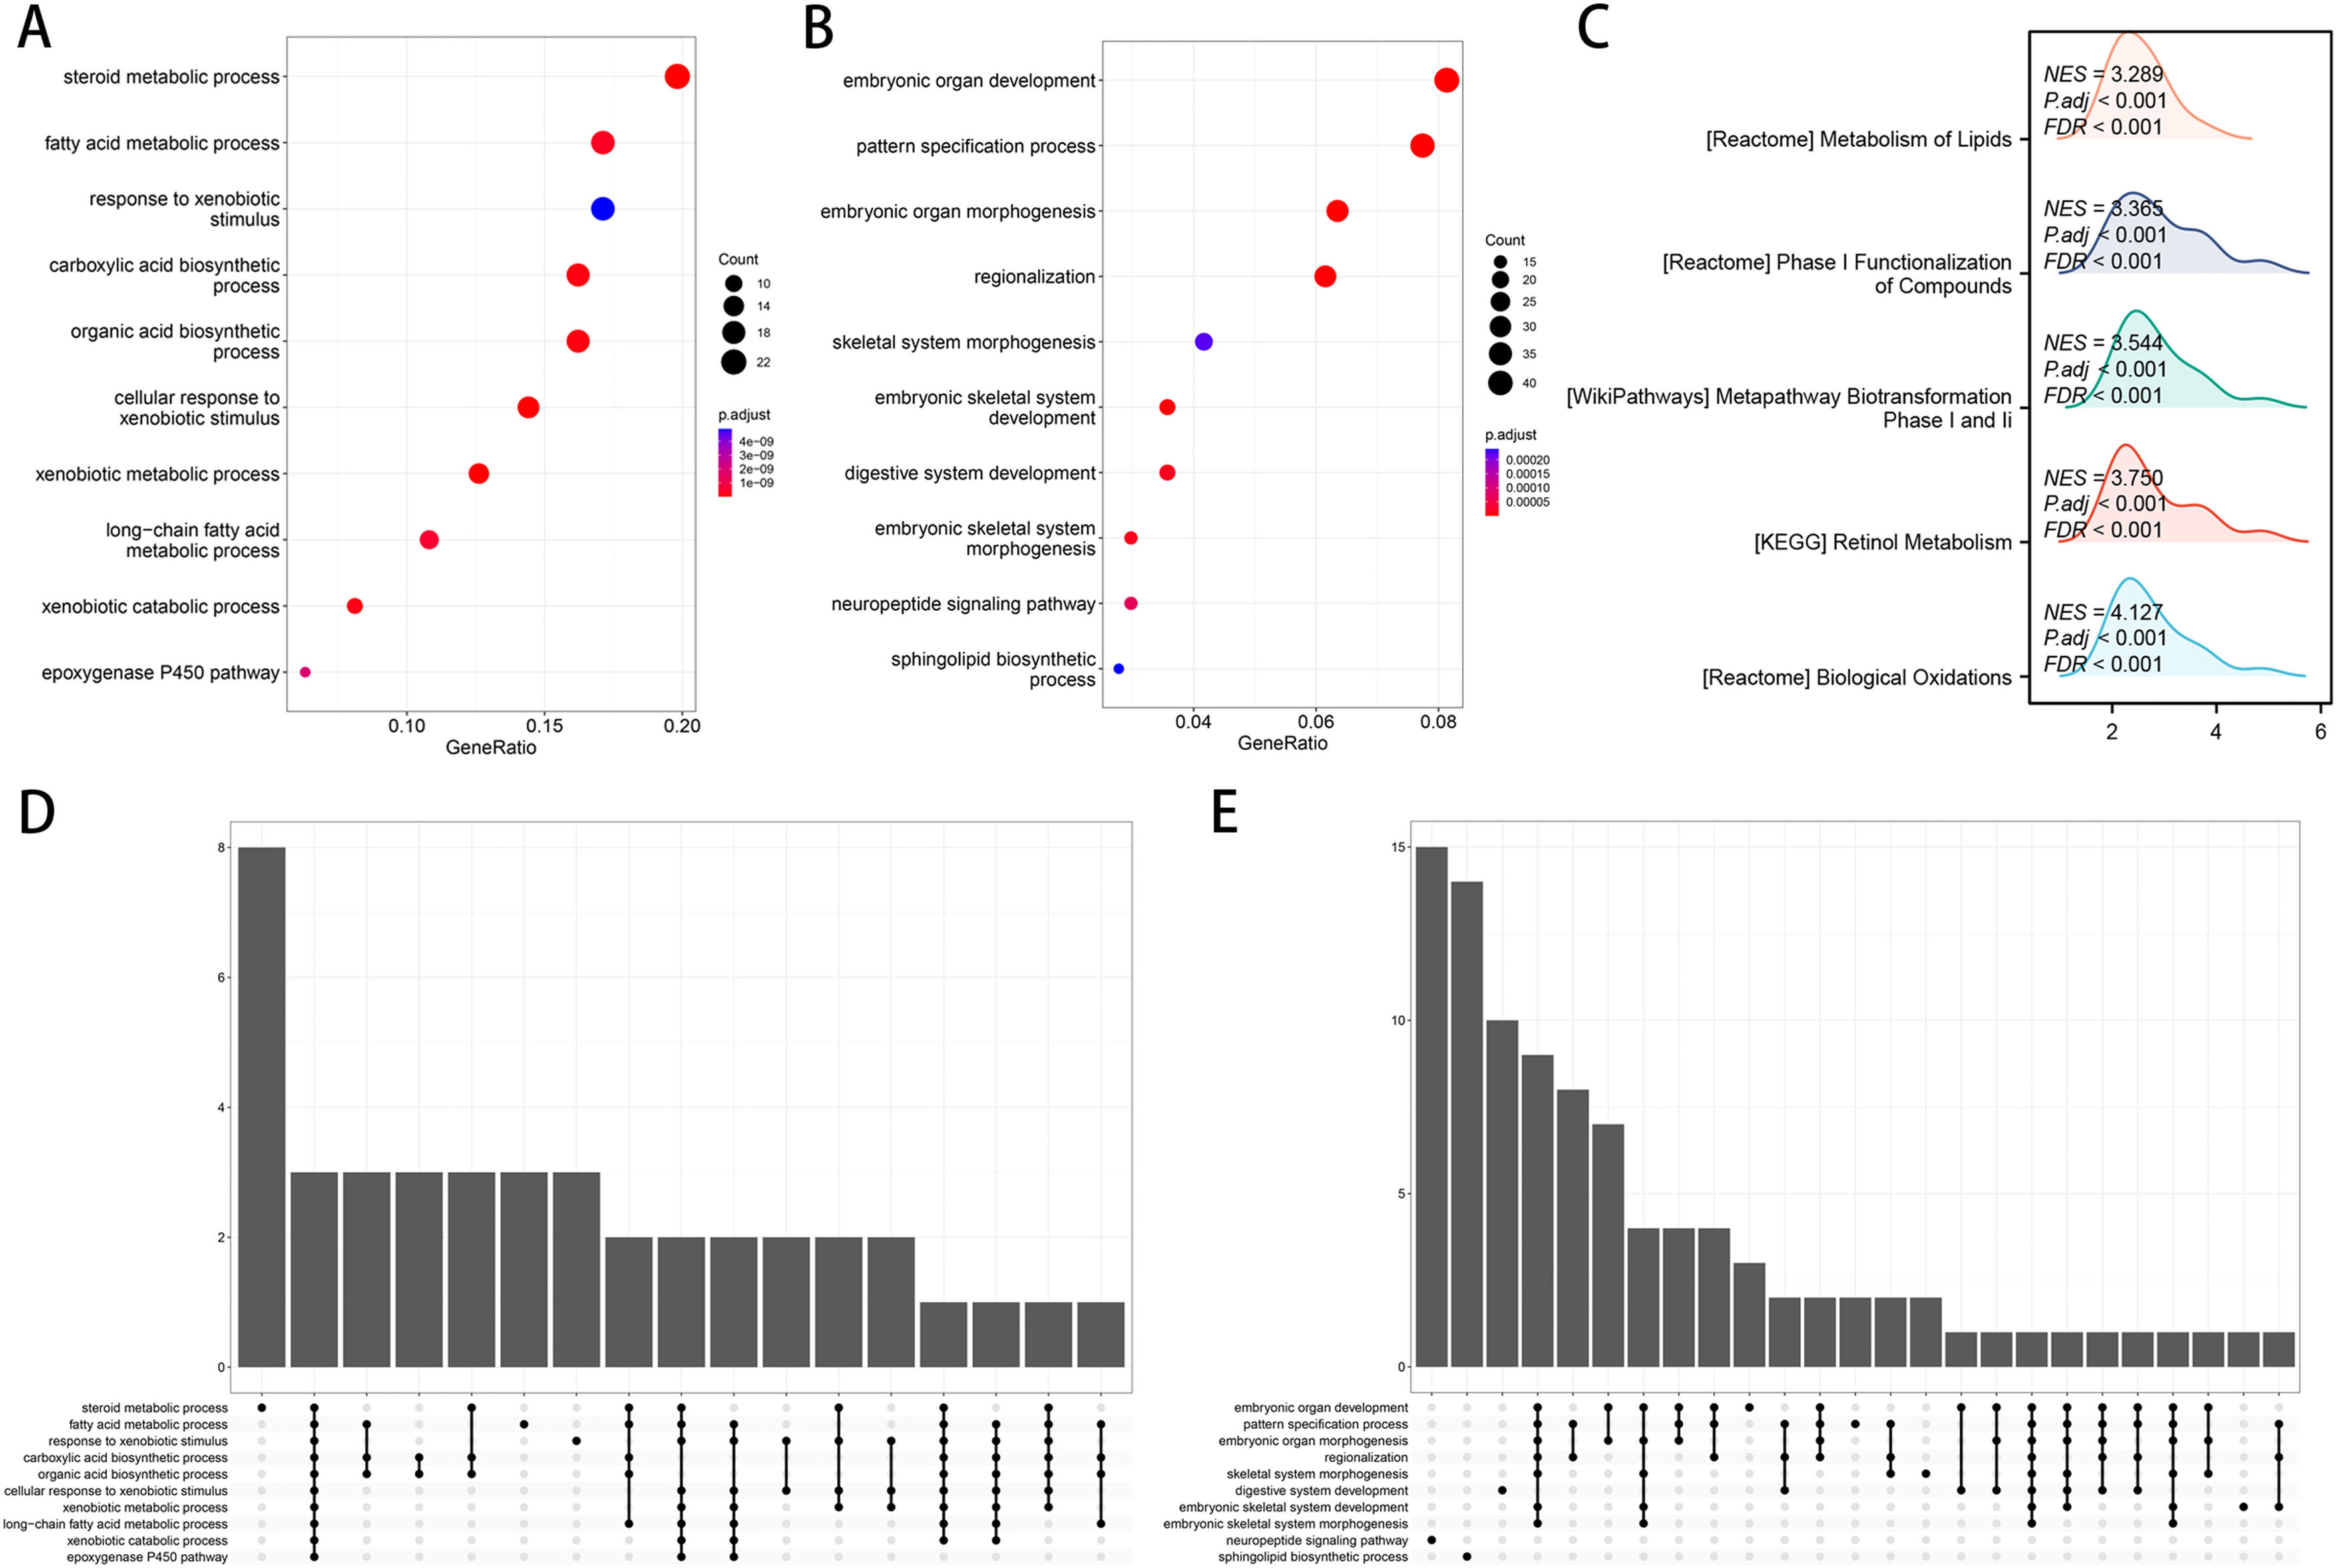
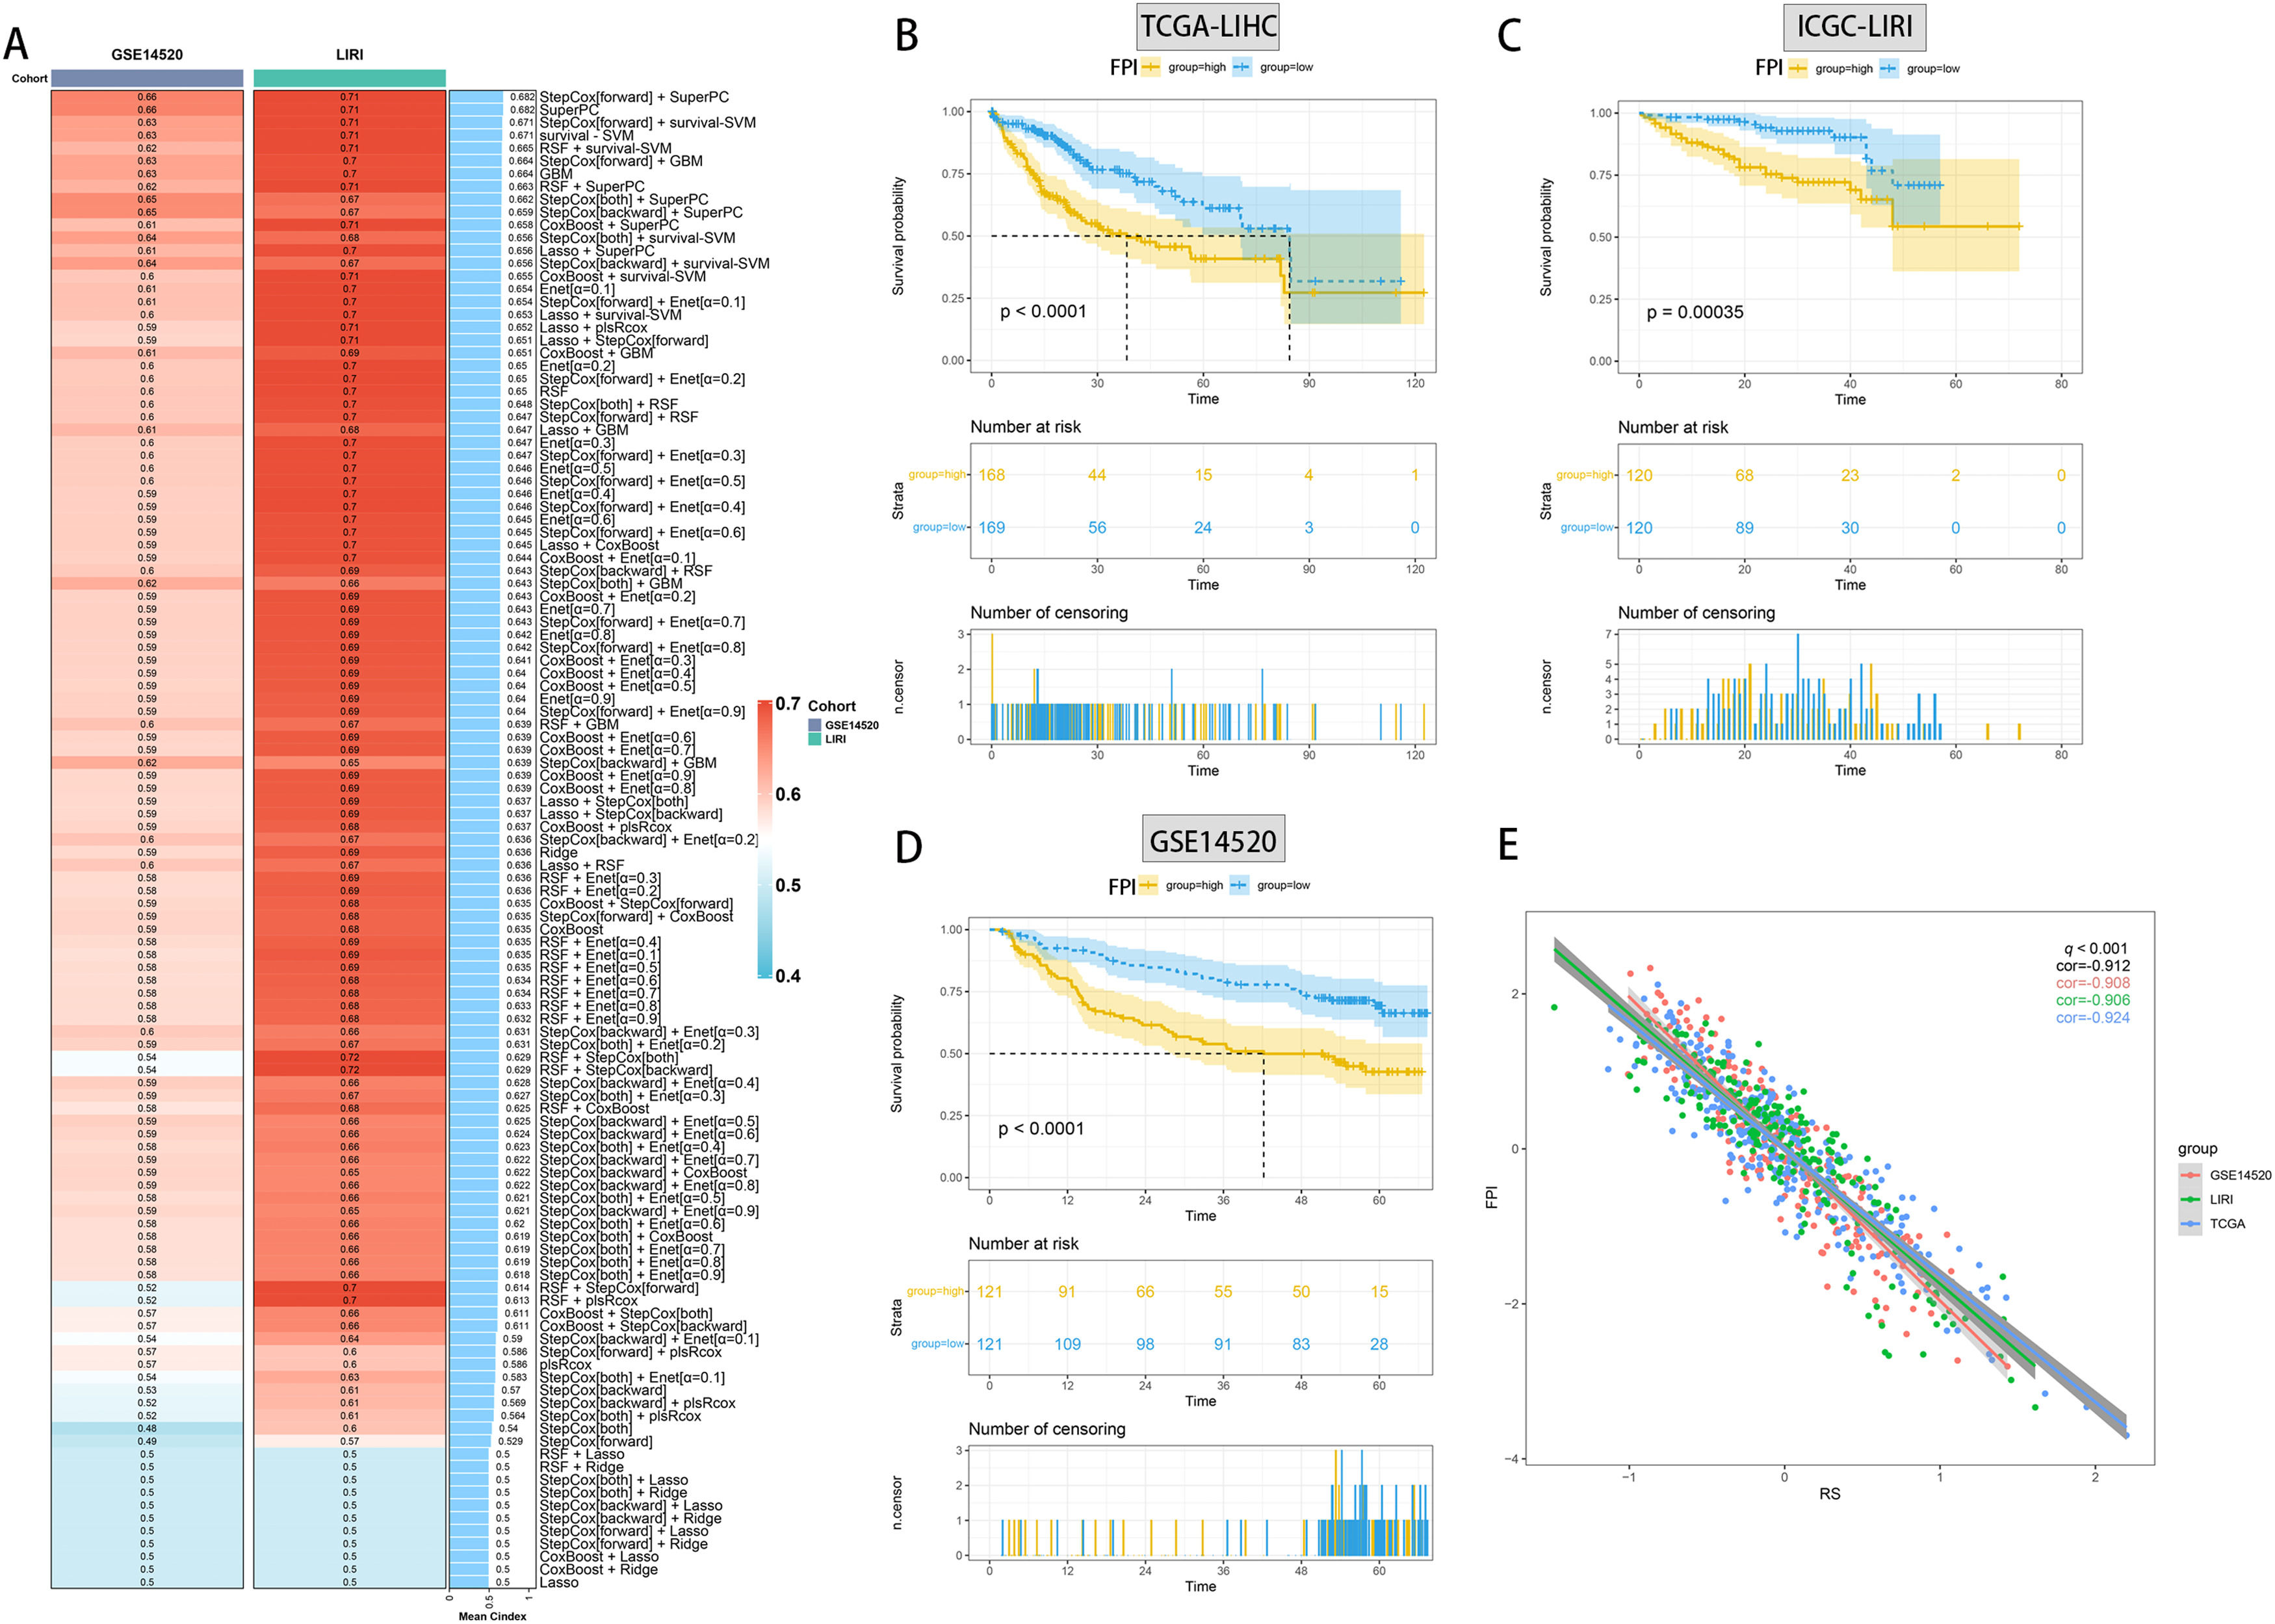
Utilizing functional enrichment analysis, we were able to identify potential physiological processes involved in FA metabolism. In the high FA metabolism group, it primarily involves steroid metabolic process, fat acid metabolic process, and response to xenobiotic stimulation (Fig. 7A, D), whereas in the low FA metabolism group, it primarily involves embryonic organ development, pattern specification, embryonic organ metamorphosis, etc. (Fig. 7B, E). Metabolism of Lipids, Phase I Functionalization of Compounds, Metapathway Biotransformation Phase I and II, Retinol Metabolism, Biological Oxidations, etc. were the majority of the pathways enriched by different genes between the two groups, as determined by GSEA (Fig. 7C). By combining ten machine learning algorithms pairwise, we discovered that StepCox [forward]+SuperPC has a higher C-index (Fig. 8A) and can accurately predict the prognosis of patients in the TCGA-LIHC cohort, ICGC-LIRI cohort, and GSE14520 (Fig. 8B-D). The correlation analysis demonstrates that in the aforementioned three cohorts, FPI has a high correlation with the prediction model, which may indicate that FPI is an excellent predictor of the prognosis of patients with HCC.
, and the main enriched pathways in the low FA metabolism group (B, E). The main differential pathways involved in different FA metabolism groups (C).")
 C-index heatmap of different diagnostic models in the validation set. Survival analysis of the optimal diagnostic models in TCGA-LIHC (B), ICGC-LIRI (C) and GSE14520 (D). (E) Correlation analysis of FPI with the optimal diagnostic model in the three datasets.(FPI: fatty acid prediction index).")
Machine learning builds optimal diagnostic models. (A) C-index heatmap of different diagnostic models in the validation set. Survival analysis of the optimal diagnostic models in TCGA-LIHC (B), ICGC-LIRI (C) and GSE14520 (D). (E) Correlation analysis of FPI with the optimal diagnostic model in the three datasets.(FPI: fatty acid prediction index).
To further investigate the mechanism of FA metabolism in tumors, a pan-cancer analysis was conducted. First, we conducted pan-cancer immune infiltration studies and discovered that FPI and T cells CD4 memory activated, Macrophages M0, Macrophages M1, Monocytes, Mast cells resting, T cells follicular helper have a relatively consistent correlation in the majority of tumors, while the correlation with T cells regulatory (Tregs) showed heterogeneity among different cancers (Fig. 9A). FPI demonstrates substantial heterogeneity for survival analysis, and its analysis of cancer patient prognosis is constrained by the different types of cancer and cannot be applied to survival analysis for all cancers (Fig. 9B, C). Functional enrichment analysis revealed that Xenobiotic metabolism, G2M checkpoint, Epithelial-mesenchymal transition, E2F targets, Adipogenesis are involved in FA metabolism in pan-cancer, indicating the similarity of FA metabolism in the regulation of cancer life activities.
4Discussion Correlation analysis with immune microenvironment. (B,C) Survival analysis. (D) Functional enrichment analysis.")
FAs consist primarily of phospholipids, sphingolipids, triglycerides, and other lipid components. Multiple metabolic pathways can combine them into more complex lipids or convert them into phosphoglycerides [25]. Consequently, FAs can participate in the regulation of important physiological processes of cells via complex metabolic pathways. For instance, it can synthesize biofilm and regulate its fluidity, act as a second messenger to transmit biological information and serve as a carrier to store energy [26], which can not only meet the physiological needs of normal cells but also play a significant role in the rapid proliferation of cancer [27,28]. Despite the fact that HCC is characterized by high malignancy, high mortality, and poor prognosis, and that FA metabolism has been shown to play a significant role in the occurrence and development of HCC [29], previous studies have primarily focused on a single regulatory factor [30–32], and its correlation with immunotherapy, the immune microenvironment, and drug sensitivity requires additional investigation.
We began by examining the relationship between FA metabolism and immunotherapy. By analyzing single-cell data sets comprising immunotherapy-treated samples, we discovered that HCC samples after treatment have lower FA levels, which may indicate that the HCC's FA metabolism is returning to normal as treatment progresses. In normal HCC, however, a decrease in FA metabolism frequently indicates an increase in malignancy. Changes in FA metabolism will not only affect the level of intercellular communication in tumor tissue but will also play a different role in regulating the physiological activities of different cell types, reflecting the heterogeneity of the tissue.
Patients in the high-FA metabolism group had a higher proportion of low-grade AJCC stage and T stage than those in the low-FA metabolism group, as determined by a comprehensive analysis of the TCGA-LIHC cohort. At the same time, the patients in the group with a high FA metabolism had a later age at first diagnosis and a better prognosis across the board. Although the level of FA metabolism is not strongly associated with the current common tumor scoring system, it is significantly inversely associated with the expression level of immune checkpoints and the possible immunotherapy-related pathways. Moreover, for immune cells infiltrated by the immune microenvironment, FA metabolism is associated with T cell follicular helper, T cell CD4 memory activated, Eosinophels, T cell gamma delta, Plasma cells, T cells CD4 memory resting, NK cells resting, Monocytes, Mast cells resting, Endothelial cells, with the majority of these correlations being positive. As a widely used immunotherapy drug, sorafenib has a greater sensitivity in the high FA metabolism group, according to an analysis of drug sensitivity. To validate our conclusion, we also compiled and analyzed a GSE cohort with samples treated with PD-1/PD-L1. The results confirmed that patients with a high level of FA metabolism had a longer survival time and a better immunotherapy response, as well as a significantly higher proportion of PR than those with a low level of FA metabolism.
Combining common machine learning algorithms yielded 101 predictive models, from which we selected the model with the highest C-index and examined its correlation with FA metabolism. The results revealed a high correlation between the TCGA-LIHC cohort, the ICGC-LIRI cohort, and the GSE14520 cohort, confirming the aforementioned findings. The role of FA metabolism in pan-cancer was also investigated. Although tumor types varied, the correlation between T cells CD4 memory activated, Macrophages M0, Macrophages M1, Monocytes, Mast cells resting, T cells follicular helper and FA metabolism was significantly similar among different tumors. Although FA metabolism cannot be used as a universal prognostic indicator for all cancers, it has a consistent impact on the prognosis of some cancers. In different cancers, the regulation of FA metabolism on Xenobiotic metabolism, G2M checkpoint, Epithelial-mesenchymal transition, E2F targets, Adipogenesis reflects the similarities among different cancers.
Our research is somewhat innovative. We designed a FPI to study FA metabolism as a whole, and combined single-cell data with bulk analysis to evaluate the correlation between FA metabolism and clinicopathological data, immunotherapy, and drug sensitivity. On the other hand, there are some restrictions. For instance, our analysis is based on public data, and additional patient data must be gathered by multiple centers for the results to be more convincing. Second, additional experiments are required to confirm the association between FA metabolism and immune infiltration and immunotherapy responsiveness. Lastly, in vivo and in vitro experiments are required to further elucidate this mechanism's specific workings.
5ConclusionsBy combining the analysis of single-cell and bulk-seq data, we developed a FA metabolism prediction index that can accurately predict the prognosis of HCC patients and is closely related to its pathological stage. The relationship between this index and the immune microenvironment, drug sensitivity, and immunotherapy responsiveness in HCC patients was also investigated. Our research provides new theoretical evidence for a deeper understanding of the metabolic disorder in HCC, which will help HCC patients in achieving better clinical outcomes. Obviously, the study requires additional laboratory evidence to be more convincing.
FundingThis research did not receive any specific grant from funding agencies in the public, commercial, or not-for-profit sectors.
Author contributionsJinhuan Wang is responsible for the acquisition of data, analysis and interpretation of data, and drafting of the manuscript; Xinmin Jin is responsible for study concept and design, acquisition of data, and critical revision of the manuscript for important intellectual content.
Data availability statementThe original contributions presented in the study are included in the article. Further inquiries can be directed to the corresponding author.
I am extremely grateful to the publisher of the public data involved in this article and the author of the R package.
Functional enrichment of cells with different levels of FA metabolism. (A: Macrophage; B: B cell; C: Epithelial cells; D: Tissue stem cells; E: Hepatocytes; F: Monocyte; G: Endothelial cells)
Survival analysis of FPI in subgroups.


