


The most important allergen manufacturers are based in Europe and in the US. In some countries local products are also sold. No comparison between European, US and local products has been made until now.
Aim of the studyTo determine total protein content and total specific IgE binding capacity or major allergen content of diagnostic extracts from European, US and Mexican origins relative to the CBER/FDA reference extracts for Dermatophagoides pteronyssinus (Dpt), Bermuda grass and cat (10,000(B)AU/mL).
MethodsDiagnostic extracts were purchased from various manufacturers, blinded and shipped to the analysing laboratory, where the following assays were conducted: total protein concentration (Bradford), specific IgE competition ELISA (Dpt and Bermuda grass) and determination of Fel d 1U/mL. When available, CBER/FDA recommended tests and reagents were used.
ResultsTotal protein content of US reference extracts was higher than all other extracts. Relative potency of European and US-bought Dpt extracts 3,300–4,400AU/mL, Bermuda grass 800–2,500BAU/mL and cat 2.1–4.4 Fel d IU/mL (Ref. 19U/mL), with one exception. Locally produced Mexican products were almost all below 1,000(B)AU/mL.
ConclusionsThree diagnostic extracts from European manufacturers and from Mexican providers which obtain extracts in US have a <50% relative potency compared to 10,000(B)AU/mL US extracts. Locally produced Mexican extracts have much lower total protein content and specific IgE binding capacity. These in vitro results must be complemented with other in vitro and in vivo skin prick tests to obtain a more complete picture of comparison of potency. Nevertheless results are quite consistent for the allergens tested here.
Allergen extracts for specific immunotherapy are primarily produced in Europe and in the United States (US). In some countries there also exist locally produced allergen extracts. In Mexico, allergen extracts originating from Europe, from the US, and from Mexico are all licensed.
This unique situation in Mexico makes comparison with in vitro and in vivo studies of extracts from Europe, US and Mexico legally feasible. With a growing exchange of scientific information in the field of immunotherapy between allergy specialists working on the European and on the American continent, and the development of universal guidelines in which this information is used,1,2 it might be of interest to obtain a better view on how extracts from manufacturers on both sides of the Atlantic Ocean compare.
Allergen extracts can be analysed with various laboratory assays. When commercial batches are tested, one of the first steps is the characterisation of the extract by the measurement of the total protein content. This provides only qualitative information, as the extract may have many proteins and only a fraction of them is allergenic. Additionally, quality control tests such as sodium dodecyl sulfate polyacrylamide gel electrophoresis (SDS-PAGE) can be used to show the distribution of different protein bands. More specific assays like the measurement of specific allergen content3,4 and the total specific IgE binding capacity give an indication of the extract’s biological potency.
The majority of the European and US extracts of the most important allergens are standardised. In Europe each manufacturer establishes its own In-House-Reference Standard (IHRS) based on skin prick test results of the extract in allergic patients. Commercial extracts are compared to this IHRS with qualitative and quantitative laboratory tests before batch release. In the US the Food and Drug Administration (FDA), by its Center for Biologics Evaluation and Research (CBER) has calibrated reference extracts by intradermal skin titration in highly allergic patients. Commercial extracts are to be compared with this reference with FDA/CBER approved laboratory tests to assign relative potency. In the present study we decided to use these officially FDA/CBER dictated tests.
US extracts licensed for sale on the Mexican market, however, are not standardised. These allergen products are imported from the US as raw material and conditioned and commercialised by Mexican providers, without any further testing. The third group of extracts is mainly made locally; some of these extracts are standardised in protein nitrogen units per ml.
The aim of this study is to compare the potency of the three groups of diagnostic extracts –those from European manufacturers, those from the US conditioned in Mexico, and local Mexican extracts- with a US reference extract for various allergens.
MethodsDiagnostic extracts of Dermatophagoides pteronyssinus, Cynodon dactylon, and cat were purchased from various manufacturers, blinded by a third party and shipped to a central analysing laboratory in the US. Providers of the various extracts were: three European manufacturers (Eur1-Eur3); two Mexican distributors who buy the extracts, still unstandardised, in the US (US-Mex1, US-Mex2); and three Mexican manufacturers who partly produce their own extracts (Mex1-Mex3). Manufacturers from group A are ALK-Abelló (Soluprick®, Madrid, Spain), Leti (Barcelona, Spain) and IPI-ASAC (Alicante, Spain). The manufacturers from group B are Alerquim (Mexico City, Mexico) and Allerstand (Mexico City, Mexico). Finally, the manufacturers from group C (local Mexican products) are Rocel (Puebla, Mexico), Centro Médico (Mexico City, Mexico) and Alergomex (Mexico City, Mexico). In all tests the US reference extracts were used, being 10,000AU/mL for D. pteronyssinus, 10,000BAU/mL for Bermuda grass pollen, and 10,000BAU/mL for cat.
At the central laboratory the blinded extracts were analysed in duplicate by various tests. First, the total protein concentration was determined by the Bradford assay (Thermo Fisher Scientific, Rockford IL) using bovine serum albumin as the standard. Then the potency of D. pteronyssinus and Bermuda grass extracts was determined by the specific IgE competition ELISA and the Fel d 1 content of the cat extracts was determined by a radial immunodiffusion assay using the CBER/FDA procedures and reference reagents.5 For specific IgE competition ELISAs, reference D. pteronyssinus or Bermuda grass pollen extract was used to coat microplate wells (Costar, Lowell, MA) at approximately 2μg/ml in carbonate coating buffer pH 9.6. Three-fold serial dilutions of the test and reference extracts were prepared in phosphate buffer containing 0.05% Tween 20 (PBS-T), mixed with an equal volume of a 1:15 dilution of the reference human allergic serum pool, and added in duplicate to the respective allergen-coated microplate wells. After incubation at room temperature for 4–6h, and washing the wells with PBS-T, the specific IgE bound was detected by overnight incubation of the wells with biotinylated anti-human IgE (Kirkegaard & Perry Laboratories, Gaithersburg, MD, USA), followed by washing in PBS-T and alkaline-phosphatase labelled avidin (Zymed Laboratories, San Francisco, CA, USA). After washing the plate the wells in PBS-T, 1mg/ml para-nitrophenyl phosphate substrate (Amresco, Solon, OH, USA) was added to each well and the absorbance was measured at 405nm using a plate reader. The percent inhibition values were calculated for each sample dilution using the formula, (Ap−As/Ap)×100, where Ap is the average positive control (no inhibitor) and As is the average sample absorbance value. The best-fit dose-response lines containing at least four dilutions between 10% and 90% inhibition and bracketing 50% inhibition are constructed using linear regression analysis: y=a+bx, where y is the % inhibition value, a is the y-intercept, b is the slope and x is the logarithm to the base 3 of the dose. The best-fit parallel lines are computed using the combined data for the test and respective reference samples. For a valid assay, the correlation coefficient for both the reference and test extracts had to be 0.95 or greater. Parallelism of the reference and test regression lines was checked using Student’s t-test and the lines had to be parallel at p=0.01. The log3 relative potency (W) was calculated using the following formula: W=(It−Ir)/B, where It and Ir are the test and reference y-intercepts calculated from the parallel lines, and B is the pooled slope. Three independent valid assays on the test antigen were used to calculate the relative potency (3w). The reference extract for D. pteronyssinus had a potency of 10,000AU/ml and for Bermuda grass pollen, 10,000 BAU/ml. For radial immunodiffusion assays, dilutions of cat allergenic extracts were added to 3mm diameter wells, in quadruplicate, cut into 1% agarose plates containing reference anti-Fel d1 serum. After incubating the plates for approximately 48 hours in a humidified chamber, the precipitin circles were visualised by either dipping the plates in a 10% acetic acid solution for approximately 2min or alternatively, the precipitins were stained after exhaustive rinsing of the plates in distilled water followed by silver staining. The diameters of the precipitin circles were measured to the nearest 0.1mm. The standard curves were generated using the labelled values of the Fel d 1 reference dilutions and the average diameter from quadruplicate wells. From these values, the best fit regression line was calculated using the formula, y=a [log(x)]+b, where y is average diameter in mm, x is the labelled value of the specific antigen for that preparation in Fel d 1units/ml, a is the slope, and b is the y-intercept. The correlation coefficient of the regression line must be greater than or equal to 0.9 for a valid assay. The average diameters of the test extract samples were calculated and the Fel d 1 content was computed from the best fit regression line.
Finally, the origin of the extracts (Group A–C) was unblinded to allow for comparison between the three groups. The exact manufacturers’ names stayed blinded till the end.
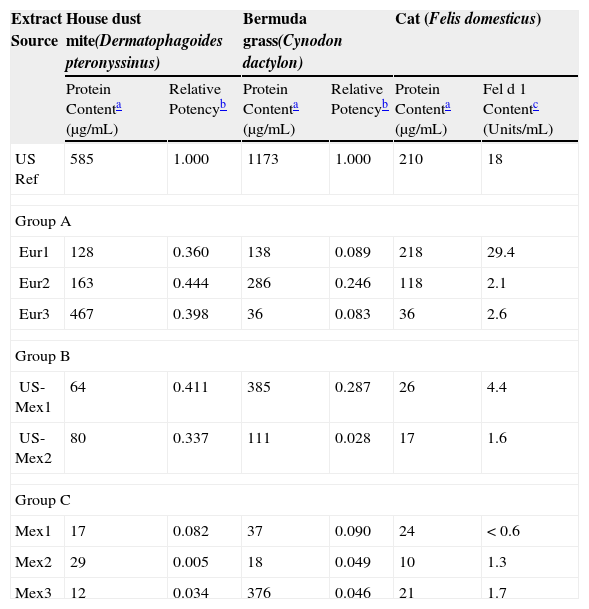
ResultsTable 1 shows the analytical test results for the three different diagnostic extracts analysed, Dermatophagoides pteronyssinus, Cynodon dactylon and cat from the three groups of manufacturers. In general, European products (group A) show higher protein content than the Mexican products (Group C), with the results of the extracts of providers of group B somewhere in between. The US reference extracts have in general the highest protein content.
Analytical results of various allergenic extracts from European and Mexican sources
| Extract Source | House dust mite(Dermatophagoides pteronyssinus) | Bermuda grass(Cynodon dactylon) | Cat (Felis domesticus) | |||
| Protein Contenta (μg/mL) | Relative Potencyb | Protein Contenta (μg/mL) | Relative Potencyb | Protein Contenta (μg/mL) | Fel d 1 Contentc (Units/mL) | |
| US Ref | 585 | 1.000 | 1173 | 1.000 | 210 | 18 |
| Group A | ||||||
| Eur1 | 128 | 0.360 | 138 | 0.089 | 218 | 29.4 |
| Eur2 | 163 | 0.444 | 286 | 0.246 | 118 | 2.1 |
| Eur3 | 467 | 0.398 | 36 | 0.083 | 36 | 2.6 |
| Group B | ||||||
| US-Mex1 | 64 | 0.411 | 385 | 0.287 | 26 | 4.4 |
| US-Mex2 | 80 | 0.337 | 111 | 0.028 | 17 | 1.6 |
| Group C | ||||||
| Mex1 | 17 | 0.082 | 37 | 0.090 | 24 | < 0.6 |
| Mex2 | 29 | 0.005 | 18 | 0.049 | 10 | 1.3 |
| Mex3 | 12 | 0.034 | 376 | 0.046 | 21 | 1.7 |
Protein content determined by Bradford assay using bovine serum albumin as the standard, see methods.
We set arbitrarily the relative potency of a 10,000AU/mL US house dust mite extract at 100%. Then the relative potency of the D. pteronyssinus extracts here tested, as determined by specific IgE competition ELISA, lies within a range of 3,300–4,400AU/mL (33–44%) for products from group A and B, whereas the local Mexican extracts of group C were all far below that.
The relative potencies of all the Cynodon dactylon extracts were far less than the 10,000BAU/mL CBER/FDA reference. For the European products potency varied from 800–2,500–BAU/mL (8–25%).
The major allergen Fel d 1 content for the reference cat extract of 10,000BAU/mL is 19Units/mL (approximately 47.5mcg Fel d 1/mL). Group A and B extracts had five to ten times less than the 10,000BAU/mL cat reference (2.1–4.4Fel d 1U/mL, approximately 5.3–11mcg Fel d 1/mL), with one exception (Eur1: 29.4Fel d 1U/mL) and the potency of all group C extracts is even less than one tenth of the reference.
DiscussionBased on the laboratory test results presented in this study the European and Mexican diagnostic extracts of three different standardised allergens are all less potent than the corresponding US reference extracts. For European house dust mite the difference is about 50%, whereas the European extracts for the other allergens have a potency of ten to twenty percent the US reference. The group C extracts, most of them prepared in Mexico, are far less potent than the European (group A) and US-derived extracts (group B), with very few exceptions. For the house dust mite, Bermuda grass and cat extracts, the specific potency measurements show quite good correlation with their total protein contents, as has been shown in a previous study.6 Only one Mexican Bermuda grass extract is an exception as protein concentration was high, but specific IgE binding capacity low.
There are several methods to determine the specific potency of allergen extracts in vitro, all with their short-comings, as the results depend both on the reference extracts or sera used, as well as on the test methods.3,7 The European CREATE project, funded through grants from the European Union, is trying to overcome these obstacles and has recommended several recombinant reference extracts and reference ELISA’s to serve as standards.8 In the US, the FDA through its CBER, establishes reference extracts and reagents to be used by the US manufacturers and reviews manufacturers’ test results before extract batches can be released.6 Thus, standardised allergen extracts marketed in the US tend to be qualitatively similar and possess common potency units, which is not the case in Europe or in Mexico. In Mexico commercialisation of allergen extracts is supervised by a federal organ, but neither specific quality tests nor potency requirements have been established.
There are a few studies in the literature that have compared allergen extracts previously; however, none has compared products from different continents. One of them recently reported in vitro test results of grass extracts, both for diagnosis and for sublingual immunotherapy, of different European manufacturers. A hundred-fold variation in Phl p 5 content was detected.6 Another study compared extracts for sublingual immunotherapy of house dust mite, birch and grass of two major European allergen manufacturers. The extract from one manufacturer was 4–10 times less potent in skin prick testing than those of the other manufacturer.10
The biological implications of the findings of our study are important. Patients are selected for immunotherapy partly on the basis of the results of their skin prick tests. In the US patients are frequently reported to be polysensitised and mixes of allergens are often used for immunotherapy. On the contrary in Europe, patients tend to be found monosensitised and immunotherapy with just one allergen extract is general practice. If skin prick tests in US are done with more potent extracts, patients will react with a positive result even to allergens to which they are only mildly sensitised. Meanwhile in Europe, with the less potent diagnostic extracts, only major sensitisations will be detected and treated. However, the use of too low potency extracts for diagnosis, as is the case for the extracts of some Mexican manufacturers, will lead to a high percentage of false negative test results and as a consequence under-treatment. A study designed to determine the sensitivity and specificity of allergen extracts varying in potency could confirm this hypothesis and establish what would be the ideal potency for a skin prick testing extract for each individual allergen. In the end, immunotherapy should only be given for the clinically relevant allergens, but with many positive results it could be harder to determine which ones are the main allergens causing the patient’s allergy symptoms.
The results of this in vitro study will have to be confirmed by in vivo tests and will have to be taken into account when immunotherapy trial results are discussed.
FundingThis study was conducted with funds of the Colegio Mexicano de Inmunología Clínica y Alergia (CMICA) for purchasing of the extracts.
The authors would like to thank Greer Laboratories, Inc. USA for the technical and lab-support.
