


Emotional well-being affects the school performance of elementary school children. Quality of life (QoL) measurements are indicative of emotional well-being; however, the development of assessment tools suitable for measuring the QoL of elementary school children has received little attention and, therefore, the creation of reliable assessment tools for measuring QoL among this population is required. Method: We employed qualitative and quantitative research methods to develop and validate a QoL scale for elementary school children in Taiwan. We used cluster random sampling to recruit 711 fifth and sixth grade students, aged 10–12 years, from 14 elementary schools. Results: The scale comprised six factors (School function, Family function, Environmental life, Vitality for life, Learning ability, and Peer relationships) that explained 44% of the variance. The developed 21-item elementary school QoL (ESQoL) instrument had high internal consistency and satisfactory reliability and validity. Conclusions: The ESQoL instrument can facilitate the evaluation of factors associated with students’ emotional well-being. Additional studies using the ESQoL instrument are required to assess its applicability for evaluating relationships between QoL and school performance and other areas of student life.
El bienestar emocional afecta el rendimiento escolar de los niños de Educación Primaria. Las mediciones de la calidad de vida (QoL) son indicativas del bienestar emocional. Sin embargo, el desarrollo de herramientas de evaluación adecuadas para medir la calidad de vida de niños de Educación Primaria ha recibido escasa atención y, por lo tanto, se requiere la creación de herramientas de evaluación confiables para medir la calidad de vida en esta población. Método: Se empleraron métodos de investigación cualitativa y cuantitativa para desarrollar y validar una escala de QoL para niños de Primaria en Taiwán. Se utilizó un muestreo aleatorio por grupos para reclutar a 711 estudiantes de Quinto y Sexto Grado, de 10 a 12 años, de 14 escuelas primarias. Resultados: La escala agrupa seis factores (Función escolar, Función familiar, Vida ambiental, Vitalidad para la vida, Capacidad de aprendizaje y Relaciones entre compañeros) que explican el 44% de la varianza. El instrumento de QoL (ESQoL) de 21 ítems tiene alta fiabilidad de consistencia interna y validez satisfactoria. Conclusiones: El instrumento ESQoL puede facilitar la evaluación de factores asociados con el bienestar emocional de los escolares. Se requieren estudios adicionales utilizando el instrumento ESQoL para evaluar su aplicabilidad en el análisis de las relaciones entre QoL y rendimiento escolar, y otras áreas del ámbito escolar.
According to the World Health Organization (WHO), mental health and emotional well-being are as crucial as physical health in determining the performance and success of children in school. Quality of life (QoL) is a construct for quantifying well-being and evaluating the effectiveness of interventions for children and adolescents (Ravens-Sieberer, Karow, Barthel, & Klasen, 2014), and schools offer the most suitable environments for providing interventions for children with poor QoL (Weare & Nind, 2011). The World Health Organization (WHO, 1996) defines QoL as an “individual's perceptions of their position in life in the context of the culture and value systems in which they live and in relation to their goals, expectations, standards and concerns”. However, this definition of QoL does not specifically apply to children and adolescents. Children's QoL has been defined as the subjective perception of well-being and happiness (Davis, Waters, Shelly, & Gold, 2008). A multifaceted concept, QoL has extensive outcome measures (Rodrigues, Pedroso, & Pontes, 2015).
In previous studies, children's QoL has been measured by employing “adult-centric” instruments (Parizi et al., 2014). Therefore, developing child-specific QoL instruments is imperative. Moreover, instruments specifically customized to assess QoL in children and adolescents are inferior to those available for adults (Ravens-Sieberer et al., 2014). Social, community, family, and school environments are more relevant in assessing children's QoL than that of adults (Thorrington & Eames, 2015). In addition to overall health, QoL affects children's learning and academic achievements, which are regulated by factors such as familial and societal influences and life experiences (Maggino, 2016). Furthermore, children's QoL assessments must be age sensitive because physical and cognitive development is a major influence; children experience various problems and concerns at the different development stages (Wee, Chua, & Li, 2006). For instance, children aged between 10 and 12 years are in the early stages of puberty, which is a period of rapid growth, characterized by a desire for more independence, increased attention to appearance, disagreement with parents, and increased importance of peer relationships (Missotten, Luyckx, Branje, Vanhalst, & Goossens, 2011).
In addition to the difference in concerns among age groups, the relevance of relationships with parents, teachers, and peers varies among cultures (Clefberg Liberman, Altuzarra, Ost, & Oilendren, 2012; Schwarz et al., 2012). Although cultural differences are diminishing because of globalization, certain disparities remain, necessitating the cross-cultural validation of QoL instruments (Carbó-Carreté, Guàrdia-Olmos, & Giné, 2015; Rajmil et al., 2012). However, most QoL instruments for children and adolescents have been developed in Western countries and therefore cannot be applied to children and adolescents from countries with different cultural backgrounds (Houben-van Herten, Bai, Hafkamp, Landgraf, & Raat, 2015; Simões, Santos, & Biscaia, 2016). In Asian countries such as China, Taiwan, Japan, and Korea, emphasis has traditionally been placed on school performance, and this emphasis persists today.
In 2015, there were 35 publications on English-language instruments relevant to health-related QOL for children and adolescents (Janssens et al., 2015): only 21 have been used in published studies and only one was specifically for adolescents, aged 13–15 years, in Taiwan (Fuh, Wang, Lu, & Juang, 2005); none of the studies applied to early adolescents in Taiwan. An age- and culture-specific QoL measurement instrument for children can facilitate the evaluation of their well-being. Therefore, we developed and validated a QoL instrument specifically for Taiwanese children in the early stages of puberty (the upper grades of elementary school). The elementary school QoL instrument can measure the health and well-being of these students. Because well-being is one of the crucial factors that can positively affect a student's academic experience (Weare & Nind, 2011), evaluating QoL may facilitate optimizing elementary school students’ performance at school.
In this study we developed a QoL instrument specific for children in the early phase of puberty (the upper grades of elementary school), and then evaluated the scale's reliability, factor structure, and validity.
MethodParticipantsWe recruited students, aged 10–12 years, from 14 elementary schools in Taiwan to test the psychometric properties of the ESQoL. Consent for the schools’ participation was obtained from the directors of student affairs through in-person visits. The students and one of their respective parents provided written informed consent. We distributed questionnaires to 953 students and 711 were returned, resulting in a response rate of 74.61%. Furthermore, for reliability testing, 60 students participated in a test–retest reliability evaluation over a 2-week period, and another 49 students participated in convergent and discriminant validity assessment.
Instrument developmentThe elementary school students’ QoL (termed ESQoL) scale was developed by employing a standardized multistep method (Barry, Chancy, Stellefson, & Chaney, 2011). We validated the scale by using a two-stage test. At Stage 1, the goal of the data reduction was to develop a comprehensive scale, which measured quality of life of students at the age of early puberty. At Stage 2, we examined the final ESQoL scale for construct validity and internal consistency.
ProcedureBefore the study was conducted, institutional review boards (IRBs) reviewed and approved the study protocol, informed consent, and questionnaire. We obtained informed consent from all participants included in the study. The students were provided a consent form that explained the purpose and method of the study and participants’ rights. They then shared the consent form with their parents. Participation was anonymous, confidential, and voluntary. We allowed the students and parents the freedom to decide whether to participate and provide information.
Statistical analysesSPSS for Windows (version 18.0) was used for the statistical analyses. Data were analyzed using descriptive statistics, item analysis, EFA, and Pearson's correlation coefficient; LISREL 8.8 Software (SSI International, Inc.) was used for the CFA.
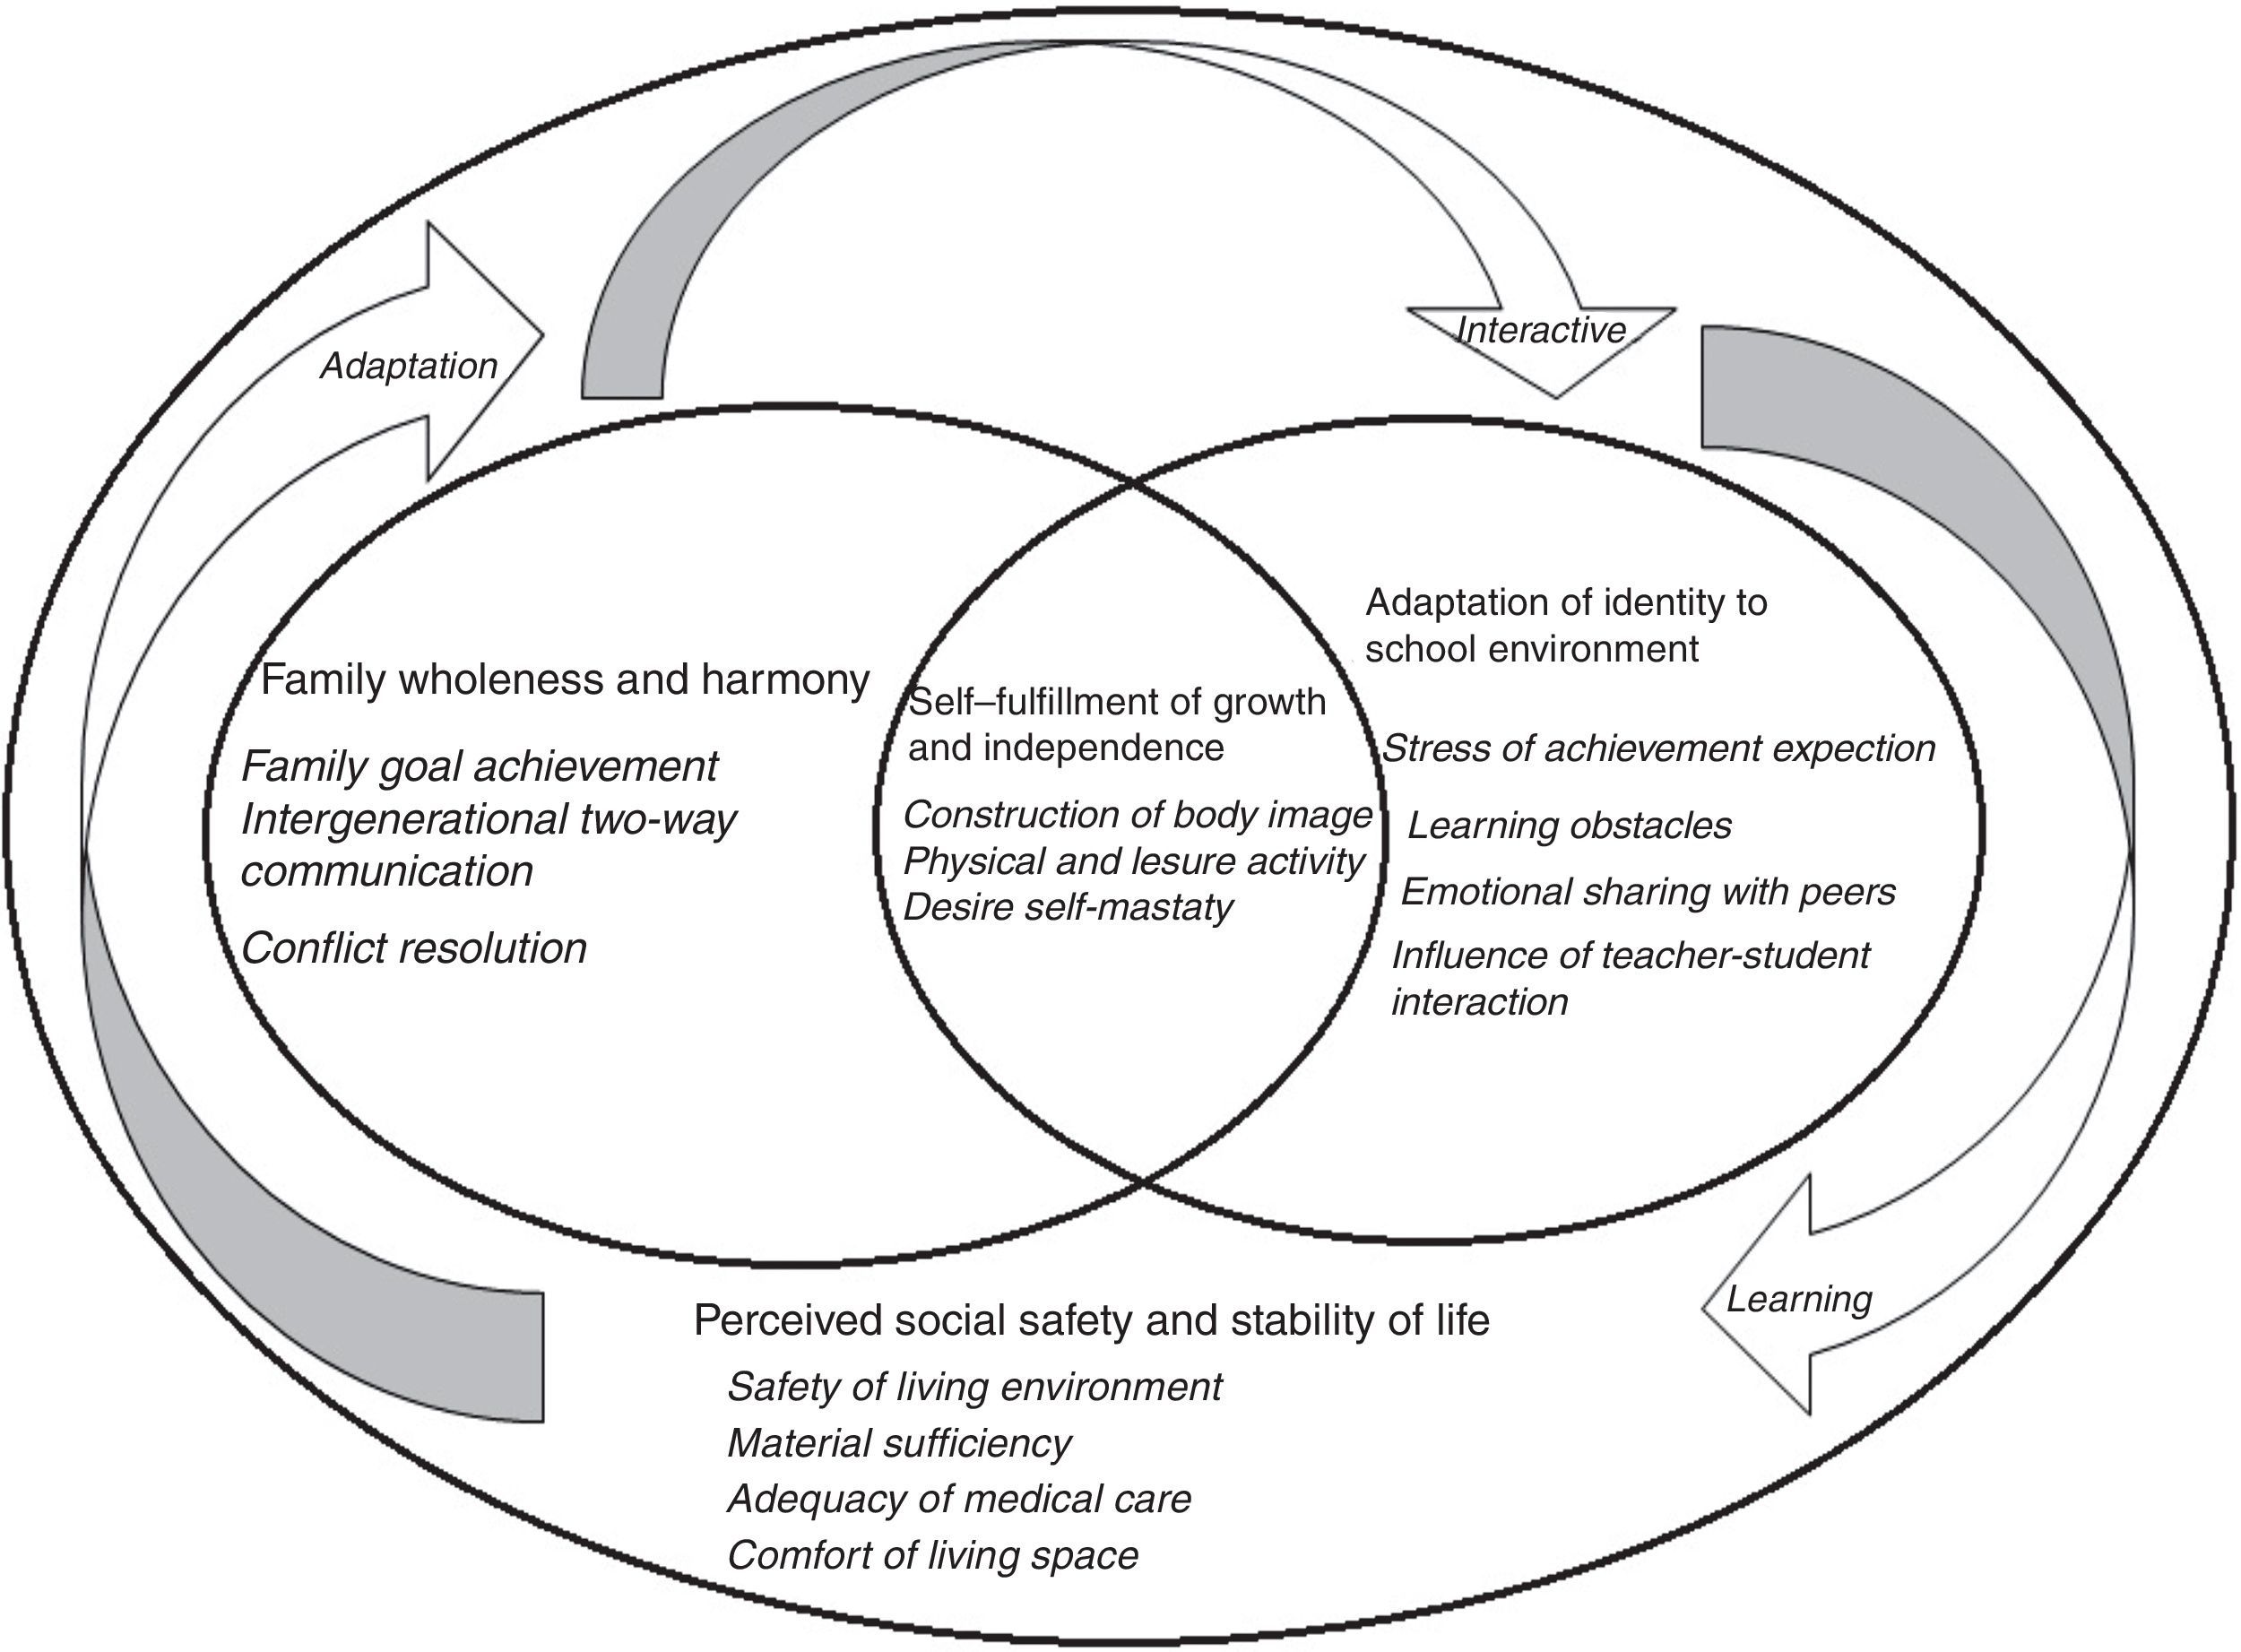
Item generationWe began developing the ESQoL by applying a content analysis and constant comparison methods approach to the in-depth interview data for the focus group of fifth and sixth grade elementary students in Taiwan (Huang, Yu, Lai, & Sheu, 2007). We divided the 70 questionnaire items into four major domains (Figure 1): self-fulfillment of growth and independence (16 items); family wholeness and harmony (18 items); adaptation of identity to the school environment (20 items); and perceived social safety and stability (16 items). Items worded negatively for the construct were reverse coded and scored. The respondents rated each item on a 5-point scale, with 1=never, 2=rarely, 3=sometimes, 4=often, and 5=always.
.")
Conceptual framework of fifth and sixth grade students’ quality of life (Retrieved from Huang et al., 2007).
Content validity. The panel comprised six experts: two pediatric nursing experts, two school nurses, one qualitative research expert, and one community health expert. We provide the measurement aim, the target population, a clear framework definition, and item selection to a panel. The panel also determined the content validity index (CVI), which is used for evaluating meaning and clarity, by using a 4-point Likert scale (1=not relevant, 2=somewhat relevant, 3=quite relevant, 4=highly relevant) to avoid a neutral midpoint (Davis, 1992). The panel met thrice to evaluate the original 70 items and exclude any theoretically or practically irrelevant questions or any ambiguous items that apparently repeated the essential content of other items. We eliminated items with CVI values lower than .83, which resulted in a 50-item questionnaire. Lynn (1986) indicated that content validity depends on subjective or professional judgment; however, inclusion of at least five experts in the field determined that the I-CVI must be 1.00; when there are six experts, the I-CVI must be at least .83. Terwee et al. (2007) suggested that excellent content validity has an I-CVI of .78 or higher.
Stage 1. We examined student responses to the 50-item questionnaire in Stage 1. The goal of the data reduction was to develop a comprehensive scale, which measured quality of life of students at the age of early puberty. Further item reduction occurred in Stage 1. DeVellis (2012) suggests item reduction is a valuable means of improving the quality of items that will be used in later tests, and to assess the quality of the test as a whole. 283 students answered the 50-item preliminary questionnaire, 151 male (53.4%) and 132 female (46.4%). Participants answered the questions by responding to with one of five statements (1=never, to 5=always). The scale scores were analyzed with descriptive statistics (mean, standard deviations, slope), item difficulty measures, item discrimination indexes, and item: total correlation. Examination of the 50-item questionnaire by exploratory factor analysis (EFA) allowed for further item reduction. EFA can be employed for data reduction as it can identify items that are interrelated (DeVellis, 2012) and can eliminate redundant items, consisting of any items with similar meaning, as well as any items causing confusion. The aim of the analysis was to reveal the underlying factors and reduce the question set to retain those items that reflected a broad based definition of ESQoL.
Stage 2: Validity of the ESQoL scale. Stage 2 determined whether the final ESQoL scale accurately identified factors that are important for quality of life of elementary school students. A 24-item ESQoL questionnaire was tested in Stage 2. Validity of the questionnaire was confirmed with criterion validity, to evaluate by correlations between scores on the PedsQoL scale (Varni, Seld, & Rode, 1999) and the ESQoL, internal consistency measured and confirmatory factor analysis (CFA). In Stage 2 428 children from 5th and 6th grade completed the 24-item, 6-factor questionnaire 222 male (51.9%) and 206 female (48.1%). The CFA of the ESQoL scale assessed the relevance of the questionnaire constructed through the EFA. If the model developed from the exploratory data set has a good fit with the confirmatory data set, then the same factor structure is considered to exist in both data sets, confirming the factor structure. A maximum likelihood estimation was used to assess the model fit according to the covariance matrix of the confirmatory data set. We followed the recommendation by Browne and Cudeck (1993) and calculated the chi-square (χ2) value, the standardized root mean square residual (SRMR), and the root mean square error of approximation (RMSEA). Supplementing these indices, we examined model fit by using the comparative fit index (CFI), goodness of fit index (GFI), normed fit index (NFI), and nonnormed fit index (NNFI). Generally, the criterion for establishing model fit suggests that CFI, GFI, and NFI values close to 0.90 represent an acceptable fit and values of 0.90 or higher indicate a good fit (McCoach, Gable, & Madura, 2013).
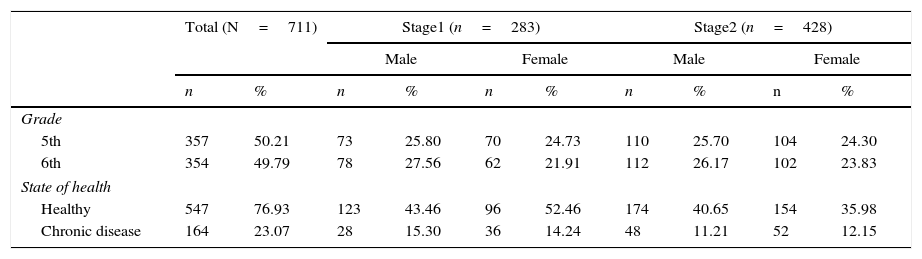
ResultsSociodemographic characteristicsOf the participants, 373 (52.46%) were male and 338 (47.57%) were female. 547 healthy participants, and 164 with chronic disease (Table 1). At Stage 1, using cluster random sampling, we recruited 283, 151 male (53.4%) and 132 female (46.4%), fifth and sixth grade students from six elementary schools to complete a 50-item preliminary questionnaire.
Sociodemographic characteristics of the participants.
| Total (N=711) | Stage1 (n=283) | Stage2 (n=428) | ||||||||
|---|---|---|---|---|---|---|---|---|---|---|
| Male | Female | Male | Female | |||||||
| n | % | n | % | n | % | n | % | n | % | |
| Grade | ||||||||||
| 5th | 357 | 50.21 | 73 | 25.80 | 70 | 24.73 | 110 | 25.70 | 104 | 24.30 |
| 6th | 354 | 49.79 | 78 | 27.56 | 62 | 21.91 | 112 | 26.17 | 102 | 23.83 |
| State of health | ||||||||||
| Healthy | 547 | 76.93 | 123 | 43.46 | 96 | 52.46 | 174 | 40.65 | 154 | 35.98 |
| Chronic disease | 164 | 23.07 | 28 | 15.30 | 36 | 14.24 | 48 | 11.21 | 52 | 12.15 |
Note. Stage 1: Evaluation of the 50-item ESQoL scale. Stage 2: Evaluation of the final ESQoL scale.
At Stage 2, we selected 428, 222 male (51.9%) and 206 female (48.1%), fifth and sixth grade students from eight elementary schools to complete a 24-item, six-factor questionnaire.
Stage 1: Evaluation of the 50-item ESQoL scaleItem analysis. The means for ESQoL items ranged from 2.92 to 4.58 (SD ranged from 0.81 to 1.49). The scores for all items did not exceed 2.5 SDs from the mean, indicating that all items were adequate. In the extreme groups, the t value of each item was between 2.15 and 9.08 (p=.033 to<001); for the homogeneity test, the item-total correlation coefficients ranged from .36 to .53. On the basis of the item analysis results, we retained all items at this stage.
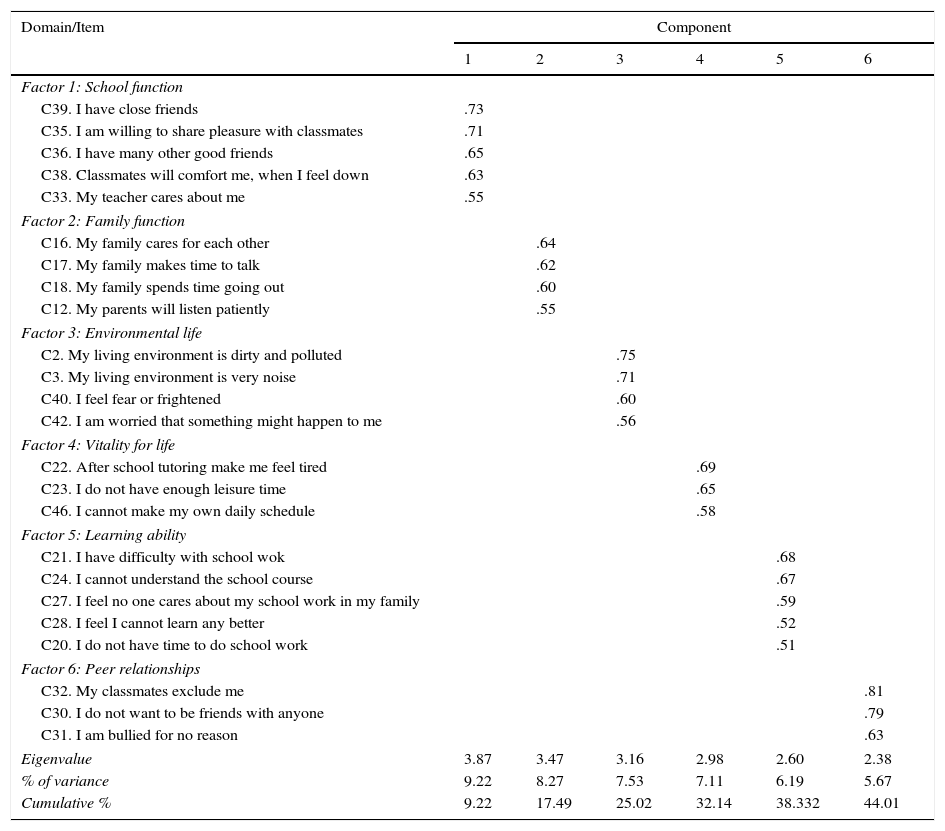
Exploratory factor analysis. We examined the 50-item questionnaire through the EFA, which enabled further item reduction. Following the EFA, 26 items were excluded from the 50-item scale, which resulted in 24 items and six common factors with eigenvalues greater than 1.0. The Kaiser–Meyer–Olkin measure of sampling adequacy was .81. We identified six factors, School function, Family function, Environmental life, Vitality for life, Learning ability, and Peer relationships, that explained 44.01% of the total variance (Table 2). The School function factor comprises five items for investigating the children's view of relationships with teachers and friends at school. The Family function factor comprises four items for assessing the extent of caring and interaction with family members and parents’ willingness to listen. The Environmental life factor comprises two items regarding the cleanliness, pollution, and noise level of the home environment. The Vitality for life factor comprises three items for assessing feelings about extracurricular activities and autonomy; this factor explores the children's level of leisure time and independence, which includes freedom of choice and negative reactions. The Learning ability factor comprises four items for examining feelings about academic work (difficulty in studying, comprehension of course work, and time), learning and concentration, and negative academic achievement. The Peer relationships factor comprises three items for investigating interactions with classmates, including negative relationships, acceptance by peers, and presence of friendships and bullying.
Exploratory factor analyses of 24-item elementary schoolchildren quality of life scale.
| Domain/Item | Component | |||||
|---|---|---|---|---|---|---|
| 1 | 2 | 3 | 4 | 5 | 6 | |
| Factor 1: School function | ||||||
| C39. I have close friends | .73 | |||||
| C35. I am willing to share pleasure with classmates | .71 | |||||
| C36. I have many other good friends | .65 | |||||
| C38. Classmates will comfort me, when I feel down | .63 | |||||
| C33. My teacher cares about me | .55 | |||||
| Factor 2: Family function | ||||||
| C16. My family cares for each other | .64 | |||||
| C17. My family makes time to talk | .62 | |||||
| C18. My family spends time going out | .60 | |||||
| C12. My parents will listen patiently | .55 | |||||
| Factor 3: Environmental life | ||||||
| C2. My living environment is dirty and polluted | .75 | |||||
| C3. My living environment is very noise | .71 | |||||
| C40. I feel fear or frightened | .60 | |||||
| C42. I am worried that something might happen to me | .56 | |||||
| Factor 4: Vitality for life | ||||||
| C22. After school tutoring make me feel tired | .69 | |||||
| C23. I do not have enough leisure time | .65 | |||||
| C46. I cannot make my own daily schedule | .58 | |||||
| Factor 5: Learning ability | ||||||
| C21. I have difficulty with school wok | .68 | |||||
| C24. I cannot understand the school course | .67 | |||||
| C27. I feel no one cares about my school work in my family | .59 | |||||
| C28. I feel I cannot learn any better | .52 | |||||
| C20. I do not have time to do school work | .51 | |||||
| Factor 6: Peer relationships | ||||||
| C32. My classmates exclude me | .81 | |||||
| C30. I do not want to be friends with anyone | .79 | |||||
| C31. I am bullied for no reason | .63 | |||||
| Eigenvalue | 3.87 | 3.47 | 3.16 | 2.98 | 2.60 | 2.38 |
| % of variance | 9.22 | 8.27 | 7.53 | 7.11 | 6.19 | 5.67 |
| Cumulative % | 9.22 | 17.49 | 25.02 | 32.14 | 38.332 | 44.01 |
Note. Extraction Method: Principal Component Factoring. Rotation Method: Varimax with Kaiser Normalization. Only factor loadings greater than .50 are reported, in order to aid interpretation of the factor structure. Kaiser-Meyer-Olkin Measure of Sampling Adequacy: .81
Concurrent validity. We determined the validity of the ESQoL scale by assessing criterion validity with reference to the Pediatric Quality of Life Inventory (PedsQL) generic core scale (Varni et al., 1999). Since 1998, many countries have translated, tested, and proven the validity of this scale, and it has been applied to both healthy and ill children. The self-report PedsQL gathers information from children of ages 5–18years. The four-dimensional 23-item scale comprises the domains of physical functioning (eight items), emotional functioning (five items), social functioning (five items), and school functioning (five items). Internal consistency reliability was defined as α=.09 on the original scale, or α=.62–.90 on the Chinese scale (Lin, 2012). A correlation of .30–.50 was medium; at least .70 was deemed acceptable (Cohen, 1977; Terwee et al., 2007).
In order to estimate the concurrent validity between the PedsQL and ESQoL, Pearson's correlation coefficient for the total scale (n=49) was .43 (p<.002).
Reliability. Cronbach's α was used to examine the internal consistency of the scales. A coefficient of .70 was acceptable (DeVellis, 2012). Test–retest reliability was assessed over a 2-week period in 60 students. The intraclass correlation coefficient (ICC) was used to calculate the test–retest reliability, and ICC>.70 was considered an adequate reliability score (McCoach et al., 2013). The overall scale reliability for the items was very good, with Cronbach's alpha for the subscale ranging from .74 to .90 and being .90 for the entire scale. The ICCs (test–retest reliability) ranged from .79 to .89 for the subscales and .89 for the entire scale. These results confirmed that the ESQoL has good stability.
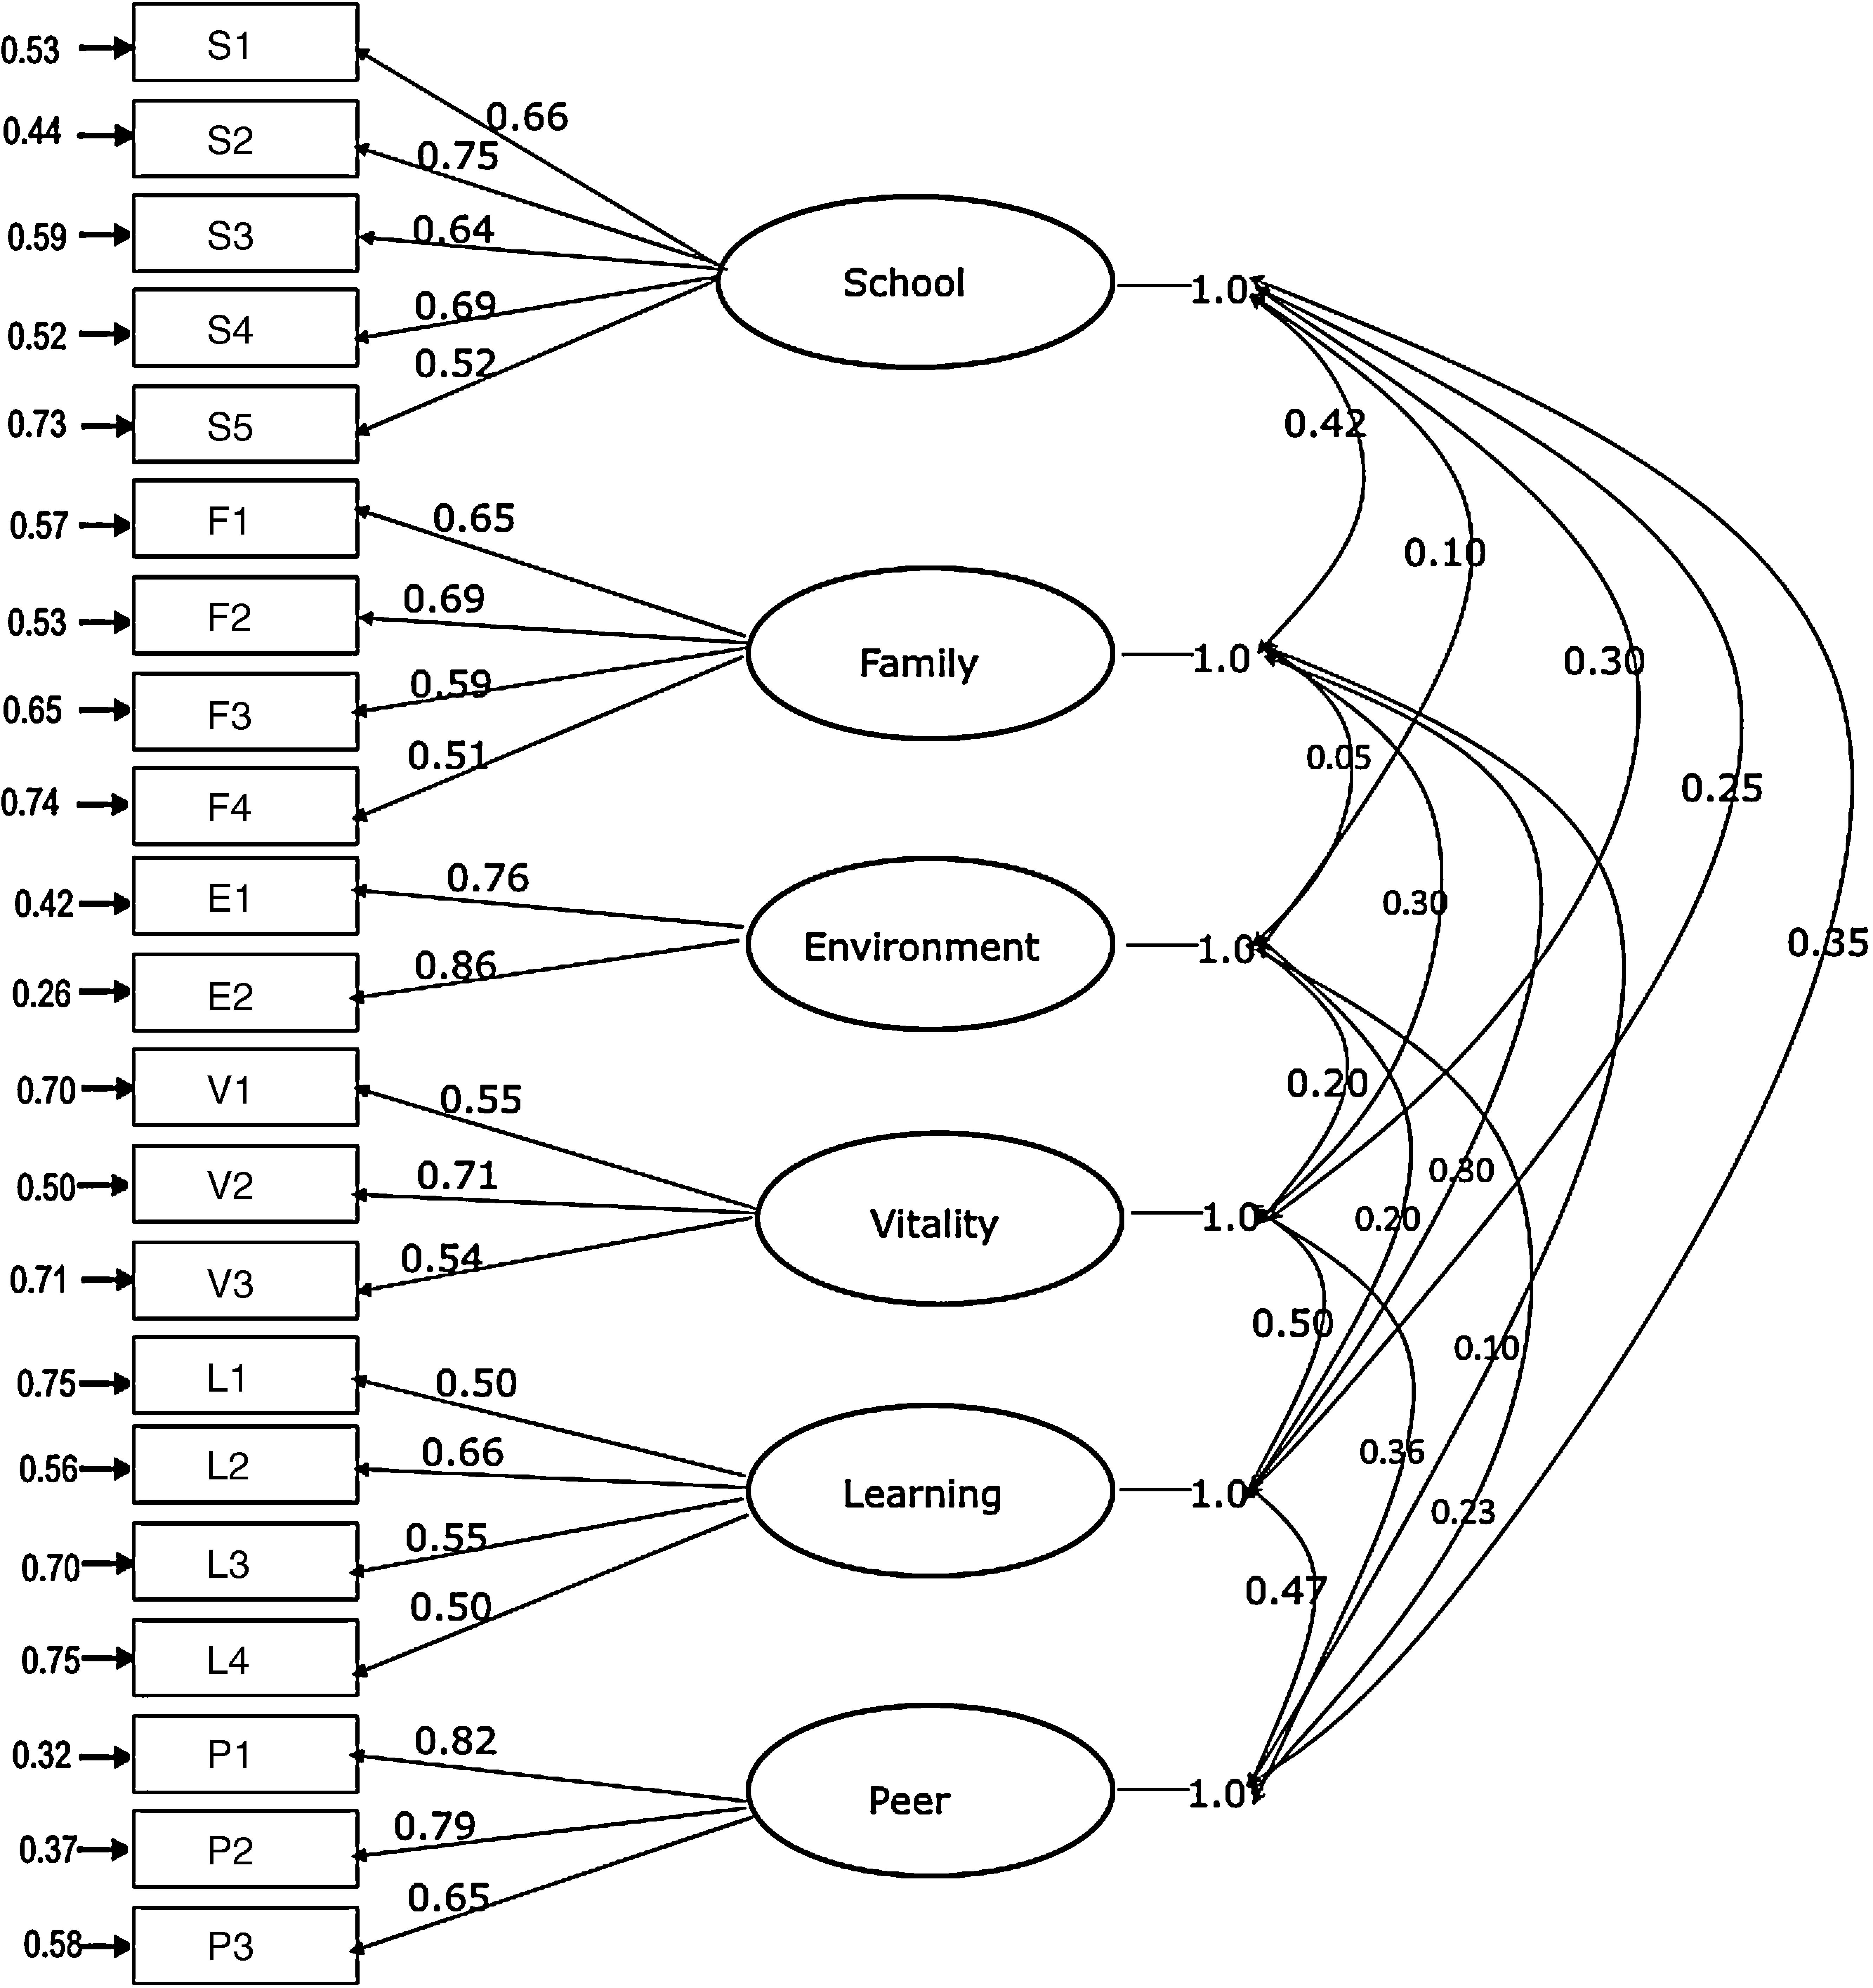
Confirmatory factor analysis. CFA was applied to the 24 items identified in the EFA data set and provided an acceptable, but relatively poor, fit based on the goodness-of-fit statistics: χ2/df=608.17/237, p<.001, CFI=.93, GFI=.89, NFI=0.88, NNFI=.91, SRMR=.069, and RMSEA=.061. Inspection revealed that three of the 24 items had quality values lower than .50, and we excluded them. The factor structure model was retested on the remaining 21 items, and we observed support for the model in the confirmatory data set: χ2=347.27, df=174, p<001, CFI=.95, GFI=.93, NFI=.91, NNFI=.94, SRMR=.05, and RMSEA=.048 (Figure 2).

Elementary school students’ quality of life model. Confirmatory factor analysis based on 21 items and six factors.
Note. School=School Function; Family=Family Function; Environment=Environmental Life; Vitality=Vitality for Life; Learning=Learning Ability; Peer=Peer Relationships; df=degrees of freedom; RMSEA=root mean square error of approximation.
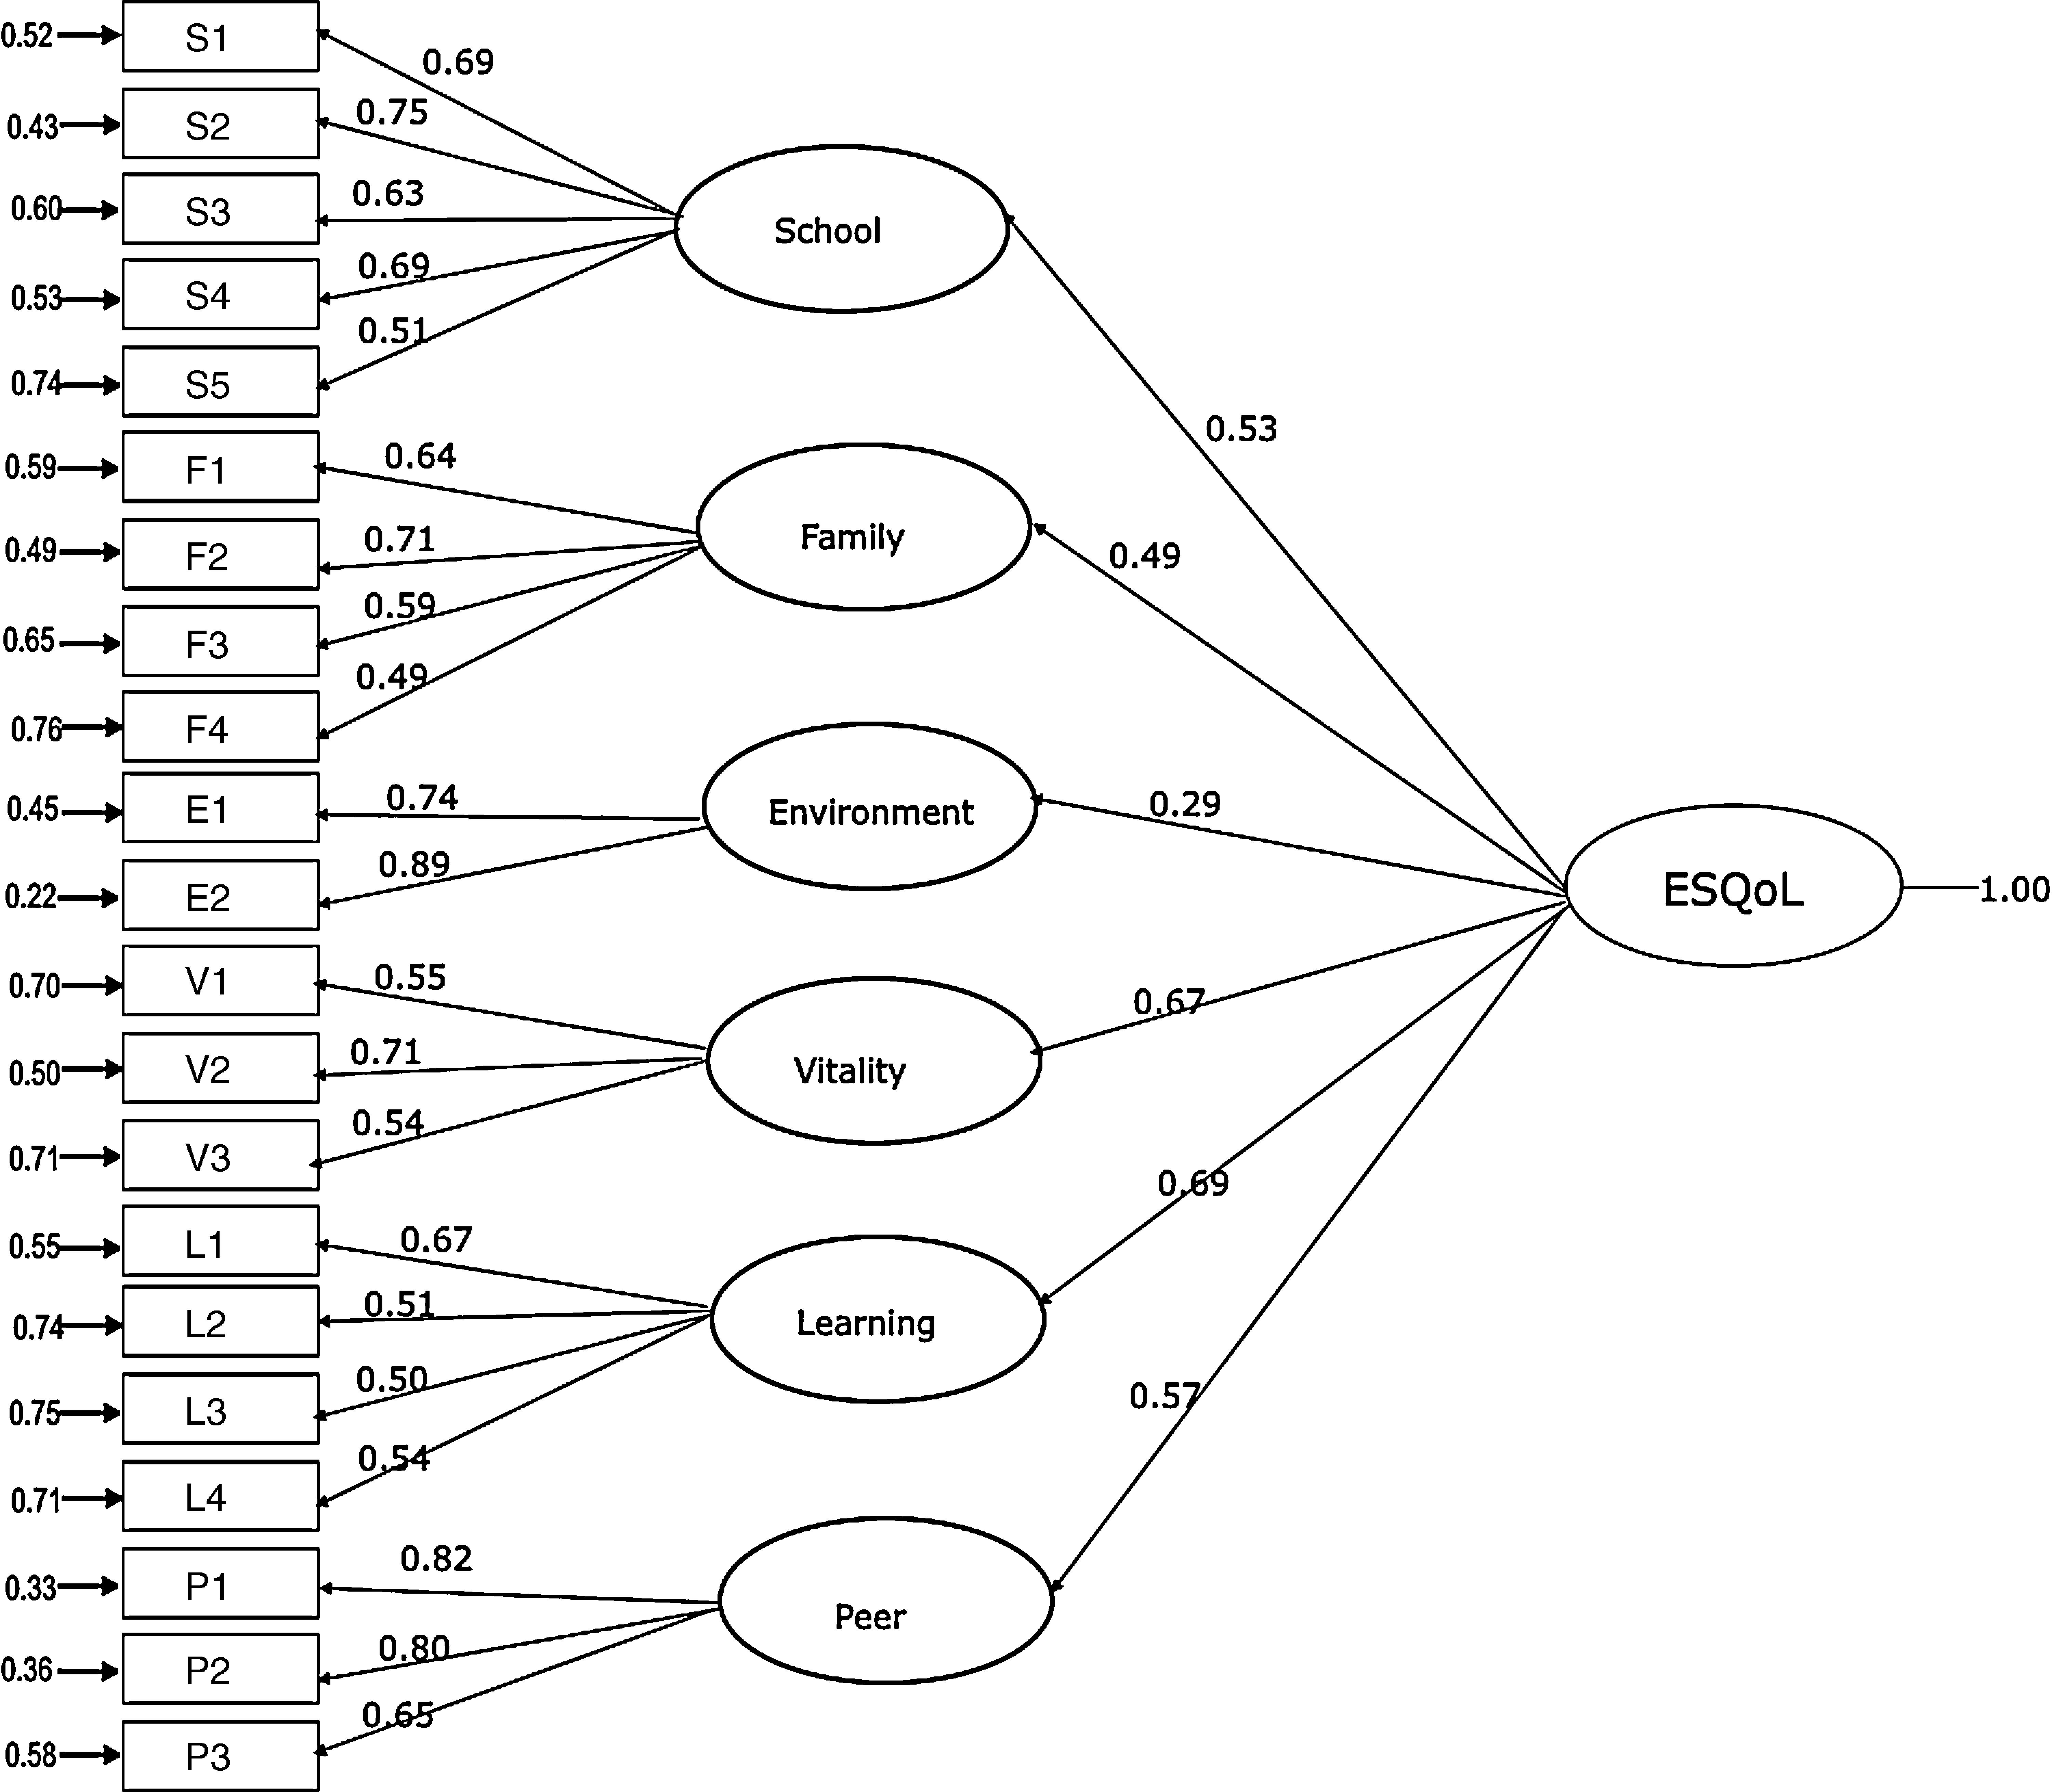
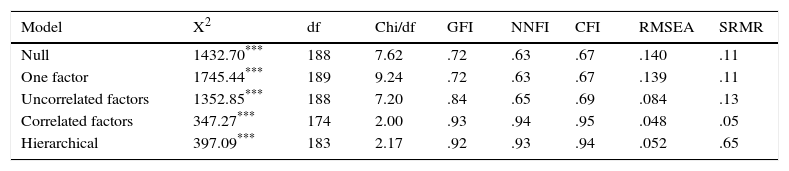
We performed additional CFA to determine the goodness of fit; the ESQoL was compared with conceptualizations of five-factor structure models. Table 3 illustrates that the fit indices improved immensely when both the one-factor and uncorrelated factors models were compared with the null model. The hierarchical model was retained as the model with the best fit because it indicated that each of the six factors were interrelated first-order factors and that they were also all related to a second-order factor termed ESQoL. Retention of this model supported the assumption that these six scales are subscales of one larger scale (Figure 3).
Confirmatory Factor Analysis of the Elementary School Students’ Quality of Life Scale.
| Model | X2 | df | Chi/df | GFI | NNFI | CFI | RMSEA | SRMR |
|---|---|---|---|---|---|---|---|---|
| Null | 1432.70*** | 188 | 7.62 | .72 | .63 | .67 | .140 | .11 |
| One factor | 1745.44*** | 189 | 9.24 | .72 | .63 | .67 | .139 | .11 |
| Uncorrelated factors | 1352.85*** | 188 | 7.20 | .84 | .65 | .69 | .084 | .13 |
| Correlated factors | 347.27*** | 174 | 2.00 | .93 | .94 | .95 | .048 | .05 |
| Hierarchical | 397.09*** | 183 | 2.17 | .92 | .93 | .94 | .052 | .65 |
Note. *p<.05. **p<.01.

Hierarchical model and factor loadings resulting from confirmatory factor analysis.
Note. ESQoL=elementary school students’ quality of life; School=School Function; Family=Family Function; Environment=Environmental Life; Vitality=Vitality for Life; Learning=Learning Ability; Peer=Peer Relationships.
Therefore, the six scales can be administered individually or combined into one scale. Figure 3 presents the hierarchical model with factor loadings and the standardized maximum likelihood parameter estimates (path coefficients). The factor loadings and most path coefficients were strong; however, the Environmental Life factor had a weak coefficient of 0.29.
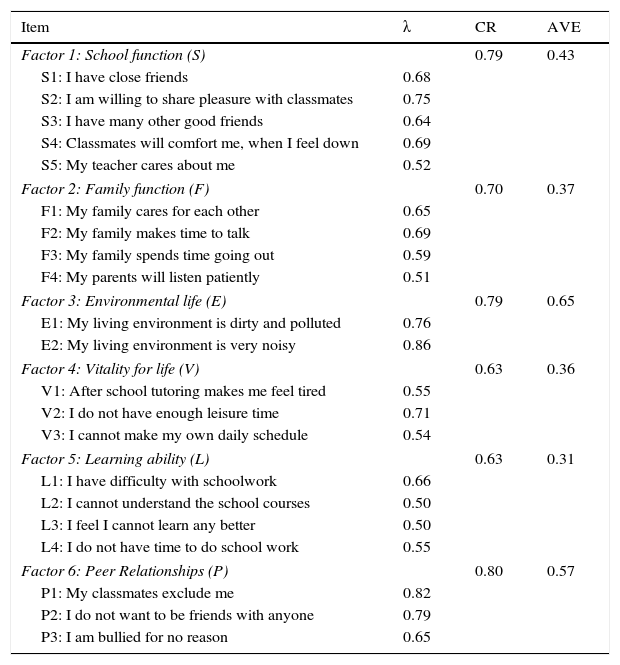
Hair, Black, Babin, Anderson, and Tatham (2006) suggested using multiple criteria when performing CFA, in addition to model fit evaluation, to gain a clear understanding of the individual parameters. We performed three additional factor extractions to confirm the model structure, as presented in Table 4: item quality (λ), composite reliability (CR), and average variance extracted (AVE). The data in Table 4 demonstrate the statistical significance that each observation variable had relative to its individual latent variable factor load (λ). All factors had values of .50 or higher, demonstrating that the observed variable sufficiently reflected its construct's latent variable (Tabachnick & Fidell, 2007). Factors with a CR of .63 were considered good (Raine-Eudy, 2000), and all factors appropriately exceeded this level, except for the Vitality for Life factor, which had a value of .63. The acceptable AVE ranged between .30 and .66; all six first-order factors demonstrated values within this range, exhibiting good strength (Fornell & Larcker, 1981).
The 21-Item 6-Factor Elementary School Students’ Quality of Life (ESQOL) Scale.
| Item | λ | CR | AVE |
|---|---|---|---|
| Factor 1: School function (S) | 0.79 | 0.43 | |
| S1: I have close friends | 0.68 | ||
| S2: I am willing to share pleasure with classmates | 0.75 | ||
| S3: I have many other good friends | 0.64 | ||
| S4: Classmates will comfort me, when I feel down | 0.69 | ||
| S5: My teacher cares about me | 0.52 | ||
| Factor 2: Family function (F) | 0.70 | 0.37 | |
| F1: My family cares for each other | 0.65 | ||
| F2: My family makes time to talk | 0.69 | ||
| F3: My family spends time going out | 0.59 | ||
| F4: My parents will listen patiently | 0.51 | ||
| Factor 3: Environmental life (E) | 0.79 | 0.65 | |
| E1: My living environment is dirty and polluted | 0.76 | ||
| E2: My living environment is very noisy | 0.86 | ||
| Factor 4: Vitality for life (V) | 0.63 | 0.36 | |
| V1: After school tutoring makes me feel tired | 0.55 | ||
| V2: I do not have enough leisure time | 0.71 | ||
| V3: I cannot make my own daily schedule | 0.54 | ||
| Factor 5: Learning ability (L) | 0.63 | 0.31 | |
| L1: I have difficulty with schoolwork | 0.66 | ||
| L2: I cannot understand the school courses | 0.50 | ||
| L3: I feel I cannot learn any better | 0.50 | ||
| L4: I do not have time to do school work | 0.55 | ||
| Factor 6: Peer Relationships (P) | 0.80 | 0.57 | |
| P1: My classmates exclude me | 0.82 | ||
| P2: I do not want to be friends with anyone | 0.79 | ||
| P3: I am bullied for no reason | 0.65 | ||
Note. λ=Oblique pattern parameter estimation; CR=Composite reality; AVE=Average variance extracted.
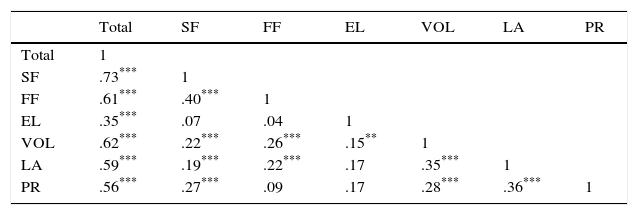
Table 5 presents estimates for Pearson's correlation from all factors, which are similar to those the model originally proposed.
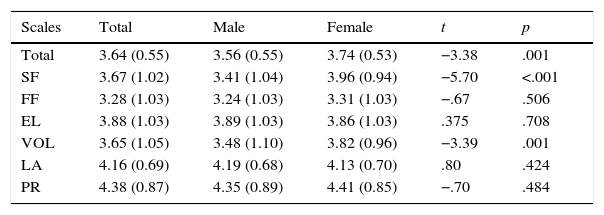
Reported quality of lifeAs show in Table 6, the overall of “Elementary schoolchildren quality of life” was 3.64 (SD=0.55). Analyzing from the six domains, we discovered overall quality of life have “peer relationship” rated as the highest (mean±SD=4.38±0.87), followed by “learning ability” (mean±SD=4.16±0.69), and lastly “environment life” (mean±SD=3.88±1.03). In addition, total score (t=-3.38, p<.001), school function (t=-5.70, p<.001) and vitality for life (t=-3.39, p=.001), females have significant higher than males.
Means (SD) ESQoL scores by the gender.
| Scales | Total | Male | Female | t | p |
|---|---|---|---|---|---|
| Total | 3.64 (0.55) | 3.56 (0.55) | 3.74 (0.53) | −3.38 | .001 |
| SF | 3.67 (1.02) | 3.41 (1.04) | 3.96 (0.94) | −5.70 | <.001 |
| FF | 3.28 (1.03) | 3.24 (1.03) | 3.31 (1.03) | −.67 | .506 |
| EL | 3.88 (1.03) | 3.89 (1.03) | 3.86 (1.03) | .375 | .708 |
| VOL | 3.65 (1.05) | 3.48 (1.10) | 3.82 (0.96) | −3.39 | .001 |
| LA | 4.16 (0.69) | 4.19 (0.68) | 4.13 (0.70) | .80 | .424 |
| PR | 4.38 (0.87) | 4.35 (0.89) | 4.41 (0.85) | −.70 | .484 |
Note. SF=school function, FF=family function, EL=environmental life, VOL=vitality for life, LA=learning ability, PR=peer relationships.
This study developed a new instrument for evaluating the QoL of fifth and sixth grade students in Taiwan. The 21-item six-factor ESQoL was determined to be reliable through both EFA and CFA. The factors identified are consistent with the elements reported to influence learning and academics, which can affect early adolescents’ QoL. We conducted EFA and CFA, which have been used to assess reliability and validity as well as the factor structure for a scale (Barry et al., 2011). The CFA confirmed that the ESQoL can be employed as a measurement instrument to assess the QoL of fifth and sixth grade elementary school students.
In terms of concurrent validity, ESQoL total scores were determined to be moderately correlated with PedsQL total scores. This result may be caused by two reasons. First, the sample size of 49 students may have been too small, therefore it may have resulted in minimal correlations. This can be an area of improvement in future studies. Secondly, this study assumes that societal differences between Eastern and Western countries should be considered when evaluating children's quality of life; the concurrent validity result of this study seems to support this assumption, but larger samples should be investigated for verification.
Analyses of the ESQoL identified six factors, of which School Function, Family Function, Environmental Life, learning ability and Peer Relationships are similar to the factors identified in previous studies on QoL for children (Clefberg Liberman et al., 2012; Landgraf, 2014; Ravens-Sieberer et al., 2006; Starfield et al., 1995; Varni et al., 1999); however, our questionnaire is minor different because it evaluates Learning ability and Vitality for Life. These are crucial measures for students in most developed countries in Asia, including Taiwan, where parents are extremely concerned about their children's academic performance (Chan, Ng, & Chan, 2014; Tzeng, 2007). A focus group study in Singapore demonstrated that Asian and Western children although minor and important different exist, such as school work load, but still shared similar notions of QoL (Wee et al., 2006). Most parents believe that providing numerous learning activities is essential for their children; however, they also believe that “children's time in school should not be wasted without learning anything” (Shih & Yi, 2014). Thus, children attend after-school programs (known as “cram” schools) to not only reinforce schoolwork but also learn other skills, such as language, music, dance, and computer skills. Consequently, children experience pressure from long hours of after-school learning, which prevents children from having a high level of Vitality for Life, and they often experience unhappiness. By contrast, children's free time in the United States is not restricted by the family requirement that extracurricular activities must have an academic component; children in the United States may learn more by playing and exploring their environments (Chen, 2005; Shih & Yi, 2014). If used in a different cultural setting, the ESQoL instrument can accurately measure Vitality for Life to reveal cultural differences in the student population.
In the quality of life reported, we found that females scored significantly higher than males in total scores, school function, and vitally for life, this is similar to the study result conducted by Ghotra, McIsaac, Kirk, and Kuhle (2016) which investigated 629 Canadian elementary school children in grades four to six; however, it is different from the findings of Clefberg Liberman, Larsson, Altuzarra, Öst, and Ollendick (2015)’s study, which investigated 1,352 children in Chile and Sweden, and found that males scored significantly higher than females; in addition, it is also different from the findings of Clefberg Liberman et al., 2012’s study, which investigated 729 students aged 8 to 14, and found that there is no significant difference between both genders. Therefore, this is subject to future studies of different age groups, economic conditions and cross-national comparisons to better understand their differences.
This study provides the groundwork for the further expansion of the ESQoL scale, which requires additional psychometric testing to develop a more comprehensive scale. Additional validation of the ESQoL instrument will necessitate longitudinal studies that examine the causal relationships between the factors of ESQoL and school performance in elementary school settings. ESQoL scale measurement can also provide data for investigating the gradual changes in students’ QoL.
The results of this study suggest that the ESQoL scale is provide an appropriate instrument for measuring the QoL of elementary school students in the early stages of puberty (fifth and sixth grade students) and support the factor structure, reliability, and validity of the measures. We identified six factors of the ESQoL scale and these fit the hierarchical model: School function, Family function, Environmental life, Vitality for life, Learning ability, and Peer relationships. Each of these six factors exhibited good internal reliability and constituted a model with a good fit with the data. The six factors were moderately correlated with each other, suggesting that they each assess related, although distinct, components of elementary school children's QoL. The 21-item ESQoL is a short questionnaire that can be administered in a school setting. It can facilitate identifying concerns that may interfere with a student's ability to perform adequately and feel comfortable in school.
ConclusionsThe 21-item ESQoL is a short questionnaire that can be administered in a school setting. To our knowledge, this is the first instrument for measuring QoL concerns that pertain to elementary school students in Taiwan. It evaluates the QoL of students in the early stages of puberty. However, the extent to which the ESQoL can facilitate identifying concerns that may interfere with a student's ability to perform adequately and feel comfortable in school requires additional studies.
Health care providers have the responsibility to monitor the overall health and well-being of children. Nurses and pediatricians are responsible for “providing preventive services, early identification of problems, interventions, and referrals to foster health and educational success” (Magalnick & Mazyck, 2008). This can also include alleviating academic stress, bullying, and family concerns by identifying the problems and providing emotional support and interventions (Lineberry & Ickes, 2015).
The ESQoL instrument developed in this study was a valid instrument and an appropriate for assessing students’ life satisfied and performance levels. Understanding the school and personal difficulties of fifth and sixth grade students can facilitate identifying a student's problems that can be resolved with interventions such as the application of coping strategies.
Despite its contributions, this study has certain limitations. The study was limited to fifth and sixth grade students in the early adolescence stage; the age range of the students may have been too narrow. Regarding the concurrent validity, and the test - retest reliability, we enrolled two samples of 49 and 60 students as subjects for testing. Most questionnaires collected from students were anonymous, and it was difficult to obtain consent from parents and students while using the test–retest method. We look forward to having larger samples for testing and retesting, which would allow for greater consistency in similar studies in the future. Furthermore, we did not examine the influence of the family's socioeconomic status, physical activity and cross culture data (Carbó-Carreté, Guàrdia-Olmos, Giné, & Schalock, 2016); all such factors may affect fifth and sixth graders’ QoL. Hence, we recommend that future studies on the ESQoL scale consider these additional variables.
FundingThis study was conducted with the support from the Taipei Veterans General Hospital, Grant VGH 46504.
