

Reference data for anthropometric parameters are not available for adolescents in Cali (Colombia). This study aimed to develop representative age- and sex-specific percentiles for anthropometric indicators [fat percentage, body mass index (BMI), and waist circumference] in urban adolescents aged 10–16 years in Cali.
MethodsThe sample (n=1,773) consisted of 865 boys and 908 girls from the descriptive, cross-sectional population-based IFRECNTEC study (Identification of Risk Factors for Non-communicable Chronic Diseases in Adulthood in a Population aged 6 to 18 years old attending School in the Municipality of Cali, Colombia). Data on anthropometric variables were recorded. Smoothed age- and sex- specific 5th, 25th, 50th, 75th, 90th and 95th centiles were derived using the least mean squares (LMS) regression method.
ResultsIn most ages, anthropometric indicators were higher for girls than for boys. The BMI p50 ranged from 16.8 to 19.9kg/m2 in boys and from 16.7 to 21.1kg/m2 in girls. Fat percentage in boys in the p50 varied from ≈12% at the ages of 10 and 11 years to ≈13% at the age of 16 years; for girls, these percentages varied from ≈13% in the earliest ages to ≈16% in older ages. Waist circumference was lower in girls than in boys in most ages.
ConclusionThe results of this study could be used to identify adolescents with an elevated risk of developing obesity, dyslipidemia, hypertension and cardiovascular disorders in adulthood, to plan and implement preventive policies, and to study temporal trends. The introduction of centile values will help to classify adolescents from Cali and compare their anthropometric indicators with those of a reference population.
No existen indicadores antropométricos para los adolescentes de Cali, en Colombia. Este estudio tuvo como objetivo establecer percentiles antropométricos según edad y sexo para los indicadores: porcentaje de grasa, índice de masa corporal (IMC), y perímetro de la cintura en adolescentes escolarizados y con edades comprendidas entre los 10 y los 16 años.
MétodosEstudio descriptivo de corte transversal con 1.773 niños y adolescentes de ambos géneros (n=865 chicos y n=908 chicas) pertenecientes al estudio IFRECNTEC (Identificación de Factores de Riesgo de Enfermedades Crónicas No Transmisibles del Adulto en la Población Escolarizada de 6 a 18 años en el Municipio de Cali, Colombia). Se calcularon los valores percentiles p5, p25, p50, p75, p90 y p95 de los indicadores antropométricos a partir de la regresión de los mínimos cuadrados promedio (LMS) según edad y sexo.
ResultadosEn la mayoría de las edades, los indicadores antropométricos de las chicas fueron más elevados que para los chicos. En estos últimos, el IMC p50 osciló entre 16,8 y 19,9kg/m2, mientras que en las chicas osciló entre 16,8 y 21,1kg/m2. El porcentaje de grasa en los chicos para p50 osciló entre ≈ 12% para edades comprendidas entre los 10 y los 11 años, y ≈ 13% para el grupo de 16 años de edad; en las adolescentes, osciló entre el 13%, en las más jóvenes, y el 16% las de mayor edad. El perímetro de cintura de las chicas fue inferior al de los hombres en la mayoría de las edades.
ConclusiónLos resultados de este estudio podrían ser utilizados para identificar niños y adolescentes con riesgo elevado de desarrollar obesidad, dislipidemia, hipertensión y trastornos cardiovasculares en la edad adulta, y apoyaría la planificación y ejecución de políticas de prevención. La introducción de valores percentiles ayudará a clasificar a niños y adolescentes de Cali, Colombia respecto a una población de referencia y a estimar la proporción de niños o adolescentes que sufren cambios respecto a los indicadores antropométricos.
Several authors have postulated that adults’ health status and quality of life are defined from very early ages.1,2 Prenatal, nutritional, and life-style factors during the first years of life affect the onset of non-communicable chronic diseases during adulthood.3,4 Likewise, changes caused by urbanization in most parts of the world with increased access to goods and services have markedly decreased infant and child mortality, producing a demographic and epidemiological transition in developing nations.5,6 In the American continent, the first cause of mortality is chronic disease, especially in countries where a small proportion of the population lives in rural areas.7,8
In Colombia, mortality due to illnesses associated with sedentary life styles currently represents over 40% of the death rate in most predominantly urban areas with high population density.9,10 Additionally, because of the nutritional changes observed in the American continent, this death rate can by explained by risk factors for chronic disease such as overweight [measured through body mass index (BMI) or waist circumference] and sedentary life styles, given that 56.3% of Colombian children between 5 and 12 years of age spend more than 2hours daily watching television and 56% perform less than 30minutes of physical activity per day.9,11
Determination of fat mass and body fat mass should be considered, given their relationship with the nutritional problems now observed in countries undergoing epidemiological transition. Currently, there is no mention of energy deficit but rather there is an excess of energy in Latin American infants and adolescents.12,13 Anthropometric evaluation of children and adolescents is important, given the relationship between these parameters and the onset of chronic disease, especially cardio-metabolic diseases. Direct methods such as dual-energy X-ray absorptiometry (DEXA) or underwater weighing provide sensitive and valid evaluation measurements. However, these methods require sophisticated techniques and laboratory environments, limiting their application because of the equipment required and their high costs.
Consequently, in clinical practice and epidemiological studies, simpler anthropometric measurements have been developed such as waist circumference and skin-fold thickness measurements, which have been clearly related to the presence of chronic disease.9-13 Both methods serve to estimate body fat surplus or deficit and are correlated with BMI. Both childhood and adolescence are decisive periods in human life because of the multiple changes in metabolism, which differ between the sexes. For example, fat mass in female children and adolescents tends to be higher than in males,14 indicating the importance of measuring this parameter. Obtaining population reference values allows criteria for the interpretation of anthropometric scores to be established. This strategy aids the application of measurement instruments, allows a better understanding of the systematic differences among groups (according to ethnicity, age, region of residence, etc.), and permits the magnitude of changes in health status to be evaluated. Thus, reference values are required to interpret the results of anthropometric measurements in clinical and population-based studies and would aid interpretation in our current health system.
Studies describing reference values for body composition in children and adolescents are scarce, especially those evaluating body fat, hampering accurate identification of states of overnutrition or undernutrition. Recently, Mueller et al15 and Moreno et al16 published reference percentiles for the percentage of body fat, lean body mass and fat mass estimated through bioimpedance in adolescents in Spain and the USA, with highly discrepant results. Nevertheless, in Colombia proposals to define such reference percentiles in children and adolescents are rare. Our sample (n=1,773) consisted of 865 boys and 908 girls from a cross-sectional population-based survey, the IFRECNTEC Study (Identification of Risk Factors for Non-communicable Chronic Diseases in Adulthood in a Population aged 6 to 18 years old attending School in the Municipality of Cali, Colombia)17 in whom data on anthropometric variables were recorded.
MethodsWe performed a cross-sectional descriptive study in an ethnically homogeneous population of urban 6-18-year-old boys and girls enrolled in school. We aimed to establish statistically significant comparisons among percentiles. Statistical significance was set at 5% and power at 80%. A sample size of 80 observations for each percentile was chosen in a total of 1,817 individuals.17 For the sample selection, we calculated the total number of students by gender and socioeconomic level from a list of educational establishments registered with the Municipal Secretary of Education in Cali. Through probabilistic sampling and stages, we selected aggregates (enrolled in school) by proportionality to size. The establishments were selected in each socioeconomic level until the desired number was reached.17
Two working groups were established and standardized composed of nutritionists, graduates in pediatrics and physical education, professional nurses, and laboratory aides supervised by the research group. Each participant was given a medical and physical examination, which included anthropometric measurements:17,18 weight was measured in kilograms and a decimal, height in centimeters and a decimal, and skin folds in millimeters. Skin fold measurements were taken in the following locations: sub-scapular (at a slanted inferolateral diagonal 45° from the horizontal, immediately below the lower angle of the scapula), tricipital (at the medial line of the posterior face of arm at the medial point between the anterior projection of the acromion and the inferior margin of the olecranon); suprailiac (between the mid-axillary line immediately above the iliac crest); and abdominal (3cm lateral to the umbilical line and 1cm below the umbilicus). Waist circumference was measured with a measuring tape at the narrowest part of the torso. These measurements were used to calculate BMI and body fat percentage employing the equations by Durnin and Womersley19 and Siri.20 The dimensions cited were taken with approved devices and according to the norms established by the International Biological Program drawn up by the International Council of Scientific Unions, which gathers the essential procedures for the biological study of human populations.21-23
This study was conducted in accordance with the ethical principles established by the Helsinki Declaration and the legal norms regulating clinical research in humans currently in force in Colombia (Resolution 00086 by the Colombian Ministry of Health) and was approved by the Ethics Committee of the School of Medicine at the Universidad del Valle17. In each of the institutions selected, staff and parents were asked to participate. The parents signed an informed consent form accepting participation of their children and adolescents in the study.
To analyze ontogenetic and sexual variability, prior normality tests were run through the Kolmogorov-Smirnov and Shapiro-Wilk tests. Smoothed percentiles for anthropometric variables (BMI, fat percentage, and waist circumference) were constructed from the raw data and were entered into a spreadsheet separately for boys and girls and imported into the software package using the least mean squares (LMS) method.24 The LMS method enables normalized growth centile standards to be developed and deals generally with skewness, which might be present in the distribution of variables. This method assumes that the data can be normalized by using a power transformation, which removes skewness from the data set by extending one tail of the distribution and reducing the other.24 The maximum power required to obtain normality was calculated for each age group series and the trend was then summarized by a smooth (L) curve. The trends observed for the mean (M), and coefficient of variation (S) were similarly smoothed. These LMS curves contained information to enable any centile curve to be drawn and to convert measurements into exact standard deviation scores.24 Descriptive statistics were computed using STATA 8.0 intercooled version (STATA Corporation, College Station Road, Houston, Texas) and the LMS regressions were performed using LMS Pro software (The Institute of Child Health, London).
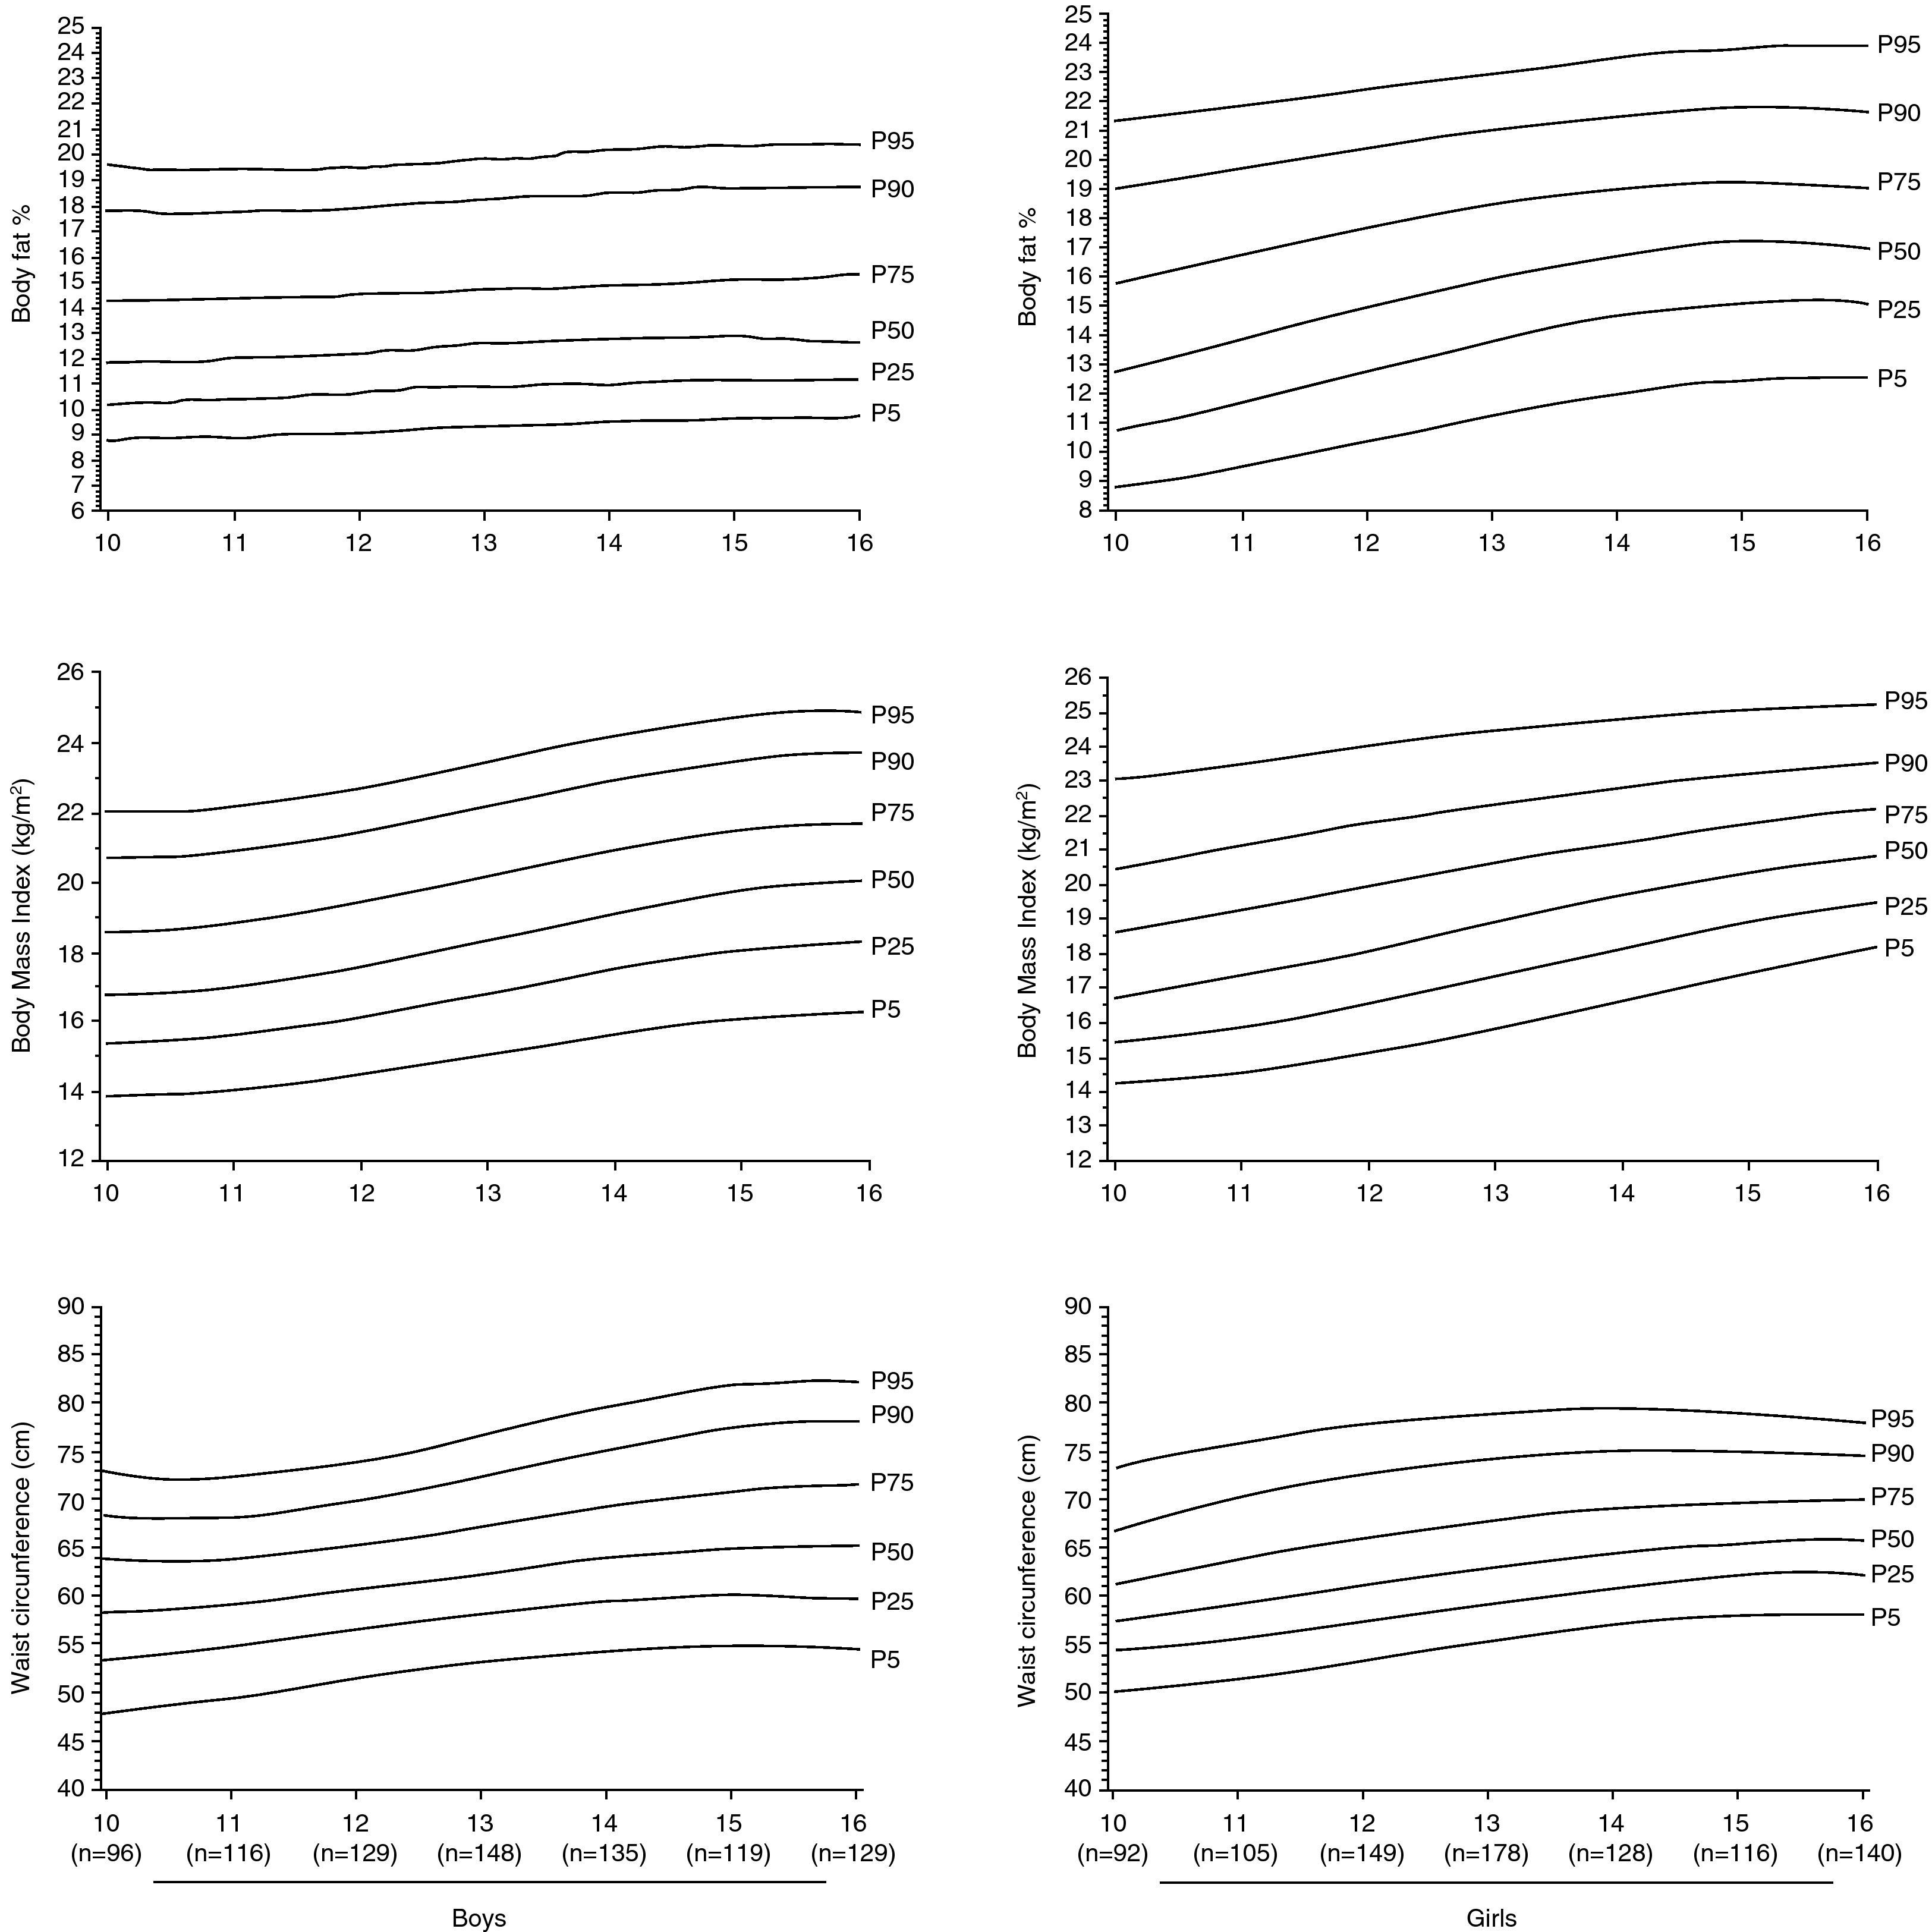
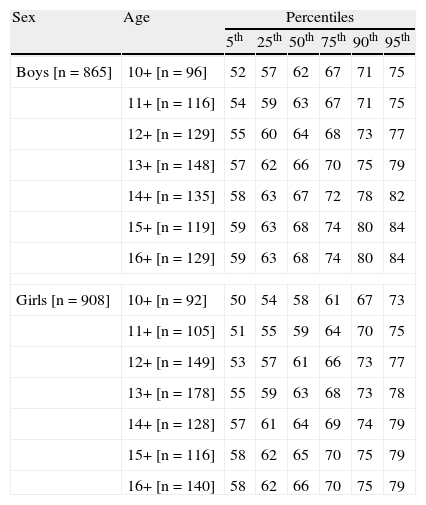
ResultsFourteen schools were included in the study to achieve the planned sample size. Of the 1,800 students invited to participate, 27 students (1.5%) were not included in the analyses due to loss of information (n=12) or lack of informed consent (n=15). The final sample was composed of 1,773 students. The total number of students registered in the urban area of Cali during the study period was 318,916 out of a potential school-aged population of 505,838. For inferences on the city, the number of cases was adjusted to the proportion of students enrolled from each socioeconomic level throughout the city. The centile distribution by age and sex of the anthropometric variables (BMI, fat percentage, and waist circumference) are shown in Tables 1, 2 and 3. Centile curves are shown in Figure 1. In most ages, the anthropometric indicators for girls were higher than for boys. The BMI p50 varied between 16.8 and 19.9kg/m2 in boys and between 16.7 and 21.1kg/m2 in girls. The fat percentage in boys in the p50 varied from ≈12% at the ages of 10 and 11 years to ≈13% at the age of 16 years, while this percentage in girls ranged from ≈13% in the earliest ages to ≈16% in older ages. Waist circumference was lower in girls than in boys in most ages.
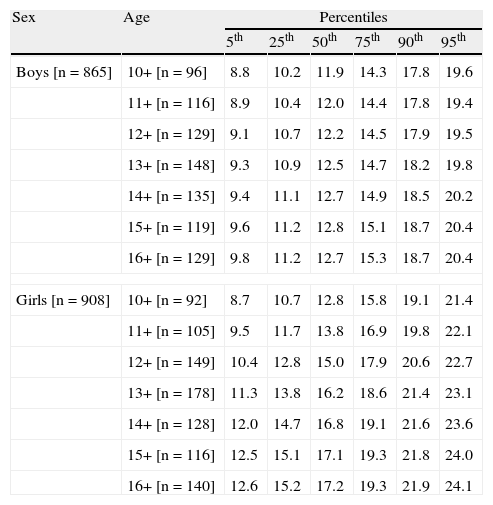
Values of percentiles of fat percentage by age and sex
| Sex | Age | Percentiles | |||||
| 5th | 25th | 50th | 75th | 90th | 95th | ||
| Boys [n=865] | 10+ [n=96] | 8.8 | 10.2 | 11.9 | 14.3 | 17.8 | 19.6 |
| 11+ [n=116] | 8.9 | 10.4 | 12.0 | 14.4 | 17.8 | 19.4 | |
| 12+ [n=129] | 9.1 | 10.7 | 12.2 | 14.5 | 17.9 | 19.5 | |
| 13+ [n=148] | 9.3 | 10.9 | 12.5 | 14.7 | 18.2 | 19.8 | |
| 14+ [n=135] | 9.4 | 11.1 | 12.7 | 14.9 | 18.5 | 20.2 | |
| 15+ [n=119] | 9.6 | 11.2 | 12.8 | 15.1 | 18.7 | 20.4 | |
| 16+ [n=129] | 9.8 | 11.2 | 12.7 | 15.3 | 18.7 | 20.4 | |
| Girls [n=908] | 10+ [n=92] | 8.7 | 10.7 | 12.8 | 15.8 | 19.1 | 21.4 |
| 11+ [n=105] | 9.5 | 11.7 | 13.8 | 16.9 | 19.8 | 22.1 | |
| 12+ [n=149] | 10.4 | 12.8 | 15.0 | 17.9 | 20.6 | 22.7 | |
| 13+ [n=178] | 11.3 | 13.8 | 16.2 | 18.6 | 21.4 | 23.1 | |
| 14+ [n=128] | 12.0 | 14.7 | 16.8 | 19.1 | 21.6 | 23.6 | |
| 15+ [n=116] | 12.5 | 15.1 | 17.1 | 19.3 | 21.8 | 24.0 | |
| 16+ [n=140] | 12.6 | 15.2 | 17.2 | 19.3 | 21.9 | 24.1 | |
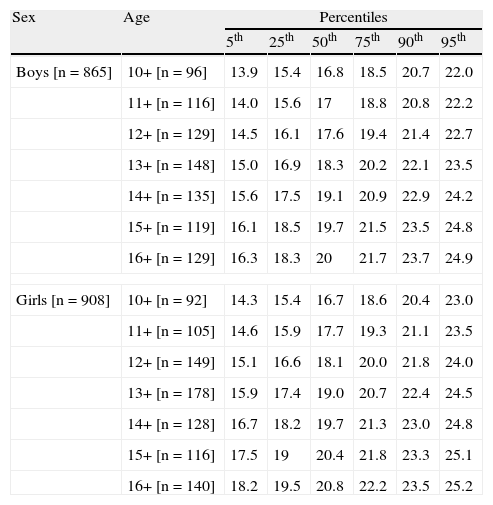
Values of percentiles of body mass index by age and sex
| Sex | Age | Percentiles | |||||
| 5th | 25th | 50th | 75th | 90th | 95th | ||
| Boys [n=865] | 10+ [n=96] | 13.9 | 15.4 | 16.8 | 18.5 | 20.7 | 22.0 |
| 11+ [n=116] | 14.0 | 15.6 | 17 | 18.8 | 20.8 | 22.2 | |
| 12+ [n=129] | 14.5 | 16.1 | 17.6 | 19.4 | 21.4 | 22.7 | |
| 13+ [n=148] | 15.0 | 16.9 | 18.3 | 20.2 | 22.1 | 23.5 | |
| 14+ [n=135] | 15.6 | 17.5 | 19.1 | 20.9 | 22.9 | 24.2 | |
| 15+ [n=119] | 16.1 | 18.5 | 19.7 | 21.5 | 23.5 | 24.8 | |
| 16+ [n=129] | 16.3 | 18.3 | 20 | 21.7 | 23.7 | 24.9 | |
| Girls [n=908] | 10+ [n=92] | 14.3 | 15.4 | 16.7 | 18.6 | 20.4 | 23.0 |
| 11+ [n=105] | 14.6 | 15.9 | 17.7 | 19.3 | 21.1 | 23.5 | |
| 12+ [n=149] | 15.1 | 16.6 | 18.1 | 20.0 | 21.8 | 24.0 | |
| 13+ [n=178] | 15.9 | 17.4 | 19.0 | 20.7 | 22.4 | 24.5 | |
| 14+ [n=128] | 16.7 | 18.2 | 19.7 | 21.3 | 23.0 | 24.8 | |
| 15+ [n=116] | 17.5 | 19 | 20.4 | 21.8 | 23.3 | 25.1 | |
| 16+ [n=140] | 18.2 | 19.5 | 20.8 | 22.2 | 23.5 | 25.2 | |
Values of percentiles of waist circumference by age and sex
| Sex | Age | Percentiles | |||||
| 5th | 25th | 50th | 75th | 90th | 95th | ||
| Boys [n=865] | 10+ [n=96] | 52 | 57 | 62 | 67 | 71 | 75 |
| 11+ [n=116] | 54 | 59 | 63 | 67 | 71 | 75 | |
| 12+ [n=129] | 55 | 60 | 64 | 68 | 73 | 77 | |
| 13+ [n=148] | 57 | 62 | 66 | 70 | 75 | 79 | |
| 14+ [n=135] | 58 | 63 | 67 | 72 | 78 | 82 | |
| 15+ [n=119] | 59 | 63 | 68 | 74 | 80 | 84 | |
| 16+ [n=129] | 59 | 63 | 68 | 74 | 80 | 84 | |
| Girls [n=908] | 10+ [n=92] | 50 | 54 | 58 | 61 | 67 | 73 |
| 11+ [n=105] | 51 | 55 | 59 | 64 | 70 | 75 | |
| 12+ [n=149] | 53 | 57 | 61 | 66 | 73 | 77 | |
| 13+ [n=178] | 55 | 59 | 63 | 68 | 73 | 78 | |
| 14+ [n=128] | 57 | 61 | 64 | 69 | 74 | 79 | |
| 15+ [n=116] | 58 | 62 | 65 | 70 | 75 | 79 | |
| 16+ [n=140] | 58 | 62 | 66 | 70 | 75 | 79 | |
 and girls (n=908) aged 10-16 years.")
The objective of this study was to determine the percentile values for BMI, fat percentage, and waist circumference in a sample of children and adolescents in Santiago de Cali, Colombia, aged between 10 and 16 years old. To do this, and because the IFRECNTEC17 is an epidemiological study, we used standardized anthropometric measurements, which were reproducible and easily accessed.14-22 The sample was representative (baseline) of Colombia's current situation, with a prevalence of overweight – including obesity – of 25.69% in boys and 19.13% in girls (ENSIN-2005).11 The weight and height increase in the distinct age groups is shown in the BMI ratio, an obesity indicator that expresses the interaction of genetic and environmental factors. Anthropometric measurements are indirect indicators of body composition; hence, these values are used as a measure of development from conception to adulthood. Because fat, muscular, and osseous compartments reflect the balance between the body's needs and the availability of nutrients and energy, they can be used to estimate nutritional or development status. Functional equilibrium between tissular needs and availability is measured without determining whether deficits are due to deficient intake, to absorption problems, to abnormal losses, or to any other factors. In some instances, the use of anthropometric measurements without knowledge of their significance has created confusion.
Selecting a single and more precise measure to estimate obesity in children and adolescents is difficult. Currently, no measurement describes obesity and overweight at different ages of the life cycle by sex due to differences in bone, muscle, and fatty tissue density. Anthropometric indicators such as the BMI, which can be easily and economically calculated, have become important tools because height and weight measurements in adolescents are easily estimated and are accurately evaluated in a broad variety of clinical situations. Although growth consists of the accumulation of fat mass and fat-free mass, in general, medical clinics describe growth only in terms of BMI. The main limitation of body mass indicators is that they do not take body composition into account, given that an excess of body mass may be due to fat mass or to fat-free mass, which will be judged as excess mass. In addition, a deficit in body mass may be due to a deficit in fat-free mass.22
In terms of body composition, this study has revealed that by sex, annual increases in BMI were mainly triggered by increases in weight and height, factors contributing to higher BMI values in boys than in girls, in agreement with the results reported by Maynard et al.25 Our results also corroborate prior research26,27 that shows that, in certain age groups, childhood populations living above 900 meters of sea level show higher average heights and weights than the national26 or international standard.26-28 Equally, BMI percentiles are equal to or greater than those of the National Center for Health Statistics [NCHS] reference population. The same phenomenon was noted with percentiles of skin folds and body fat percentage.
Much discussion has been generated on the use of the US population as a reference because this population shows a marked deviation toward elevated values compared with groups from other high-income countries. At the p50, there is smaller variation among groups from high-income populations. A BMI above p85 should be considered as overweight. Although there is a need to define obesity, there is little information to achieve precise methods for such a definition. The p50 of the French population of the same ages is lower than that for the NCHS so that in all the socioeconomic levels of the sample there would be a certain degree of overweight and obesity. This type of analysis offers new perspectives and interpretative difficulties on the health and nutritional status of populations, which should be kept in mind by parties involved in the planning, decision making, and execution of health and social policies.29
These differences could be attributed to the fact that the Quetelet Index or BMI do not adequately reflect the height-weight relationship in populations from Cali due to multiple factors (ethnic, geographic, social, etc.) that may affect this relationship. In this case, the application of an index that minimizes the relationship with height and maximizes the relationship with weight could be more useful when analyzing the height-weight relationship in populations of similar ages.25,27,30,31 A study by Rodríguez et al14 in 2004 with 280 adolescents in Spain that aimed to estimate the percentage of body fat via DEXA and its relationship with obesity, defined by the International Obesity Taskforce cutoff values by Cole et al,32 showed that for participants in the p85 – the fat distribution considered the cut-off point for excess fat – was not related to BMI. In total, 94% of the boys and 84% of the girls with high levels of fat were correctly identified by the BMI (sensitivity), and 88% of the boys and 93% of the girls without high fat levels were also classified correctly (specificity). Hence, BMI seems to be an effective criterion for the screening of excess body fat in children and adolescents, although a substantial proportion of the subjects classified as overweight did not in fact have excess fat.
Currently, there are no specific anthropometric equations for the prediction of fat mass, fat-free mass and fat percentage in children younger than 13 years of age, making it useful to conduct these types of studies. Therefore, measurement of subcutaneous fat or percentage of body fat, in one or more places, estimates fat in certain body regions, limiting interpretation of the results. In 1967, Durnin and Rahaman33 had already reported equations to directly estimate the percentage of body fat through measurements of skin fold thickness in British adolescents, yielding a high correlation with BMI. Another method for evaluating the percentage of body fat in the field is bioelectric impedance. For example, Mast et al34 observed notable incoherences between the percentage of body fat through skin fold thickness and analysis through bioelectric impedance, recommending its use with adjustment tables and correction factors, derived from various algorithms for the different percentile groups by age, gender, and skin folds.
The definition of excess body fat is somewhat arbitrary even if the fat mass or the fat-free mass is known. Today, there is no consensus on the cutoff points of the percentages of fat that reflect obesity and overweight in children and adolescents. The most consistent values of the percentage of fat for the definition of excess body fat in adolescent girls ranges from 30 to 35%, while in boys these values are 25 and 30%. In 10-15-year-olds, excess fat is considered when values are above 25%.35,36 We found that from the p50, the percentage of fat was higher in girls than in boys, with sustained percentage differences of 4% after the age of 12 years. However, we did not observe percentages of body fat related to overweight and obesity. Morrison et al37 reported population-based values of fat percentage in girls between 9 and 19 years of age, with results far above those found for the same group of girls in this study. Likewise, unlike the results of this study, Mueller et al15 in 2004, and Moreno et al16 in 2005 observed that girls had similar values (p5 and p50 in both populations). This finding may be due in part to the different methods used to calculate the centile values (smoothed percentile curves through the LMS method), as well as to the geographic and anthropometric situation of the two populations.
We have previously shown that the increase in BMI in our population is due primarily to the increase in the higher levels of BMI distribution, indicating that susceptible individuals are progressively more obese.38,39 Recently, a similar observation was made in Spanish children and adolescents.40 The prevalence of childhood obesity has increased two-fold during the last 20 years and has been accompanied by the advent of the epidemic in type-2 diabetes and of the potentially devastating consequences of cardiovascular disease.41 Data from the International Obesity Task Force42 indicate that 22 million children below the age of 5 years are already overweight or obese. The Bogalusa Heart Study revealed that the distribution of abdominal fat, determined by waist circumference in children aged 5 to 17 years, was associated with abnormal concentrations of triglycerides, low-density lipoproteins, high-density lipoproteins, and insulin.43 In Colombia, the ENSIN-2005 Health Survey11 demonstrated that overweight was found in 3.1% of 0-4 year-olds, 4.3% of children aged 5 to 9 years, and 10.3% of children and adolescents aged between 10 and 17 years.
In agreement with the findings of this study, studies by Fernández et al44 in North American children from different racial origins and other investigators15,16,45 found that waist circumference showed an abnormal distribution, being higher in boys than in girls and increasing with age. The waists (p50) of girls aged between 6 and 12 years increased by 10cm and those of boys increased by 7cm; nevertheless, increases in each gender differed by age group. Similarly, Soar et al45 performed a study of Brazilian school-children and found an increase in waist circumference of 1cm/year, until the age of 9 years. Waist circumference in girls and boys aged between 6 and 11 years in this study differed from that in the NHANES III study by Freedman et al43 and Hirschler et al,46 but our results were similar to the national results reported by Benjumea et al,47 possibly explained by sexual maturity processes in each population. In general, wide variations can be observed in the prevalence of this risk factor in distinct populations, which may be explained by the variability of hereditary factors and life styles, further justifying the need for specific reference values classified by age and sex. Additionally, development must be monitored, especially in children who are not in daycare centers or in schools and in students in the first year of school to determine if there is any deterioration.
The limitations of this study, such as the characteristics of the population that are specific to the study design and the scarcity of resources, should be kept in mind when interpreting the results. Reference values for the body composition of children and adolescents are best obtained from longitudinal studies, which can evaluate natural changes in the distinct growth and development stages. However, this study provides data that serve as reference values for the BMI, fat percentage, and waist circumference of adolescents aged 10 to 16 years old, given that we evaluated not only excess body fat and weight, but also centile weight and height curves. The introduction of centile values will aid the classification of children and adolescents with respect to other reference populations, as well as estimation of the proportion of children and/or adolescents showing changes in anthropometric parameters. Despite the importance of anthropometric measurements, these indicators are still not routinely gathered as part of the health and nutrition assessment protocol of children and adolescents enrolled in schools in Colombia or in several other countries.
Conflict of interestsThe authors declare they have no conflict of interest.
FundingThis study was supported by the El Instituto Colombiano para el Desarrollo de la Ciencia y la Tecnología “Francisco José de Caldas” – COLCIENCIAS and La Universidad del Valle.